
The JasmCoin (JASMY) price had a great week, rising by 44.57% and reaching a two-month high of $0.0101 due to some futures market speculation and whale accumulation, according to Bankless Times. However, traders’ profit-taking caused a small decline on the last day.
The JASMY price is catching its breath after its strong rally, and honestly, this cooldown looks more like healthy consolidation than weakness.
While exchange supply is at a record low of 7.99M JASMY, there has been net selling over buying by 45M units in key trading sessions.
Rather than breaking down, the JASMY price has slipped into a tight consolidation – a healthy cooldown that’s holding firm without giving up any important ground. Right now, JASMY is sitting nicely above support, which means its overall bullish setup is still in place.
What the JASMY Chart Is Showing
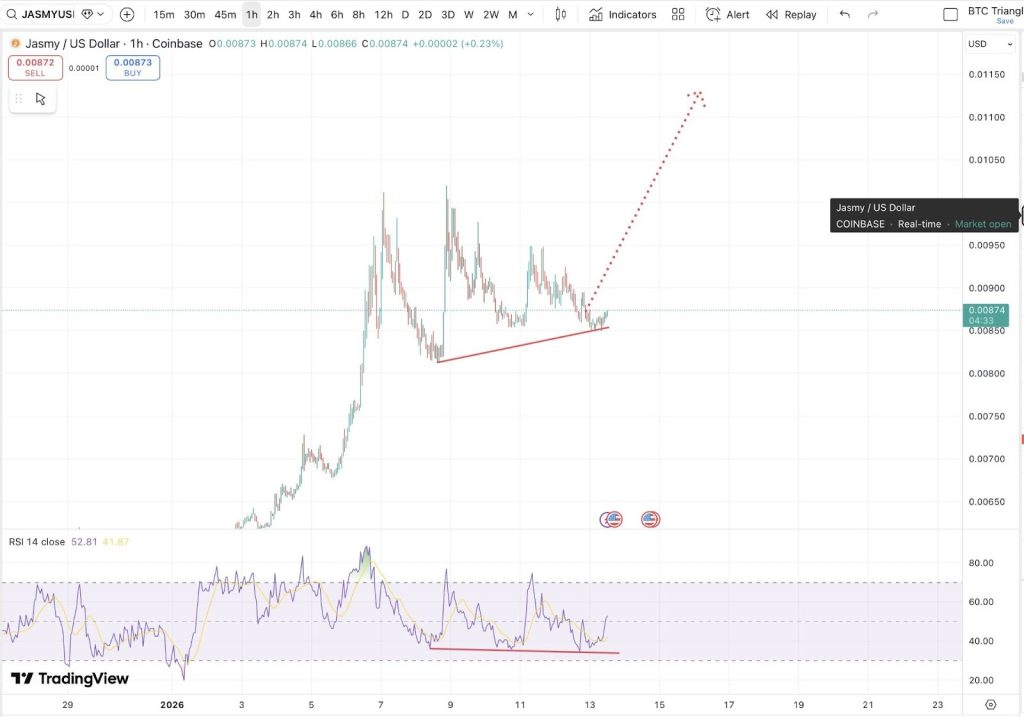
Looking at the chart, the dips have been pretty mild, with higher lows stacking up along that rising trendline. That kind of price action usually indicates that buyers are coming in early and are not waiting for deeper dips.
The consolidation looks orderly, and this more often than not is a signal of accumulation rather than distribution. An interesting clue is showing up in the RSI – analyst Matthew Dixon points out on X that the JASMY price is still holding its RSI support after the latest push higher.
Even as the price moves sideways, the RSI reflects a hidden bullish divergence – a setup that in many cases presages underlying strength and the potential for continuation once consolidation has ended.
_ Source: X/Matthew Dixon_
What comes next for JASMY
As far as JasmyCoin is concerned, there appears to be somewhat of a mixed sentiment surrounding this token.
On the positive side, the bulls are looking at accumulation patterns as well as the robotic aspect associated with this cryptocurrency as positives. On the negative side, the bears are looking at derivative weakness as well as fatigue on the charts as negatives.
The level to keep an eye on is the support area at $0.0085-$0.0090. If the JASMY price manages to hold this area, it could place more emphasis on the breakout play. However, if it falls below, we could see the orderly unwinds come into play.”
The important question for now is whether JASMY can keep this structure going. While price is holding above its rising support and RSI is supported, the setup favors another push higher rather than a deeper retracement.
While short-term chop is still possible, the current chart suggests that this pause could be simply the market resetting for the next leg up.
_****SUI Price Is Back at a Familiar Level That Fueled Rallies: Here’s What Must Happen First**
Disclaimer: The information on this page may come from third parties and does not represent the views or opinions of Gate. The content displayed on this page is for reference only and does not constitute any financial, investment, or legal advice. Gate does not guarantee the accuracy or completeness of the information and shall not be liable for any losses arising from the use of this information. Virtual asset investments carry high risks and are subject to significant price volatility. You may lose all of your invested principal. Please fully understand the relevant risks and make prudent decisions based on your own financial situation and risk tolerance. For details, please refer to
Disclaimer.
Related Articles
PEPE Consolidates Above $0.05324 Support as Momentum Strengthens and Resistance Near $0.05336 Holds
PEPE has a tight intraday price compression with a support level of $0.053243 and resistance level of $0.053363.
A RSI of 64.13 represents the moderate bullish momentum whereas MACD history is slightly positive, which indicates the gradual buying momentum.
The price is at $0.053364
CryptoNewsLand19m ago
HYPE Hits $35.53 After 2.4% Jump — Will Momentum Hold as Price Tests $35.59 Resistance?
Hyperliquid’s HYPE trades at $35.53, approaching the $35.59 resistance after a 2.4% daily gain.
The chart shows the $33.67 zone acting as support after price moved above a previously contested level.
Price now trades between $33.67 support and $35.59 resistance, shaping the immediate
CryptoNewsLand24m ago
Cardano áp sát mốc 0,28 USD khi lực mua nhỏ lẻ tăng mạnh – Đà bứt phá đã cận kề?
The current price of Cardano (ADA) is around $0.270, having risen from a support level of $0.254-$0.260. It underwent a dip to $0.2194 before buyers returned, leading to a structure indicating accumulation. The price tests resistance at $0.287, while whale activity raises market uncertainty. Despite a reduction in ADA holdings among large wallets, the supply remains concentrated in their hands, suggesting strategic liquidity reallocation rather than widespread selling. Meanwhile, retail investors continue accumulating ADA.
TapChiBitcoin2h ago
Bitcoin MVRV Z-Score Drops Below 1 Again
The MVRV Z-Score is a key on-chain indicator for assessing Bitcoin's value by comparing market and realized capitalizations. Historical data shows that when the score drops below 1, it often signals significant market recovery. However, changing market dynamics and institutional influences may alter future patterns.
Coinfomania3h ago
「刻舟求劍」式幣價預測走紅,玄學預言的實戰邏輯與缺陷
作者:Frank,PANews
每當市場進入不上不下的迷惘階段,就會有人試圖用「刻舟求劍」式的歷史回溯方法去預測下一段走勢。在這種情況下,人們往往能從這些理論和圖表中看到歷史總是在重演,並似乎自動將未來一段時間的行情走勢與過去的某一段進行重疊驗證。
這種重合似乎有著神奇的效果,也常常被驗證。有部落客自稱這種預測的準確率能到達 75%~80% 。
這種在社群媒體上屢屢爆紅的「刻舟求劍」式價格預測,究竟是在幫助市場識別階段,還是在把噪音包裝成預言?
從「滴答分形」到「歷史押韻」
關於 2025 年 10 月市場頂點預測的巔峰操作是名為 CryptoBullet 的分析師,他所創建的一種名為「ti
区块客4h ago
Dogecoin (DOGE) Prints Abnormal $0 as Short Sellers Disappear - U.Today
Dogecoin's recent rally saw $0 in short liquidations, indicating traders were betting long. Despite a 4.61% decline due to market pullback, volume remained high. The potential for DOGE to reach $0.10 depends on Bitcoin's recovery.
UToday4h ago