
The JASMY chart is finally starting to behave differently, and that’s what makes this setup interesting. For a long time, every rally ran into sellers and faded back lower.
The trend leaned down, momentum stayed weak, and buyers never really got control. This latest move stands out because that pattern appears to be changing.
What Javon Marks calls the “major break” lines up well with what the chart is showing. Jasmy has spent months compressing inside descending wedge structures.
Each time, the JASMY price drifted lower in a controlled way, volatility dried up, and then a sharp move followed. The difference this time is that the breakout actually stuck. Instead of rolling back over, price pushed through wedge resistance and held above it.
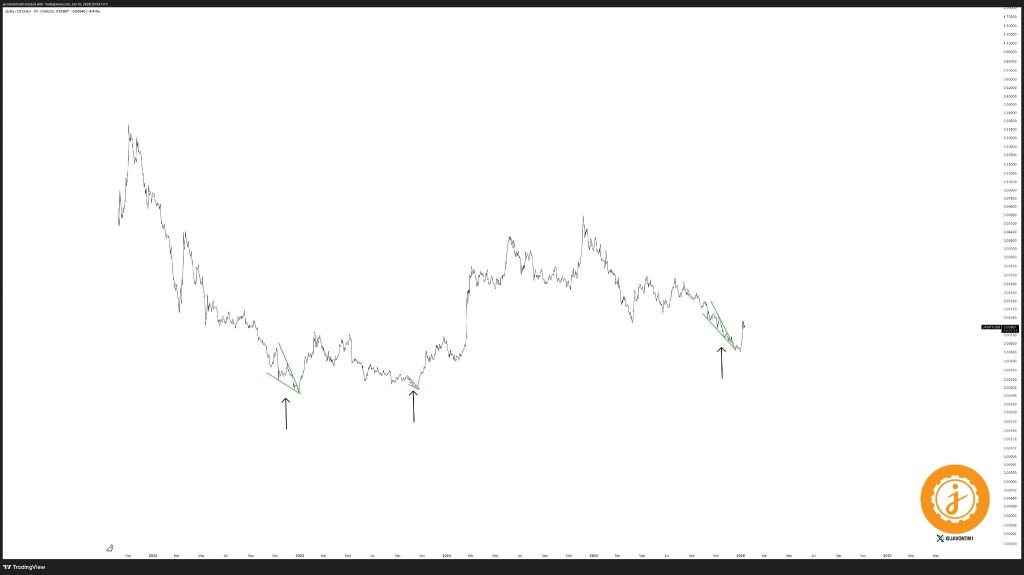
Source: X/@JavonTM1
- What the JASMY chart is telling us now
- Key levels that matter from here
- JASMY price prediction and the bigger picture
What the JASMY chart is telling us now
The most important shift is behavioral. JAMSY is no longer reacting like an asset that gets sold into every bounce. Buyers are starting to step in earlier and defend pullbacks.
After breaking out of the wedge, the price didn’t immediately give everything back. Instead, it began forming a base above the former resistance area, which is a subtle but meaningful change.
In the short term, the goal for the JASMY price is simple. It needs to stay above that breakout zone. As long as price doesn’t slide back into the old wedge, the structure remains constructive. That’s what separates a real trend change from a temporary relief bounce.
Silver Price Prediction for 2026–2030: Where Silver Could Be Headed Next_**
Key levels that matter from here
On the upside, the next area to watch is the prior reaction zone overhead, where Jasmy previously struggled before the last leg lower. If price can work through that region and hold, it opens the door to a broader upside move toward the next range highs visible on the chart.
On the downside, the risk is also clear. If the JASMY price falls back below the breakout area and re-enters the wedge, the market would likely treat this move as a failed breakout. That scenario usually leads to price drifting back toward recent lows as confidence fades.
JASMY price prediction and the bigger picture
Right now, the most realistic JASMY price prediction depends on confirmation, not hype. If price continues to hold the breakout zone and prints higher lows, continuation becomes the more likely path.
That’s when overhead resistance levels start to matter again, and momentum traders pay closer attention. If that confirmation doesn’t show up, patience is still required. The chart has improved, but it hasn’t fully proven itself yet.
Jasmy isn’t about chasing a single green candle. It’s about watching whether structure continues to improve, because that’s what ultimately decides where the next meaningful move heads.
Disclaimer: The information on this page may come from third parties and does not represent the views or opinions of Gate. The content displayed on this page is for reference only and does not constitute any financial, investment, or legal advice. Gate does not guarantee the accuracy or completeness of the information and shall not be liable for any losses arising from the use of this information. Virtual asset investments carry high risks and are subject to significant price volatility. You may lose all of your invested principal. Please fully understand the relevant risks and make prudent decisions based on your own financial situation and risk tolerance. For details, please refer to
Disclaimer.
Related Articles
Shiba Inu Price Compression Signals Imminent Breakout Phase
Key Insights:
Shiba Inu trades near $0.0000060 as tightening volatility and reduced momentum signal an approaching breakout phase after months of sustained decline.
Open interest declines to $68 million, while persistent spot outflows highlight cautious sentiment and limited conviction
CryptoNewsLand26m ago
XRP Price Nears $1.50 Breakout as Triangle Tightens
Key Insights:
XRP consolidates within a symmetrical triangle, with tightening price action suggesting a potential breakout toward higher resistance levels as bullish momentum continues building.
Supertrend turning green and MACD rising indicate increasing buying pressure, supporting a bullis
CryptoNewsLand30m ago
Solana Price Holds Range as $90 Resistance Caps Breakout
Key Insightsthe price
Solana trades between $85 and $86 after a pullback, while an ascending channel pattern supports bullish structure with strong demand near support levels.
Momentum indicators, including MACD and Aroon, suggest strengthening buying pressure, reinforcing expectations of a
CryptoNewsLand35m ago
CryptoQuant Analyst: Bitcoin Must Hold Above $83K to Confirm Market Recovery
Gate News message, April 26 — According to CryptoQuant analyst Axel Adler, short-term holder (STH) selling pressure has notably eased following spring market stress relief, and Bitcoin's market recovery remains underway. Current BTC price has approached the short-term holder cost basis.
Adler
GateNews4h ago
XRP Market Shows Leverage Reset Amid Divergence Between Derivatives Pressure and Spot Strength
Gate News message, April 26 — XRP's market structure is displaying signs of significant repositioning, with data showing a complex divergence between derivatives and spot activity. According to market analysis, leveraged longs on major CEX perpetuals are being unwound even as spot price remains
GateNews5h ago
Bitcoin Perpetual Contracts: Large Holders Earn Fees While Retail Traders Pay, Says Chief Economist
Gate News message, April 26 — Fu Peng, newly appointed chief economist at Xinhuojituan, explained the underlying business model of Bitcoin perpetual contracts on social media, comparing it to traditional finance's "deferred fees" or "overnight fees" used in precious metals and commodity spot
GateNews5h ago