
As the new year 2026 begins, the broader cryptocurrency market has shown modest strength over the past few hours, with both Bitcoin (BTC) and Ethereum (ETH) turning slightly green. This improvement in sentiment has started to spill over into the altcoin market as well, with several tokens attempting to build upward momentum — including Render (RENDER).
RENDER is currently up around 4% on the day, but the more compelling development lies beneath the surface. On lower timeframes, price action is beginning to highlight a constructive bullish structure that could soon pave the way for a meaningful breakout if confirmed.
Source: Coinmarketcap
Ascending Triangle Structure Takes Shape
On the 4-hour chart, RENDER appears to be forming a textbook ascending triangle, characterized by a sequence of higher lows pressing steadily against a well-defined horizontal resistance zone. This structure is widely viewed as a bullish continuation pattern, particularly when it develops after a period of consolidation and shows signs of accumulation.
RENDER recently faced rejection near the $1.36 neckline resistance, which pushed price back toward its rising support trendline around the $1.28 region. However, each pullback has been met with strong buying interest, keeping the pattern intact and preventing any deeper breakdown. This behavior suggests that sellers are gradually losing control as buyers continue to step in at higher levels.
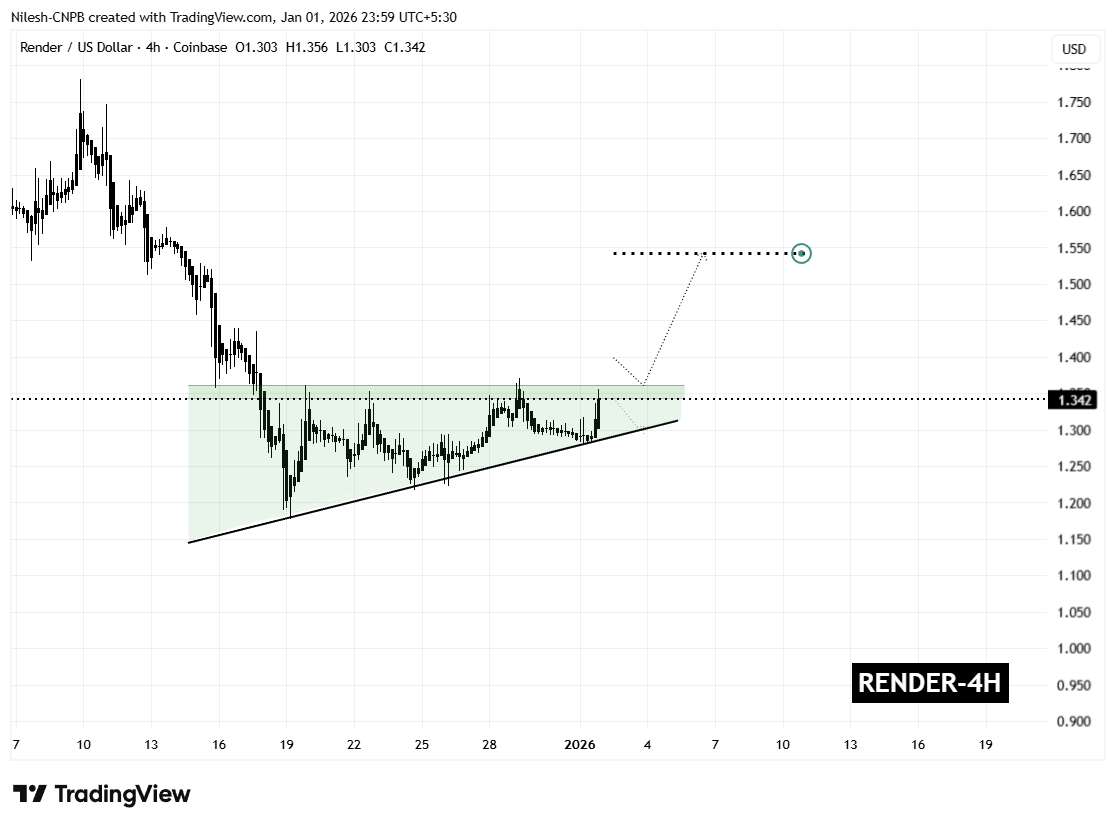
Render (RENDER) 4H Chart/Coinsprobe (Source: Tradingview)
The latest rebound has carried RENDER back toward the upper boundary of the pattern, reinforcing the idea that demand remains firm. Rather than signaling weakness, this price action points to healthy consolidation as the market tightens ahead of a potential breakout.
What’s Next for RENDER?
From here, RENDER appears to be preparing for another test of the $1.36 resistance zone. A confirmed breakout and sustained close above this level, ideally followed by a successful retest as support, would validate the ascending triangle structure and likely trigger a bullish expansion phase.
Based on the measured move of the pattern, the technical upside projection points toward the $1.54 region. This target represents a potential upside of roughly 14% from current levels and also aligns with previous price structure, strengthening the bullish case.
That said, caution remains warranted. A failure to break above resistance could result in a pullback toward the rising support trendline. As long as that trendline continues to hold, the broader bullish structure would remain intact. A decisive breakdown below support, however, would invalidate the pattern and delay any breakout scenario.
For now, the combination of improving market sentiment, persistent buying pressure, and a tightening ascending triangle structure suggests that Render is approaching a critical decision point — one that could define its next significant move as 2026 gets underway.
Disclaimer: The views and analysis presented in this article are for informational purposes only and reflect the author’s perspective, not financial advice. Technical patterns and indicators discussed are subject to market volatility and may or may not yield the anticipated results. Investors are advised to exercise caution, conduct independent research, and make decisions aligned with their individual risk tolerance.
About Author: Nilesh Hembade is the Founder and Lead Author of Coinsprobe, with over 5 years of experience in the cryptocurrency and blockchain industry. Since launching Coinsprobe in 2023, he has been providing daily, research-driven insights through in-depth market analysis, on-chain data, and technical research.
Disclaimer: The information on this page may come from third parties and does not represent the views or opinions of Gate. The content displayed on this page is for reference only and does not constitute any financial, investment, or legal advice. Gate does not guarantee the accuracy or completeness of the information and shall not be liable for any losses arising from the use of this information. Virtual asset investments carry high risks and are subject to significant price volatility. You may lose all of your invested principal. Please fully understand the relevant risks and make prudent decisions based on your own financial situation and risk tolerance. For details, please refer to
Disclaimer.
Related Articles
US Bitcoin Spot ETF Attracts Inflows for Seven Consecutive Days, Institutional Funds Return
U.S. cryptocurrency spot ETFs have recently seen a warming in capital inflows, particularly ahead of the Federal Reserve's interest rate decision, as investor interest in digital assets has rebounded. Bitcoin and Ethereum spot ETFs have recorded net inflows for multiple consecutive days, with Bitcoin attracting $199.4 million in a single day, marking a record of seven consecutive days of inflows. This phenomenon reflects increased institutional capital allocation, with market structure showing that investors are increasingly inclined to invest through regulated products, strengthening market support.
区块客25m ago
Bitcoin and Stocks Need to Confirm First: The Real Altcoin Recovery Timeline
The current crypto market continues to struggle without a clear altseason, as Bitcoin remains in a sideways trend. Analysts suggest that until Bitcoin shows a confirmed bullish structure and macroeconomic conditions improve, altcoins will likely remain stagnant. Speculation points to potential recovery in Q3 to Q4 rather than the earlier hoped-for timeline.
CaptainAltcoin36m ago
Bitcoin Decouples From S&P 500 as Retail Demand Weakens
Bitcoin retail activity has decreased by 10%, the lowest since January 2025, indicating weaker market participation. The advent of ETFs has shifted retail access off-chain, while Bitcoin has diverged from the S&P 500, marking its longest decoupling since 2020 amid a correction phase.
CryptoFrontNews50m ago
XRP stuck below $1.60 despite individual wallets hitting 5.66 million peak - Why?
Investor interest in Ripple (XRP) is recovering, primarily driven by retail investors, with a rise in wallets holding under 100 XRP. Meanwhile, whale activity is cautiously returning, indicating improved market sentiment but the potential for further price declines remains.
TapChiBitcoin4h ago
BTC Up 0.51% in 15 Minutes: Whale Position Reallocation and Exchange Outflow Resonance Drive Gains
March 22, 2026, 12:15 to 12:30 (UTC): BTC price fluctuated between 68313.3 and 68758.0 USDT, with the 15-minute candlestick recording a return of +0.51%, amplitude reaching 0.65%, and short-term trading volume remaining at relatively low levels. Market attention rebounded, driving increased intraday volatility.
The primary driver of this movement is whale funds experiencing simultaneous high net inflows and outflows on trading platforms. On-chain data shows that certain whales holding positions for 6 to 18 months are choosing to transfer BTC back to exchanges for distribution.
GateNews4h ago
