
Polygon (POL) has quietly become one of the strongest performers in the market over the past week. The POL price is up around 25% over the last seven days, even though price has barely moved in the past day.
At writing, POL is trading near $0.128, with daily trading volume up roughly 35%, placing it among the top gainers in the market.
This move did not come out of nowhere. It lines up with a clear jump in network usage, rising revenue, and a sharp increase in token burns.
_****Top Analyst Goes All In on Kaspa (KAS): Reveals Why It Beats Most Altcoins**
One of the biggest factors behind Polygon recent strength is revenue. Polygon moved into the top three on-chain revenue generators, flipping both SUI and Redbelly.
There has been an increase in stablecoins on the network, particularly due to the increase in transaction volume on the Polygon network, which is directly reflected in fees.
To accommodate the increasing demand, Polygon raised the gas limit to 65M and adjusted the parameters of EIP-1559 for smoother gas prices.
The network also aims to improve throughput. The goal is to exceed 5,000 transactions every second. These changes are meant to reduce congestion and support larger applications without slowing the network.
Daily transaction counts have backed this up. Polygon processed millions of transactions per day recently, with some days crossing the 3 million mark, showing that usage is not just theoretical.
Another major tailwind for POL is supply reduction. Polygon is now burning roughly 1 million POL tokens per day through base fees. If that pace holds, it could remove about 3.5% of the total supply annually.
At the same time, around 3.6 billion POL tokens are staked, which is roughly 34% of the circulating supply. That combination matters. Burns reduce supply permanently, while staking locks tokens out of circulation.
Together, they lower sell pressure and tighten available liquidity. This shift is happening while network demand is growing, which is why the market is reacting.
_****Ethereum (ETH) Just Hit a “Real” All-Time High That Nobody Is Watching**
What the Polygon Chart Is Showing
On the 4H chart, POL spent months moving lower before finally finding support around $0.10. Since that low, the POL price has started to step up gradually, with each pullback stopping higher than the last, showing that sellers are losing control.
This recent advance has occurred on increasing participation levels, leaving no doubt that this advance is supported by genuine participation levels and not a shallow bounce. OBV has started to turn up after a long decline, suggesting accumulation rather than distribution.
Volatility remains relatively low, as shown by a muted ATR, which often appears during early trend shifts before momentum expands.
Funding rates are close to neutral, meaning the move has not been driven by excessive leverage. In short, the Polygon chart shows stabilization first, then gradual strength, not a blow-off move.
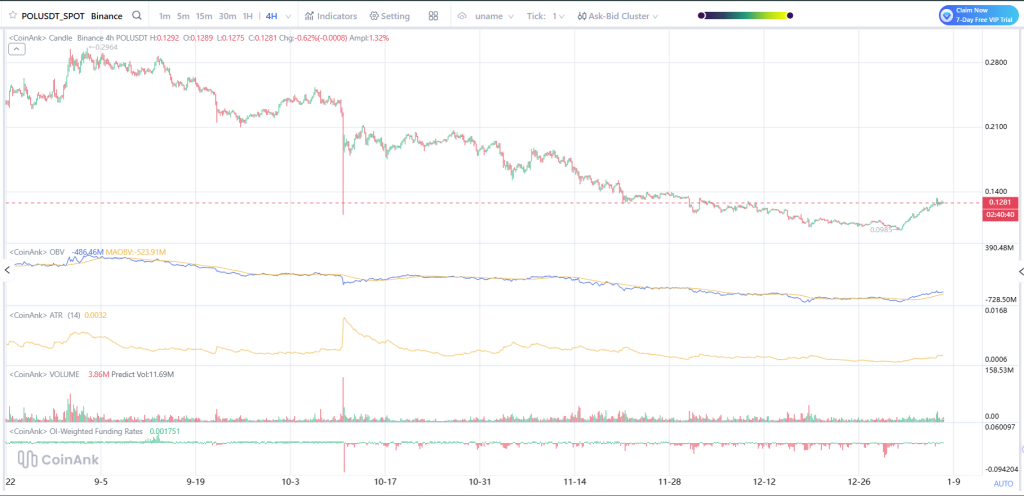
Source; Coinank
_****Here’s Why the XRP Price Pump May Be on Thin Ice**
What’s Happening Next For Polygon?
Beyond price action, Polygon is positioning itself for longer-term relevance. The ecosystem is expanding across payments, DeFi, privacy tooling through Miden, and AI-focused initiatives.
Large enterprises already use Polygon for real-world applications, which keeps fee revenue tied to actual usage rather than speculation. This recent POL price rally reflects that shift. The market is reacting to fundamentals catching up with price.
Moreover, Polygon (POL) 25% weekly move has already played out, which explains why price is consolidating today.
As long as the POL price holds above recent support and network metrics stay strong, the structure remains constructive.
This rally is not just about momentum. It is about usage, revenue, and supply tightening showing up at the same time. That is why POL has moved higher while much of the market has remained choppy.
Disclaimer: The information on this page may come from third parties and does not represent the views or opinions of Gate. The content displayed on this page is for reference only and does not constitute any financial, investment, or legal advice. Gate does not guarantee the accuracy or completeness of the information and shall not be liable for any losses arising from the use of this information. Virtual asset investments carry high risks and are subject to significant price volatility. You may lose all of your invested principal. Please fully understand the relevant risks and make prudent decisions based on your own financial situation and risk tolerance. For details, please refer to
Disclaimer.
Related Articles
TRUMP Token Whales Hit Five-Month High, Trump Dinner Effect Drives 36% Surge
Trump meme coin TRUMP surged approximately 36% following the announcement of an exclusive dinner event, with whale holdings reaching a five-month high. Large holders are actively increasing positions, but losses are also present in the market, indicating divergent investment behavior. Controversy sparked by political criticism may have limited impact on market performance, but regulatory investigation risks remain a concern to monitor.
MarketWhisper21m ago
Bitcoin Spot ETF Saw $760 Million in Inflows Last Week! But Whether the Rally Continues Requires Monitoring 3 Key Factors
US cryptocurrency spot ETFs showed a significant rebound last week, with Bitcoin and Ethereum recording net inflows of approximately $763.4 million and $160.9 million respectively, with prices bouncing back accordingly. Although the market is showing incremental buying signals, it still faces variables from central bank policies and geopolitical risks in the future. The market will continue to monitor ETF capital inflows and macroeconomic impacts.
CryptoCity36m ago
Market rally continues! Bitcoin returns to $75,000 level, ETF inflows persist
Bitcoin broke through $74,000 on March 16 as institutional capital flowed back into the market, with ETF net inflows reaching $1 billion, shifting market sentiment to bullish. Analysts predict Bitcoin could reach $80,000, but it is currently in a consolidation phase. $75,000 is a key resistance level; a breakout could lead to a test of $90,000, otherwise it risks a pullback.
区块客43m ago
MICA Daily | BTC Stable Above 30-Day Moving Average, Continues to Show Bullish Outlook
According to Binance data, Bitcoin's moving average convergence divergence indicator shows significant improvement in its price trend structure, with current trading price around $73,000, and moving averages in a divergent state, reflecting a market transition phase. Technical analysis indicates that the 30-day moving average is of high importance; if the price maintains above this moving average, it indicates buying support, otherwise it may enter a correction phase. Investors will judge the trend based on changes in moving averages.
区块客47m ago
Bitcoin Surges Toward $75,000: $600 Million Short Liquidations Drive Rally, ETF Inflows Emerge as Key Variable
On March 17, Bitcoin tested the 75,000 US dollar level driven by short liquidations, briefly reaching 75,653 US dollars before retreating. This rally was accompanied by massive liquidations totaling approximately 609 million US dollars in 24 hours, with shorts accounting for a significant proportion. Market sentiment has recovered somewhat, with capital inflows into spot demand and ETF support driving Bitcoin's rally. Future price movements will be influenced by sustained capital inflows and macroeconomic data.
GateNews1h ago
