
**Date: **Mon, Jan 05, 2026 | 07:04 AM GMT
As 2026 kicks off, the broader cryptocurrency market is showing renewed stability. Ethereum (ETH) is up around 4% on the week, and improving sentiment is gradually spreading across major altcoins — including the AI-focused blockchain token Near Protocol (NEAR).
NEAR has already gained more than 10% on a weekly basis, but the more important development is unfolding beneath the surface. Recent price action points to a notable structural shift — one that could mark the early stages of a bullish continuation if key resistance levels are reclaimed.
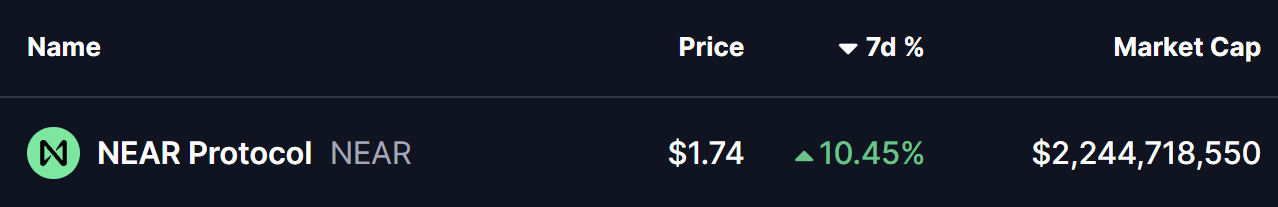
Source: Coinmarketcap
Rounding Bottom in Play
On the daily timeframe, NEAR appears to be forming a rounding bottom pattern, a classic bullish reversal structure that typically emerges after a prolonged corrective phase. This pattern reflects a gradual transition from distribution to accumulation, as selling pressure fades and buyers slowly regain control.
The setup began after NEAR faced a firm rejection near the $1.88 region late last month. That rejection triggered a sharp decline, dragging price down toward the $1.40 area. Importantly, sellers failed to push price meaningfully lower from there, and strong demand emerged at those levels. Over time, NEAR stabilized, volatility compressed, and price began to curl higher — completing the rounded base structure.
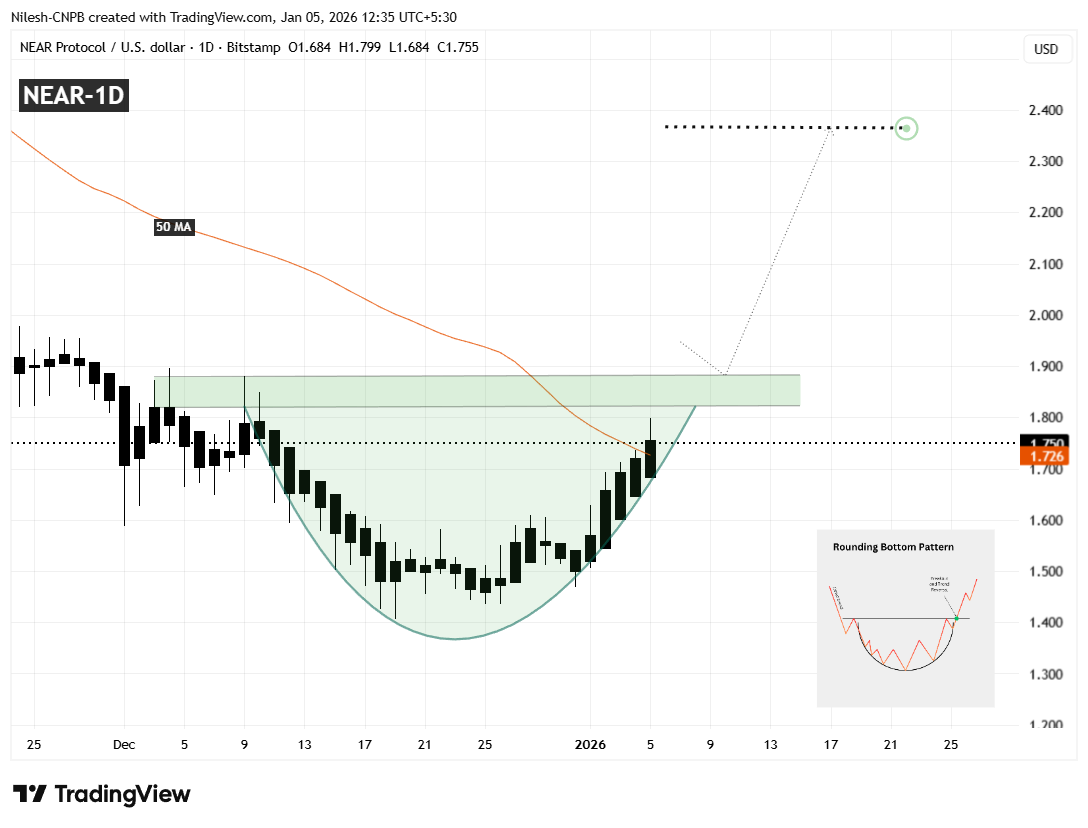
Near Protocol (NEAR) Daily Chart/Coinsprobe (Source: Tradingview)
After reclaiming the 50-day moving average near $1.726, NEAR has shown improving momentum. Currently, price is trading around the $1.75 level and pressing up against a well-defined resistance zone between $1.82 and $1.88. This area represents the neckline of the rounding bottom pattern and has capped upside attempts multiple times in the past, making it the most critical level to watch in the near term.
What’s Next for NEAR?
If NEAR continues to hold the 50-day moving average as support, a clean daily close above the $1.82–$1.88 resistance zone would confirm the bullish rounding bottom breakout. A successful breakout followed by a retest of this zone as support would significantly strengthen the bullish case and signal that a new upward leg is underway.
Based on the depth of the rounding structure, the projected upside target points toward the $2.36 region. Reaching that level would imply a potential upside of roughly 35% from current prices, aligning well with the measured move typically associated with this pattern.
That said, patience remains important. Before any confirmed breakout, NEAR could still experience short-term pullbacks — including a dip toward the rising base of the rounding structure, which has been acting as dynamic support during the recovery. Such pullbacks would not invalidate the bullish setup as long as price continues to hold above the higher-low structure.
Until a decisive breakout and follow-through occur, traders may want to remain cautious and avoid chasing price. The $1.82–$1.88 zone remains the line in the sand that will determine whether NEAR transitions into a sustained bullish phase or remains range-bound for longer.
Disclaimer: The views and analysis presented in this article are for informational purposes only and reflect the author’s perspective, not financial advice. Technical patterns and indicators discussed are subject to market volatility and may or may not yield the anticipated results. Investors are advised to exercise caution, conduct independent research, and make decisions aligned with their individual risk tolerance.
About Author: Nilesh Hembade is the Founder and Lead Author of Coinsprobe, with over 5 years of experience in the cryptocurrency and blockchain industry. Since launching Coinsprobe in 2023, he has been providing daily, research-driven insights through in-depth market analysis, on-chain data, and technical research.
Disclaimer: The information on this page may come from third parties and does not represent the views or opinions of Gate. The content displayed on this page is for reference only and does not constitute any financial, investment, or legal advice. Gate does not guarantee the accuracy or completeness of the information and shall not be liable for any losses arising from the use of this information. Virtual asset investments carry high risks and are subject to significant price volatility. You may lose all of your invested principal. Please fully understand the relevant risks and make prudent decisions based on your own financial situation and risk tolerance. For details, please refer to
Disclaimer.
Related Articles
Fractal model predicts Bitcoin will hit bottom in October 2026
Bitcoin shows positive recovery signals, improving market sentiment after a long phase of volatility. However, experts believe the current uptrend is short-term, with deeper correction risks ahead. According to Crypto Rover's fractal model, Bitcoin's price follows a four-year cycle influenced by halving events. The current cycle likely peaked in late 2025, with further declines expected before a potential bottom around 2026. Short-term price fluctuations can mislead investors, emphasizing the importance of understanding these cycles for long-term trends.
TapChiBitcoin4m ago
Bittensor Holds Strength but Faces Resistance Near $285 Level
Key Insights:
Bittensor maintains strong short-term momentum above key averages, while ETF developments and high staking levels continue shaping liquidity and investor demand dynamics.
Overbought technical indicators signal stretched conditions, even as bullish momentum persists,
CryptoFrontNews41m ago
Dogecoin Slides Despite Elon Musk Reviving DogeFather Persona
Key Insights
Elon Musk’s DogeFather post sparked attention, yet Dogecoin’s price declined, showing limited market reaction despite strong social media engagement and renewed community discussion.
Dogecoin traded near $0.093 after a failed recovery attempt, with steady volume and moderate
CryptoFrontNews45m ago
Trump Issues 48-Hour Ultimatum to Iran, Bitcoin Drops Below 69,200 on Weekend
On March 22, following Trump's ultimatum to Iran, Bitcoin fell below $69,200, declining 2.2% over 24 hours. Market sentiment impacted mainstream crypto assets broadly, with declines across the board despite the Federal Reserve maintaining interest rates unchanged. War risk has made traders cautious. If Iran fails to restore Strait of Hormuz passage, the conflict could escalate, impacting global energy transportation.
GateNews1h ago
How High Can Ripple’s XRP Price Go This Week?
XRP's price is down due to a market-wide decline, particularly influenced by Bitcoin's pullback. Currently, XRP faces resistance around $1.45, with sideways movement indicating market uncertainty. The next price movement may rely on Bitcoin's stability.
CaptainAltcoin1h ago
Bitcoin dips back below $75,000 on the eve of the Federal Reserve decision
Bitcoin recently touched $75,000 but failed to sustain the level, pulling back to $74,000, reflecting cautious sentiment among investors ahead of the upcoming Federal Reserve interest rate decision. Geopolitical risks and elevated energy prices have driven inflation higher, affecting market expectations for rate cuts and pushing the timeline for cuts to year-end. Technical analysis shows Bitcoin remains strong but has not confirmed a decisive breakout above the $75,000 level, with limited upside potential in the near term.
区块客2h ago
