
Date: Sat, Jan 03, 2026 | 06:50 PM GMT
As 2026 kicks off, the broader cryptocurrency market is showing renewed stability. Ethereum (ETH) has reclaimed the $3,100 mark, and momentum is gradually spreading across major altcoins — including Bittensor (TAO).
TAO is trading around 3% higher on the day, extending its weekly gains to nearly 14%. While the short-term strength is encouraging, the more important development lies in the structure forming on the chart. Recent price action suggests a meaningful shift in market behavior — one that could signal the early stages of a bullish continuation if key levels are reclaimed.
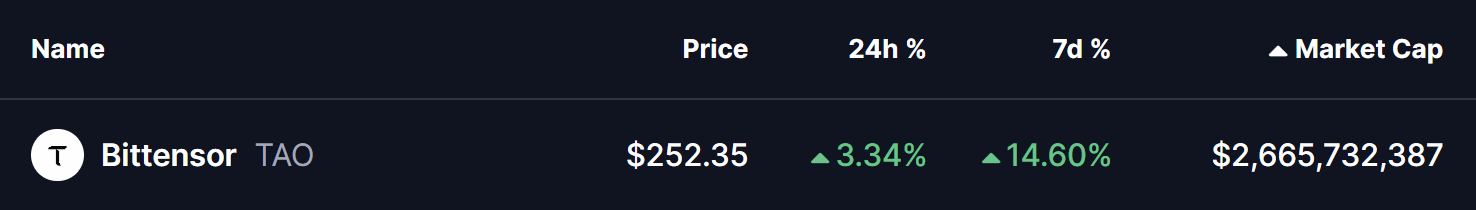
Source: Coinmarketcap
Rounding Bottom Pattern Takes Shape
On the 4-hour timeframe, Bittensor appears to be forming a rounding bottom pattern, a classic bullish reversal structure that typically develops after an extended corrective phase. This pattern reflects a gradual transition from distribution to accumulation, where selling pressure fades and buyers begin to step in more consistently.
The setup began after TAO faced a firm rejection near the $315 neckline resistance, which triggered a sharp decline through late November and December. That move eventually found strong demand near the $206 support zone, where selling momentum stalled. Multiple defenses of this level prevented any deeper breakdown and helped establish a solid base for a potential trend reversal.
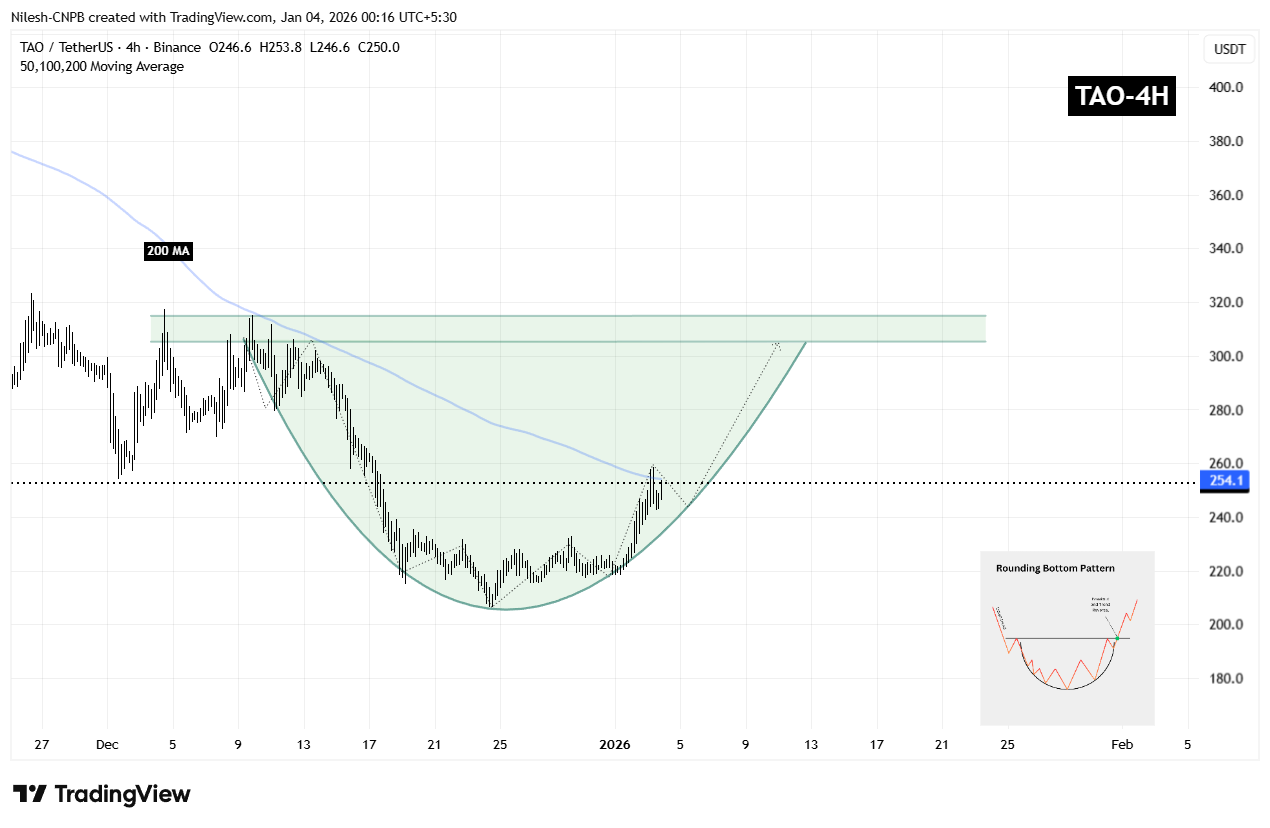
Bittensor (TAO) 4H Chart/Coinsprobe (Source: Tradingview)
Since carving out that bottom, TAO has started to curve higher in a smooth, rounded fashion — closely matching the textbook structure of a developing rounding bottom. The recent recovery has also brought price back toward the 200-period moving average near $254, a level that previously acted as resistance and is now being tested as potential support.
What’s Next for TAO?
If TAO manages to hold above the 200 MA, that level could act as short-term support and provide a foundation for further upside attempts. A clean breakout above the $315 resistance zone, followed by sustained acceptance above it, would validate the entire reversal structure and likely open the door for a broader bullish expansion phase, with momentum traders re-entering the market.
Until that breakout occurs, the pattern remains in development. Short-term consolidation or shallow pullbacks remain possible, particularly as price digests recent gains. However, as long as TAO continues to maintain higher lows above the established base, the broader bottoming structure remains intact and constructive.
For now, the chart suggests that TAO is approaching a critical confirmation phase — one that could determine whether this recovery evolves into a sustained bullish trend as the new year unfolds.
Disclaimer: The views and analysis presented in this article are for informational purposes only and reflect the author’s perspective, not financial advice. Technical patterns and indicators discussed are subject to market volatility and may or may not yield the anticipated results. Investors are advised to exercise caution, conduct independent research, and make decisions aligned with their individual risk tolerance.
About Author: Nilesh Hembade is the Founder and Lead Author of Coinsprobe, with over 5 years of experience in the cryptocurrency and blockchain industry. Since launching Coinsprobe in 2023, he has been providing daily, research-driven insights through in-depth market analysis, on-chain data, and technical research.
Disclaimer: The information on this page may come from third parties and does not represent the views or opinions of Gate. The content displayed on this page is for reference only and does not constitute any financial, investment, or legal advice. Gate does not guarantee the accuracy or completeness of the information and shall not be liable for any losses arising from the use of this information. Virtual asset investments carry high risks and are subject to significant price volatility. You may lose all of your invested principal. Please fully understand the relevant risks and make prudent decisions based on your own financial situation and risk tolerance. For details, please refer to
Disclaimer.
Related Articles
Why Did Bitcoin Drop Today? Dormant Whale Awakens After 11 Years and Liquidates Holdings, Hormuz Crisis Spreads
Bitcoin has recently been affected by supply shocks and geopolitical pressures, with prices declining from their highs to approximately $69,500. Large volumes of bitcoin entering exchanges have triggered market panic. Major sellers include dormant wallets resuming activity and early investors taking profits. Technically, bitcoin has broken below the $72,000 support level, with $64,000 becoming a critical support level. A breach of this level could expose the asset to further downside risk.
MarketWhisper21m ago
US-Iran Tensions Escalate, Bitcoin Viewed as "Flight Asset"
US-Iran tensions are escalating, with markets beginning to price in prolonged conflict, impacting oil, shipping, and supply chain costs. Investors are focusing on hard assets and related resource sectors, while facing stagflation risks. It is recommended to adopt defensive trading strategies and currency diversification.
GateNews35m ago
Six Countries' Joint Statement on Defending the Strait of Hormuz, But No Specifics on What to Do? Brent Crude Falls Below $110
The UK, France, Germany, Italy, the Netherlands, and Japan released a joint statement on the 19th, committing to take "appropriate measures" for navigation safety in the Strait of Hormuz, but did not specify concrete actions, leaving political flexibility. The statement condemned Iran's attacks on commercial vessels, demanded its compliance with international law, and supported increased production to stabilize energy markets. This declaration has sparked external scrutiny and analysis, particularly regarding the ambiguity of the term "appropriate measures."
動區BlockTempo51m ago
Solana Price Trend Shows Bearish Technical Pattern, Higher Time Frames Exhibit Weakness
Gate News Report: On March 20, Solana (SOL) price action displayed bearish technical formations on higher timeframes, with the market showing weakness. Technical charts indicate that SOL has formed bearish structures across multiple timeframes, with price action under pressure.
GateNews1h ago
Israel Signals De-escalation in Conflict, Oil Prices Decline, Bitcoin Rebounds After Breaking Below 69K
Israeli Prime Minister Netanyahu's speech prompted oil prices to decline and reduced market tension. The crypto market continued to weaken, with Bitcoin briefly falling below 69K. ETF outflows indicate institutional profit-taking, and the Fear and Greed Index has retreated into the fear zone.
ChainNewsAbmedia1h ago
SOL price is positioned in the $92-95 range, with the market in a recovery phase.
Gate News update: On March 19th, Solana (SOL) price is currently trading in the $92-95 range. Recent price movements indicate that the market is in a recovery phase, with prices fluctuating within this range.
GateNews3h ago
