On December 31st, the market reported that Bitwise has officially filed for the issuance of 11 cryptocurrency ETF funds, with Sui being one of the notable altcoins included in the list.
Following this development, the price of SUI surged strongly, increasing nearly 19% in just three days, attracting significant investor interest.
Currently, Bitcoin is approaching and testing an important resistance zone around the $90,000 mark. Notably, Bitcoin’s dominance rate has decreased significantly since 12/30, indicating that capital is shifting towards the altcoin market.
In this context, the question arises whether the current upward momentum has enough strength to sustain, and whether Sui (SUI) is facing an opportunity to form a sustainable growth trend in the near future.
Why Sui could increase by another 70%
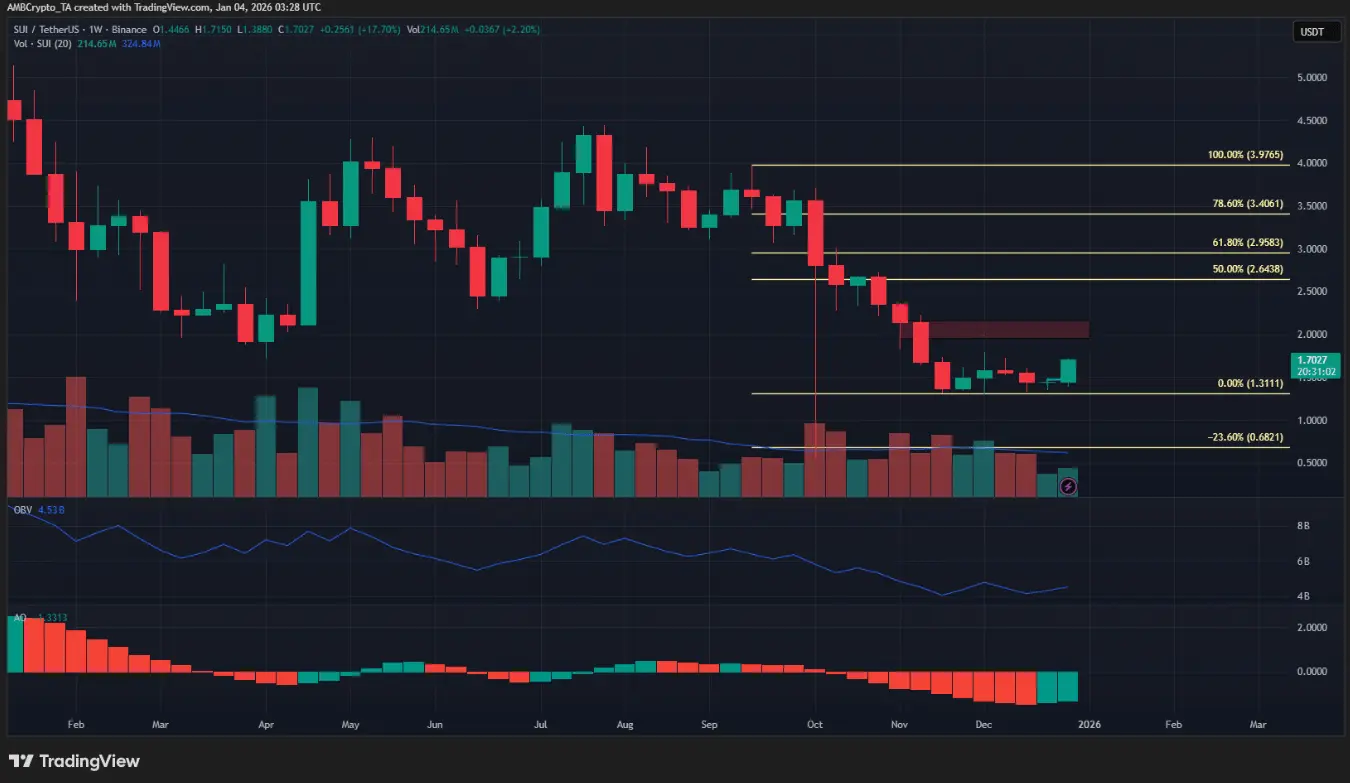 Weekly SUI/USDT chart | Source: TradingViewOn the weekly timeframe, the main trend of SUI remains bearish, although the recent recovery has attracted market attention. However, if the weekly candle can close firmly above the $1.79 level, this will send a positive signal that the bulls are temporarily regaining control and open up hope for a more noticeable recovery phase.
At that point, the price could be pushed towards higher target zones at $2.95 and $3.4 — important Fibonacci retracement levels acting as resistance above.
Nevertheless, momentum indicators and buying pressure on this timeframe still do not show a clear breakout, implying that the current rally may only be a technical rebound after previous weakness.
Potential reversal at the peak of the range
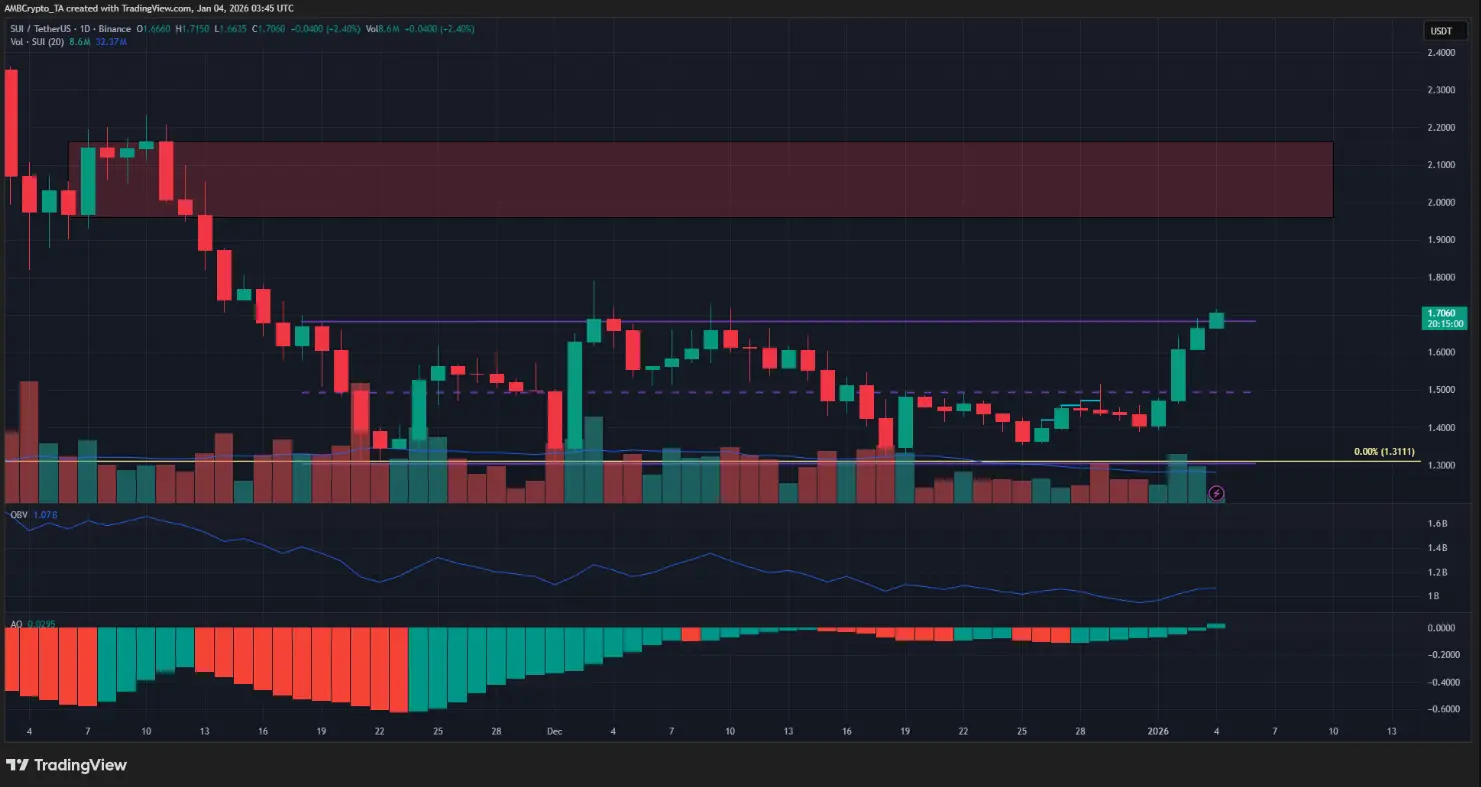 Daily SUI/USDT chart | Source: TradingViewThe oscillation pattern within the (purple zone) indicates an important peak at $1.68. At the time of writing, SUI is trading steadily above this level. If the price can record a clear daily candle closing above the upper boundary of the range, it will be a strong signal to reinforce confidence in the upward trend.
Conversely, failure to break out of the current range could serve as an early warning of increasing selling pressure and the risk of rejection. However, based on current developments, this negative scenario is considered unlikely.
Action for traders: Buy on breakout
The OBV indicator is gradually rising, while the Awesome Oscillator shows a bullish crossover — signs that demand and market momentum are improving significantly. At the same time, Bitcoin (BTC) has successfully broken through the local resistance zone around $90,000, further boosting momentum and reinforcing broad positive sentiment.
Based on the weekly chart signals, traders may consider a buy strategy upon confirmation of a breakout, aiming for higher targets, notably around the $3.40 zone.
Disclaimer: The information on this page may come from third parties and does not represent the views or opinions of Gate. The content displayed on this page is for reference only and does not constitute any financial, investment, or legal advice. Gate does not guarantee the accuracy or completeness of the information and shall not be liable for any losses arising from the use of this information. Virtual asset investments carry high risks and are subject to significant price volatility. You may lose all of your invested principal. Please fully understand the relevant risks and make prudent decisions based on your own financial situation and risk tolerance. For details, please refer to
Disclaimer.
Related Articles
Chainlink Price Tightens as $10 Resistance Holds Firm
Key Insights:
Chainlink trades between $8.5 and $10 as a tightening range signals volatility expansion, with buyers showing early strength through higher lows formation.
Open interest drops to $380 million while persistent spot outflows indicate cautious sentiment, though declining selling p
CryptoNewsLand38m ago
Solana Eyes $87 Breakout as Bullish Signals Strengthen
Solana sits near key resistance around $87 as on-chain activity and positive funding buoy bullish momentum; whale-led demand in derivatives supports a potential breakout. RSI >50 and positive MACD indicate rising upside, with a path toward $92–$97 and support near $77.
CryptoNewsLand42m ago
Dogecoin Holds Range as Volume Surge Signals Breakout Risk
Key Insights:
Dogecoin recorded over $800 million in daily transactions, reflecting one of its strongest activity spikes this year alongside rising accumulation from large holders.
Whale accumulation exceeded $330 million in one week, reinforcing demand strength while the price remains
CryptoNewsLand46m ago
Dogecoin Holds Range as Volume Surge Signals Breakout Risk
Key Insights:
Dogecoin recorded over $800 million in daily transactions, reflecting one of its strongest activity spikes this year alongside rising accumulation from large holders.
Whale accumulation exceeded $330 million in one week, reinforcing demand strength while the price remains
CryptoNewsLand47m ago
Shiba Inu Price Compression Signals Imminent Breakout Phase
Key Insights:
Shiba Inu trades near $0.0000060 as tightening volatility and reduced momentum signal an approaching breakout phase after months of sustained decline.
Open interest declines to $68 million, while persistent spot outflows highlight cautious sentiment and limited conviction
CryptoNewsLand2h ago
XRP Price Nears $1.50 Breakout as Triangle Tightens
Key Insights:
XRP consolidates within a symmetrical triangle, with tightening price action suggesting a potential breakout toward higher resistance levels as bullish momentum continues building.
Supertrend turning green and MACD rising indicate increasing buying pressure, supporting a bullis
CryptoNewsLand2h ago