 Hedera (HBAR) starts January 2026 in a quiet phase. The network ended December with some positive institutional signals, but price action has not followed through yet. The HBAR price is trading near $0.1078 after a steady decline that began back in October.
There is no panic in the chart, but there is also no clear strength. For now, HBAR is moving sideways, and the market is waiting for direction.
The Hedera price has been trending lower for several months, and December did little to change that picture. Instead of sharp sell-offs, price action slowed into a grind, which often signals that sellers are losing momentum.
At the same time, Canary Capital’s spot HBAR ETF continues to add exposure. The fund now holds roughly 1.1% of the circulating supply, showing steady but cautious institutional interest.
Hedera has also been mentioned as a potential 2026 altseason candidate due to its enterprise focus and network design. So far, fundamentals are holding up better than price.
Hedera (HBAR) starts January 2026 in a quiet phase. The network ended December with some positive institutional signals, but price action has not followed through yet. The HBAR price is trading near $0.1078 after a steady decline that began back in October.
There is no panic in the chart, but there is also no clear strength. For now, HBAR is moving sideways, and the market is waiting for direction.
The Hedera price has been trending lower for several months, and December did little to change that picture. Instead of sharp sell-offs, price action slowed into a grind, which often signals that sellers are losing momentum.
At the same time, Canary Capital’s spot HBAR ETF continues to add exposure. The fund now holds roughly 1.1% of the circulating supply, showing steady but cautious institutional interest.
Hedera has also been mentioned as a potential 2026 altseason candidate due to its enterprise focus and network design. So far, fundamentals are holding up better than price.
- What the Hedera Chart Is Showing
- What Market Indicators Are Saying
- HBAR Price Short-Term Outlook for January 2026
What the Hedera Chart Is Showing
Looking at the 4h chart, the trend is still pointing lower. Lower highs and lower lows have remained intact since the October breakdown, and every recovery attempt has been capped quickly.
The Hedera price is now hovering around the $0.105–$0.108 area. This zone has acted as short-term support through the second half of December. Each dip into this range has attracted buyers, but not enough to spark a strong bounce.
The sharp sell-off in October was followed by a slow and controlled decline, not another capitulation. That usually points to exhaustion rather than fear. Still, the structure has not shifted.
For the chart to improve, the HBAR price would need to reclaim the $0.120–$0.125 range and stay above it. Until that happens, the broader trend remains weak.
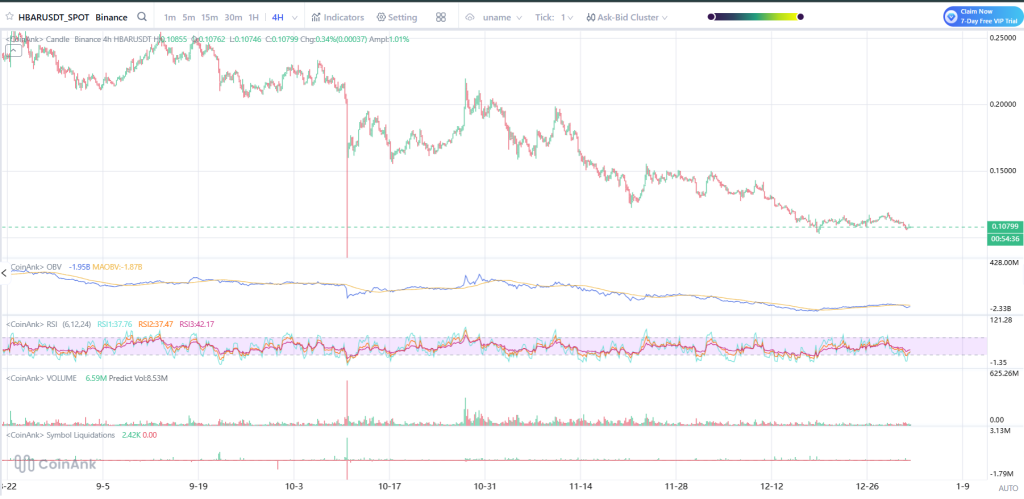
Source: Coinank
What Market Indicators Are Saying
The momentum indicators are still showing a level of indecision. The RSI indicator remains in the mid-high thirties. It is not extremely over-sold, but it certainly does not indicate a level of buying divergence.
OBV has been declining for months, making it certain that volume was supporting sellers. The latest development, however, is that OBV has leveled off, which indicates that selling is slowing, even though accumulation has not yet started.
Trading volume remains light, and liquidation activity is low. That usually means leverage has been washed out and the market is calmer, but also less committed. Overall, indicators point to stabilization, not a trend reversal.
_Read Also: _****The Biggest Mistake XRP Haters Keep Making About Ripple’s Business Model
HBAR Price Short-Term Outlook for January 2026
HBAR will most likely remain range-bound until January unless there is a change in market sentiment or a catalyst.
While, as long as the Hedera price stays above the $0.105 level, there is no threat of further downside. A clear break below that level will again bring the $0.095 to $0.100 level into focus.
On the bright side, a break above $0.115 would be the first sign that indeed buyers are getting in. A breach above $0.120 may pave the way for a general recovery; however, this will be facilitated by greater volumes.c
For now, the HBAR price looks like it is building a base. The network continues to develop in the background, but price still needs confirmation before January can turn convincingly bullish.
Disclaimer: The information on this page may come from third parties and does not represent the views or opinions of Gate. The content displayed on this page is for reference only and does not constitute any financial, investment, or legal advice. Gate does not guarantee the accuracy or completeness of the information and shall not be liable for any losses arising from the use of this information. Virtual asset investments carry high risks and are subject to significant price volatility. You may lose all of your invested principal. Please fully understand the relevant risks and make prudent decisions based on your own financial situation and risk tolerance. For details, please refer to
Disclaimer.
Related Articles
William Blair: After a certain CEX callback, risk is released, and prospects are boosted by USDC growth
Investment bank William Blair said that after a decline in its stock price in the first quarter, a certain CEX has already completed risk clearing, and the market has fully priced in expectations of weak trading volume and revenue. Although the trading data is soft, the impact is limited; the exchange has strengthened its competitiveness through a diversified layout. The stablecoin USDC continues to grow, raising its market share and generating synergistic benefits. Institutional investors are bullish on a market recovery and believe the exchange has upside potential.
GateNews12m ago
BTC 15-minute rise 0.48%: stronger spot buy-side demand combined with shrinking liquidity driving the move
2026-04-13 14:30 to 2026-04-13 14:45 (UTC), BTC saw a +0.48% return within a 0.55% amplitude range (71600.7–71997.0 USDT). During this period, market volatility increased; both spot and on-chain data indicate that short-term capital flows were notably active, market attention rose, and sentiment remains cautious.
The main driver behind this deviation is stronger spot-market buy pressure and the continued net outflow of exchange funds. Specifically, over the past 24 hours, BTC spot trading volume was about $33.15B, compared with the 7-day average
GateNews1h ago
Bitmine gets promoted to the NYSE main board! Tom Lee: US stocks may be at their bottom, and selling pressure on Ether could ease
Bitmine has officially transferred from the NYSE American board to the main board in the United States, marking an important milestone for the company. Despite a significant drop in its share price, it has still increased the share repurchase plan amount to $4.0 billion. The company holds a large amount of Ether, and it expects that a rebound in the crypto market will help improve its assets and share price performance.
CryptoCity1h ago
Gold and silver fall across the board, and the BTC/ETH volatility index rises slightly
On April 13, gold and silver prices fell to $4,732.92 per ounce and $74.209 per ounce, respectively. The BTC volatility index rose by 0.42%, and the ETH volatility index rose by 0.31%. The U.S. dollar versus the Chinese yuan and the Japanese yen edged up slightly, major European stock indexes generally fell, while WTI and Brent crude oil prices rose. The Gate platform supports trading for multiple asset types.
GateNews2h ago
ETH 15-minute rise of 1.24%: On-chain capital outflows and macro risk aversion converge to boost volatility
From 2026-04-13 13:45 to 14:00 (UTC), ETH surged rapidly within a 1.48% amplitude. The price ranged from 2182.61 to 2214.98 USDT, and the return rate in 15 minutes reached +1.24%. This bout of unusual activity has drawn market attention, with active capital inflows and outflows, a marked increase in volatility, and a short-term warming of trading sentiment.
The main driver behind this unusual activity is on-chain capital outflows and changes in the holdings structure. Over the past few weeks, the net positions of the 1k–10k ETH whale cohort and the 10k+ super whale cohort have continued to decline, around April 13, the related
GateNews2h ago
Bitcoin retreats to $71k, spot ETF net inflows of nearly $1 billion last week
Bitcoin and Ethereum prices were holding steady around April 13, and the overall crypto market weakened. Oil prices rebounded, influenced by the situation in the Middle East. Bitcoin ETF funds worth nearly $1 billion flowed in, but addresses still in unrealized losses remain in the majority, and open interest in futures contracts fell significantly.
GateNews2h ago
