Date: Wed, Dec 17, 2025 | 03:00 PM GMT
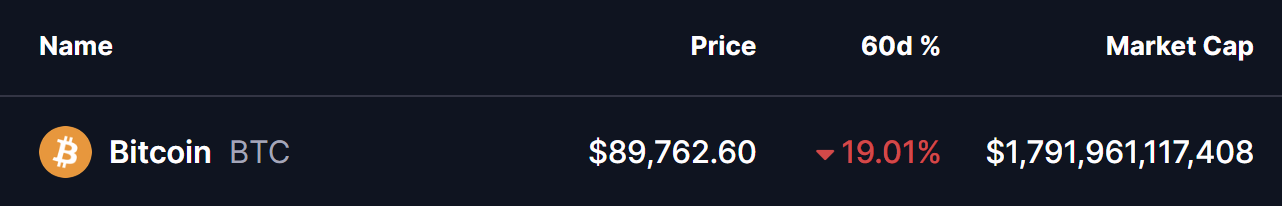
The broader cryptocurrency market has been experiencing choppy price action over the past several weeks, a phase that began after the sharp sell-off on October 10. That correction dragged Bitcoin (BTC) from sub-$120,000 levels down toward the current $88,000 zone. Over the last 60 days alone, BTC has declined by 19%, keeping overall market sentiment cautious and risk appetite subdued.
Despite the weakness, the higher-timeframe chart is beginning to reveal a familiar technical structure. Price behavior now suggests that downside momentum may be fading, raising the possibility that Bitcoin could be preparing for a trend reversal rather than a continuation of the recent decline.
Fractal Setup Hints at a Potential Bottom
According to crypto analyst JAVON, BTC’s current price structure is closely resembling a repeating fractal that has appeared multiple times throughout the ongoing macro uptrend. Historically, Bitcoin has followed a consistent rhythm: a sharp impulsive rally, followed by a corrective phase marked by consolidation and lower highs, before resuming its broader upward trajectory.
Looking at the chart, BTC has repeatedly formed local distribution patterns near highs, followed by controlled pullbacks into strong support zones. Each of these pullbacks eventually transitioned into consolidation ranges, where selling pressure gradually weakened before buyers stepped back in aggressively. These phases ultimately served as accumulation zones rather than trend reversals.
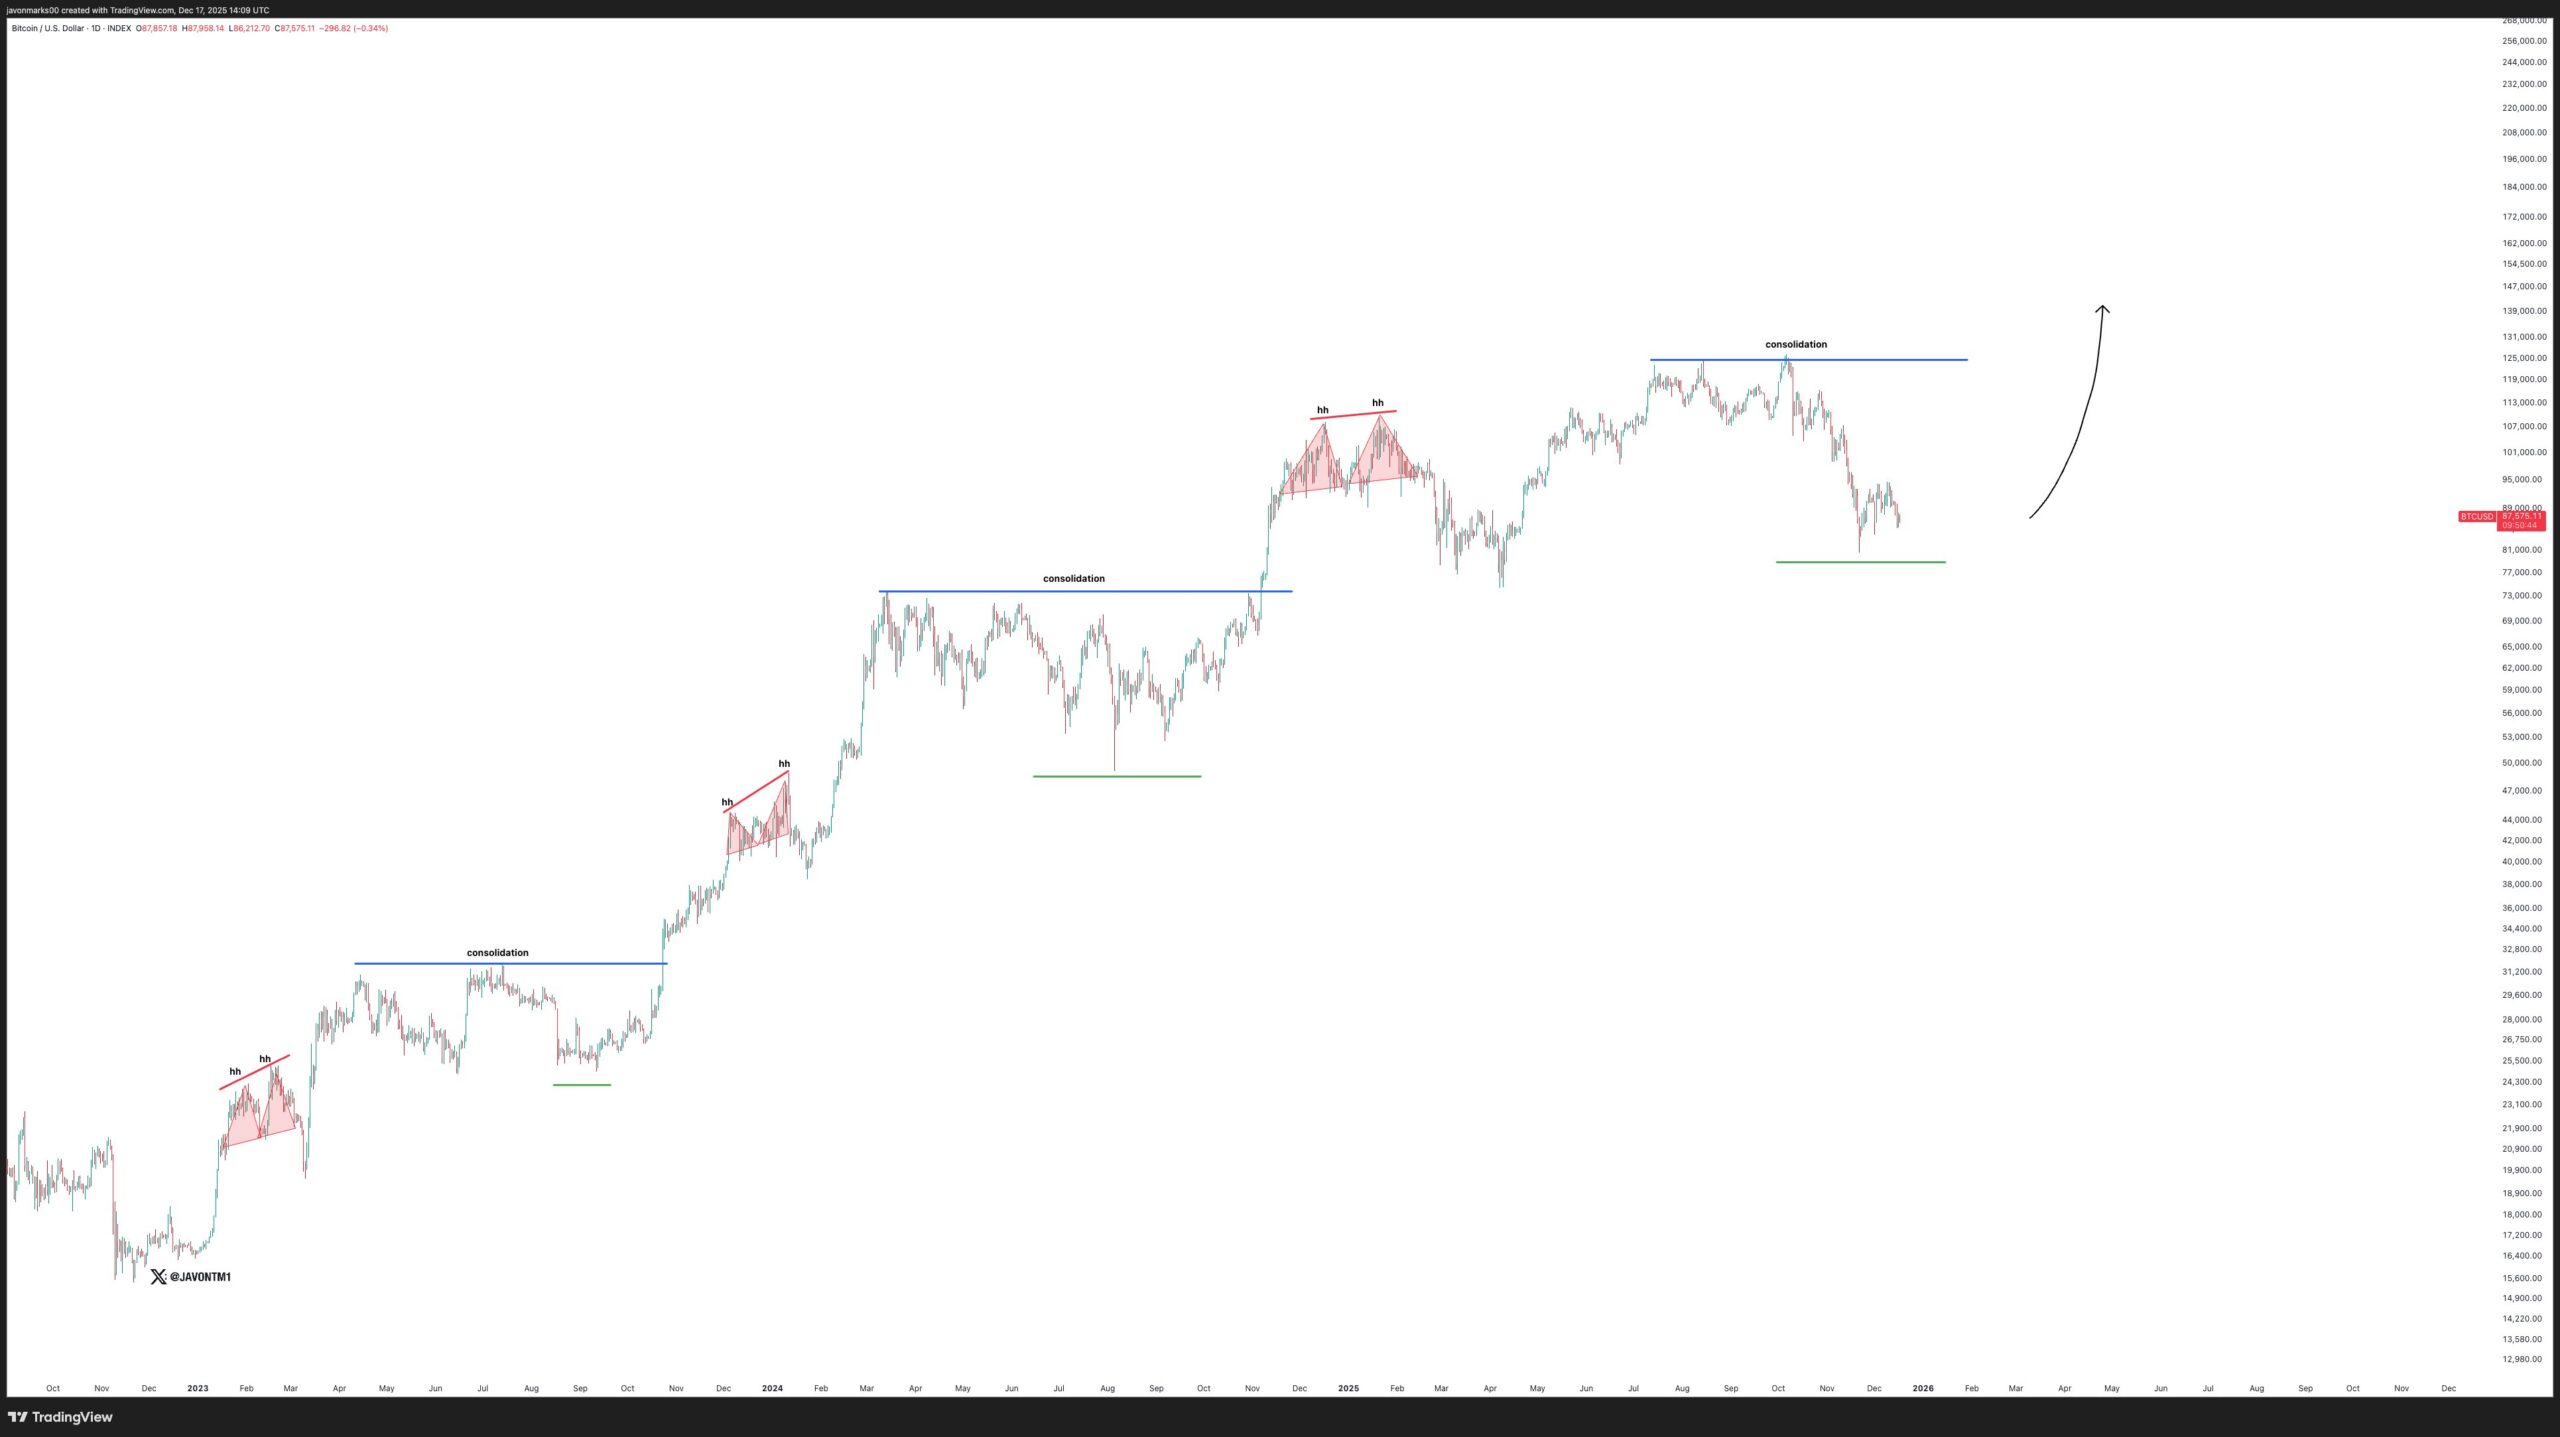
Bitcoin (BTC) Fractal Chart/Credits: @JavonTM1 (X)
At present, Bitcoin appears to be replaying the same script. After topping out near the $126,000 region, BTC entered a corrective decline that has now brought price back into a historically significant demand area around the $80,000–$88,000 range. This zone aligns closely with prior consolidation bases seen earlier in the cycle, where price previously paused before launching into its next leg higher.
Notably, the current pullback remains structurally healthy when viewed in the context of the broader trend. Higher-timeframe support is still intact, and the decline so far resembles past corrective phases rather than panic-driven breakdowns. This fractal similarity suggests that Bitcoin may be carving out a local bottom, rather than entering a prolonged bearish phase.
What’s Next for BTC?
If this fractal continues to play out as it has in previous cycles, Bitcoin could spend additional time consolidating above the current support zone before attempting a trend resumption. A period of sideways price action would allow market conditions to stabilize, flush out remaining weak hands, and rebuild bullish momentum.
A confirmed recovery above the recent consolidation resistance would strengthen the case for a renewed upside move, potentially opening the door for BTC to revisit and eventually exceed its prior highs. On the other hand, a sustained breakdown below the current support region would weaken the fractal thesis and signal that a deeper corrective phase may still be unfolding.
For now, Bitcoin’s structure remains constructive despite recent volatility. As long as BTC continues to hold above key higher-timeframe support levels, the probability of a cyclical bottom forming remains elevated. Traders and investors will be watching closely to see whether this familiar fractal once again leads to the next major expansion phase.
Disclaimer: The views and analysis presented in this article are for informational purposes only and reflect the author’s perspective, not financial advice. Technical patterns and indicators discussed are subject to market volatility and may or may not yield the anticipated results. Investors are advised to exercise caution, conduct independent research, and make decisions aligned with their individual risk tolerance.
Disclaimer: The information on this page may come from third parties and does not represent the views or opinions of Gate. The content displayed on this page is for reference only and does not constitute any financial, investment, or legal advice. Gate does not guarantee the accuracy or completeness of the information and shall not be liable for any losses arising from the use of this information. Virtual asset investments carry high risks and are subject to significant price volatility. You may lose all of your invested principal. Please fully understand the relevant risks and make prudent decisions based on your own financial situation and risk tolerance. For details, please refer to
Disclaimer.
Related Articles
"Seeking a Sword by Marking a Boat" style coin price predictions go viral: the practical logic and flaws of mystical prophecies
Author: Frank, PANews
Whenever the market enters a confusing phase of stagnation, someone attempts to predict the next trend using a "cutting the cord at the boat" style of historical retrospection method. In such circumstances, people often see from these theories and charts that history is repeating itself, and seem to automatically overlap and verify future market movements with a certain period in the past.
This coincidence appears to have a magical effect and is often verified. Some bloggers claim that the accuracy rate of this type of prediction can reach 75%~80%.
Does this "cutting the cord at the boat" style price prediction that repeatedly goes viral on social media actually help the market identify phases, or is it packaging noise as prophecy?
From "Tick Fractals" to "History Rhymes"
The peak operation regarding the prediction of a market top in October 2025 comes from an analyst named CryptoBullet, who created a method called "tick
PANews14m ago
Bitcoin Early Warning of Stock Market Risk? Global Stock Market Turbulence Intensifies After BTC Drops to $60,000
Recently, analysts have pointed out that Bitcoin's price movements often lead traditional risk assets, reflecting the weakness in global stock markets. After experiencing volatility, Bitcoin is currently stabilizing around $70,000, with market sentiment being affected by geopolitical tensions and rising oil prices. Historical data shows that Bitcoin often exhibits signs of peaking before stock market corrections, and investors are beginning to regard it as an important indicator for monitoring risk asset sentiment.
GateNews18m ago
Analyst: Bitcoin Has Transitioned from Distribution Phase to Accumulation Phase, Selling Pressure Drops to One-Sixth of Cycle Average
CryptoQuant analysts indicate that the market is currently in a neutral accumulation phase, with selling pressure dropping to historic lows, but may face long-term consolidation risks, requiring attention to the lack of price catalysts.
GateNews20m ago
Liquidity Alert Before FOMC Meeting: Private Credit Funds Restrict Redemptions, Bitcoin and Ethereum May Face Selling Pressure
As the Federal Reserve is about to hold an FOMC meeting, liquidity in the U.S. private credit market is tight, with several funds restricting investor redemptions, potentially triggering a chain reaction and causing capital to flow out to more liquid assets such as Bitcoin and Ethereum. Market risks are increasing, and it is important to monitor the Fed's policy moves and shifts in capital flows.
GateNews25m ago
Bitcoin Approaches $72,000: Supply Squeeze and Regulatory Tailwinds Create Bullish Momentum, BTC Catalysts Revealed
Bitcoin price has recently approached $72,000, driven by improved regulatory signals, reduced exchange bitcoin reserves, and institutional capital inflows. The U.S. SEC and CFTC will launch a cryptocurrency regulatory coordination program, which is expected to reduce regulatory uncertainty in the industry. Additionally, bitcoin reserves on centralized platforms have fallen to three-year lows, with significant market supply tightening phenomena, driving price increases. If it breaks through $72,000, it could further strengthen market momentum.
GateNews26m ago
Wall Street Eyes Bitcoin Mining Power Resources: AI Data Center Demand Surges, Mining Companies May Face Value Revaluation
As AI computing demand grows, Bitcoin miners' power infrastructure is attracting Wall Street attention. Mining companies possess advantages in land and power resources and are transforming into AI data centers, with the market not yet fully recognizing their potential. Some miners have begun scaling up their power capacity, with total computing power expected to reach 20 gigawatts by 2027. Additionally, mining operations' grid regulation capabilities are increasingly valued and are expected to play a key role in meeting AI data centers' energy demands in the future.
GateNews30m ago