Renowned technical analyst and founder of the BOLL indicator, John Bollinger, has identified a “potential W bottom” formation in the Ethereum and Solana charts, suggesting that a significant movement may be on the horizon. Ethereum price predictions show that ETH has dropped to $3,700 twice this month and is currently recovering, while SOL is also forming a similar double bottom around $175.
Who is John Bollinger? Why are his warnings so important
John Bollinger is a legendary figure in the field of Technical Analysis. The Bollinger Bands he invented in the 1980s have become one of the most widely used technical indicators by traders around the world. Bollinger Bands consist of three lines: the middle line is a simple moving average, while the upper and lower lines are dynamically adjusted based on price volatility, forming a “channel.” When the price touches the lower band, it often indicates overselling, while touching the upper band may indicate overbuying.
The genius of this indicator lies in its ability to simultaneously reflect trends and volatility. During periods of low volatility, the Bollinger Bands contract, forming a “squeeze” state, which often signals an impending significant price fluctuation. Conversely, during periods of high volatility, the Bollinger Bands expand. Bollinger's judgments of the market have been validated over decades, and his warnings carry great authority in the trading community.
When Bollinger publicly states “it's time to pay attention soon,” it's not a casual comment but a serious judgment based on his decades of market experience and expertise in Technical Analysis. In the field of Ethereum price predictions, garnering Bollinger's attention is itself an important signal. He typically does not frequently make public forecasts, only alerting the market when he identifies patterns that genuinely possess trading value.
W Bottom Pattern Analysis: A Bullish Reversal Tool in History
The W bottom, also known as the Double Bottom, is one of the most reliable bullish reversal patterns in Technical Analysis. The formation process of this pattern usually includes: the price first falls to a certain low point (the first bottom), then rebounds, but the rebound strength is insufficient, and then falls again to a level close to the first bottom (the second bottom), and then begins a real upward reversal.
The W bottom in the Bollinger Bands has special significance. When the price touches the lower band twice and forms a double bottom, it usually indicates that selling pressure has been fully released, and the market is building a bottom. More importantly, if the second bottom is slightly higher than the first bottom, forming what is known as a “higher low”, the reliability of this pattern is further enhanced.
Bollinger observed this pattern on the Ethereum and Solana charts. Ethereum has fallen to $3,700 twice this month and currently seems to be recovering, while Solana has also shown a similar trend, dropping to $175 twice in October before slightly recovering. The appearance of this synchronous pattern enhances the reliability of the signal, as when multiple assets display the same technical pattern simultaneously, it often indicates a broader market trend shift.
Three Confirmation Stages of the W Bottom Formation:
Phase One: The price falls to the first low point (Ethereum 3,700 USD), touching the lower Bollinger Band.
Phase Two: After a short-term rebound, it falls again, forming a second low point (close to or slightly above the first low point).
Phase Three: Break through the high point (neckline) between the two bottoms, confirm the reversal, with a target price equal to the neckline plus the vertical distance from the bottom to the neckline.
Ethereum Current Trend Analysis: $3,700 is the Key Support
The core of the Ethereum price prediction lies at the key support level of 3,700 USD. ETH has touched this level twice this month and rebounded, and this repeated testing of the support level without breaking it is considered a confirmation of support strength in Technical Analysis. When it first touched 3,700 USD, there may still have been skepticism in the market, but after the second touch and subsequent rebound, it shows that there is substantial buying support at this price level.
The current trading price of Ethereum is approximately $3,973, rebounding about 7% from the second bottom. Although this rebound is not large, the key lies in the change of direction. If Ethereum can maintain a close above $4,000, it will confirm the validity of the W bottom formation. The next important resistance level is in the $4,200-$4,300 range, which is the upper edge of the previous consolidation area and also the position of the 50-day moving average.
The trend of Solana is highly synchronized with Ethereum, and this correlation has significant implications in Ethereum price predictions. SOL has formed a double bottom around 175 USD and is currently trading at 189.31 USD, with a rebound of about 8%. Both mainstream smart contract platforms have simultaneously formed W bottoms, suggesting a shift in market sentiment towards such assets.
However, Bollinger also pointed out that this pattern has not yet formed on the Bitcoin chart. Bitcoin experienced a significant “V” shaped fall, dropping below $104,000 on Friday, and then rebounding over the weekend. This difference is noteworthy because Bitcoin, as the market leader, often leads the trends of altcoins. If Bitcoin also forms a W bottom, it will greatly enhance the reliability of Ethereum price predictions.
Successful Prediction for July 2024: BTC Rises 82% in Six Months
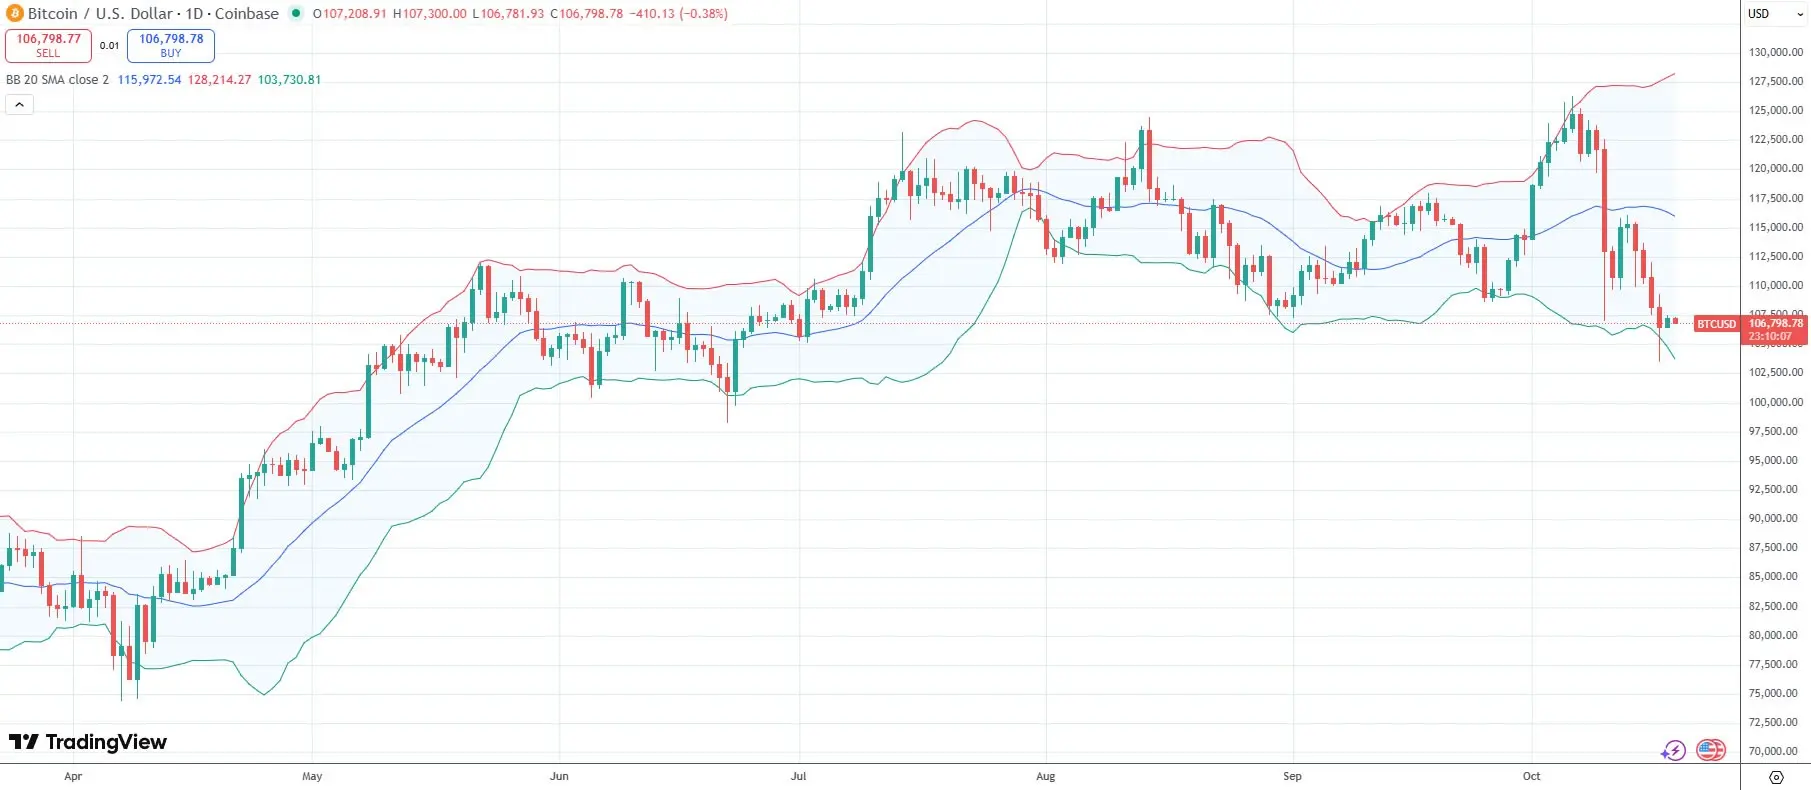
(Source: Trading View)
Analyst “Satoshi Flipper” observed that the last suggestion to pay attention to the Bollinger Bands was in July 2024. “It is indeed time to pay attention. This is a real squeeze, with the controlling feature being the reversal of the two bars on the lower band,” Bollinger said at the time. In the following six months, Bitcoin surged from below $55,000 to above $100,000, an increase of over 82%.
This historical case provides an important reference for the current Ethereum price prediction. In July 2024, Bitcoin was undergoing a deep adjustment, and market sentiment was extremely pessimistic. Many analysts believed the bull market was over, but BOLL identified the “squeeze” state of the Bollinger Bands, indicating that significant volatility was on the horizon. In hindsight, the direction of this volatility was upward, and the magnitude was astonishing.
The current market environment has many similarities with July 2024. Ethereum and Solana have both experienced weeks of consolidation and decline, with market sentiment being cautious. After months of tightening, Bitcoin's BOLL has expanded this month due to a record surge in leverage last weekend, leading to increased volatility. Analysts had predicted this “volatility storm” during the market slump in September.
If history repeats itself, Ethereum may rebound from the current bottom of $3,700 and challenge the $5,000-$6,000 range in the coming months. This would represent a 25%-50% increase, which, although less than Bitcoin's 82% last year, is still a considerable return for the second-largest cryptocurrency by market capitalization.
50 Week SMA Support Confirms Bull Market Continues
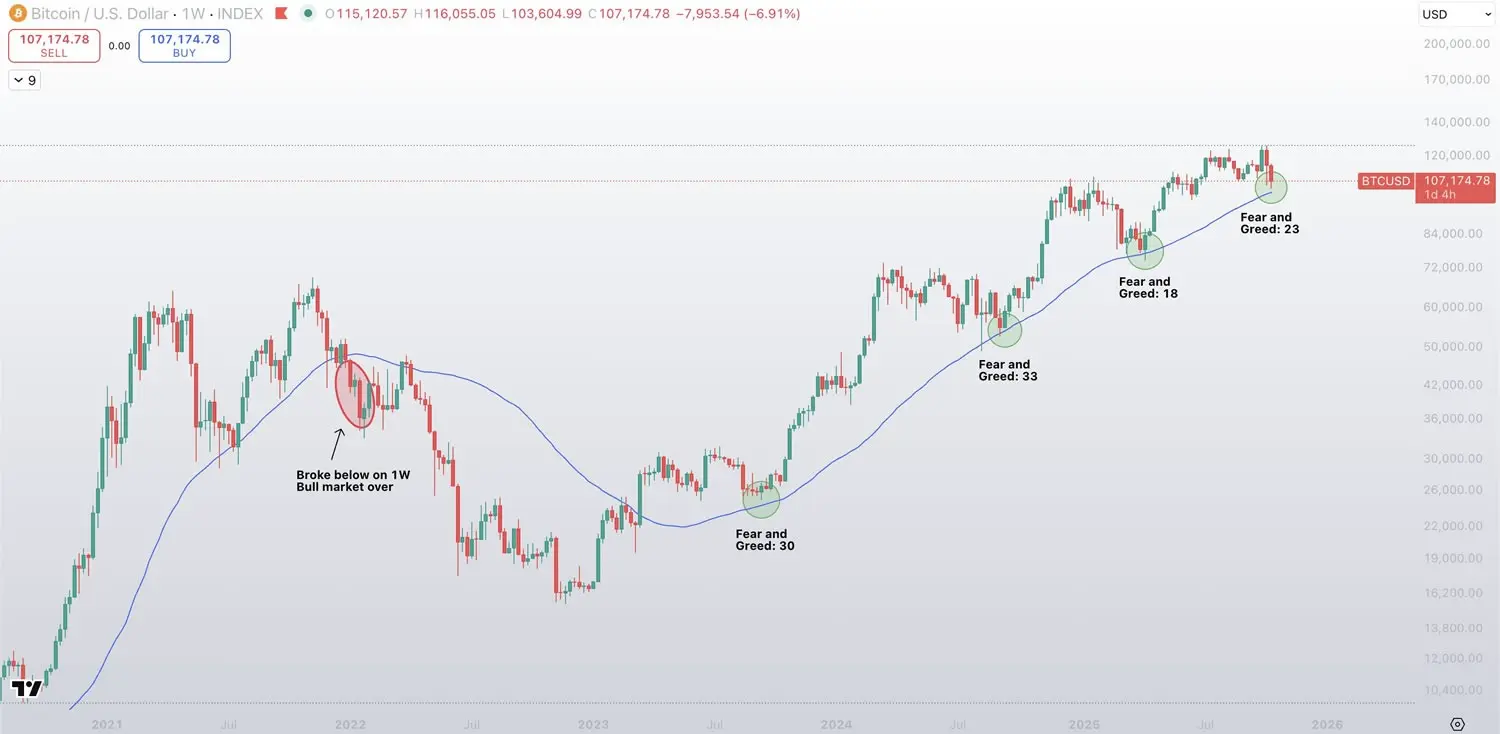
(Source: Trading View)
Despite the recent volatility, analysts still believe that the market has not entered a bear market. Analyst “Sykodelic” stated that the market is still in an upward trend, using the 50-week simple moving average as a technical indicator, which has been marked four times since November. “Every time the price falls near the 50-week moving average, there is a massive panic in the market, and most people panic sell, saying it is all over. But each time, the price rebounds strongly and rises significantly.”
The 50-week SMA is a key indicator for determining long-term trends. In a bull market, prices typically stay above the 50-week SMA, and even if there is a short-term pullback to this moving average, it often rebounds quickly. Conversely, in a bear market, prices tend to remain below the 50-week SMA for an extended period. Currently, both Bitcoin and Ethereum are still above their respective 50-week SMAs, which is an important technical confirmation for the continuation of the bull market.
Since the sharp fall on Friday, BTC has failed to break through the support level turned resistance at 108,000 USD. This price level has now become a key threshold in the short term; if it can regain this level, it will open the path to 115,000 USD. For Ethereum price predictions, whether Bitcoin can break through 108,000 USD will be an important leading indicator.
