Trade
Basic
Futures
Futures
Hundreds of contracts settled in USDT or BTC
Options
HOT
Trade European-style vanilla options
Unified Account
Maximize your capital efficiency
Demo Trading
Futures Kickoff
Get prepared for your futures trading
Futures Events
Participate in events to win generous rewards
Demo Trading
Use virtual funds to experience risk-free trading
Earn
Launch
CandyDrop
Collect candies to earn airdrops
Launchpool
Quick staking, earn potential new tokens
HODLer Airdrop
Hold GT and get massive airdrops for free
Launchpad
Be early to the next big token project
Alpha Points
NEW
Trade on-chain assets and enjoy airdrop rewards!
Futures Points
NEW
Earn futures points and claim airdrop rewards
Investment
Simple Earn
Earn interests with idle tokens
Auto-Invest
Auto-invest on a regular basis
Dual Investment
Buy low and sell high to take profits from price fluctuations
Soft Staking
Earn rewards with flexible staking
Crypto Loan
0 Fees
Pledge one crypto to borrow another
Lending Center
One-stop lending hub
VIP Wealth Hub
Customized wealth management empowers your assets growth
Private Wealth Management
Customized asset management to grow your digital assets
Quant Fund
Top asset management team helps you profit without hassle
Staking
Stake cryptos to earn in PoS products
Smart Leverage
NEW
No forced liquidation before maturity, worry-free leveraged gains
GUSD Minting
Use USDT/USDC to mint GUSD for treasury-level yields
More
GateUser-1cf4ba35
No content yet
GateUser-1cf4ba35
#SOL
🔥 The recent movement of SOL has already started to show the sharp teeth of a bullish trend 👇
20-day moving average is turning upward
RSI has re-entered the positive zone
In a nutshell: Buyers are beginning to take control 🟢
🚀 How to view the upward path?
Under the current structure, this rebound is most likely to first push towards $147.
This is a hard resistance level, and bears are unlikely to give way easily, so there will likely be significant selling pressure.
🧱 The key is not whether it will pull back, but where it will pull back to.
If the price falls back from $147, as long
SOL1,85%
- Reward
- like
- Comment
- Repost
- Share
#ETH
🔥 The recent movement of 🔥 ETH signals are very clear 👇
The moving averages have already completed a golden cross, RSI has strongly broken through 60, and the bulls are gaining control 💪
🚀 How will the bullish scenario unfold?
As long as the closing price stays above the resistance line, ETH's upward potential will be fully unlocked:
First target: $3658
In strong momentum, directly aiming for: $4000
⚔️ Key zone to watch: $3659 to $3900
This area can be considered the "last line of defense" for the bears, and selling pressure will be very heavy. Price is likely to experience intense
ETH2,03%
- Reward
- like
- Comment
- Repost
- Share
#BTC
🔥 BTC closed firmly above the 50-day moving average of $89,266 on January 2nd and continued to rise, with the next target being the key resistance level at $94,456. This trend sends a clear signal — the bulls are gaining momentum.
📈 Key signals have appeared
Moving average crossover (Golden Cross)
RSI in positive territory
Together, these points indicate one thing:
👉 The current market control is in the hands of the bulls
🚀 How will the bullish scenario unfold?
If buying pressure continues and successfully breaks through $94,456,
BTC is likely to accelerate directly:
First target: $1
BTC0,85%
- Reward
- like
- Comment
- Repost
- Share
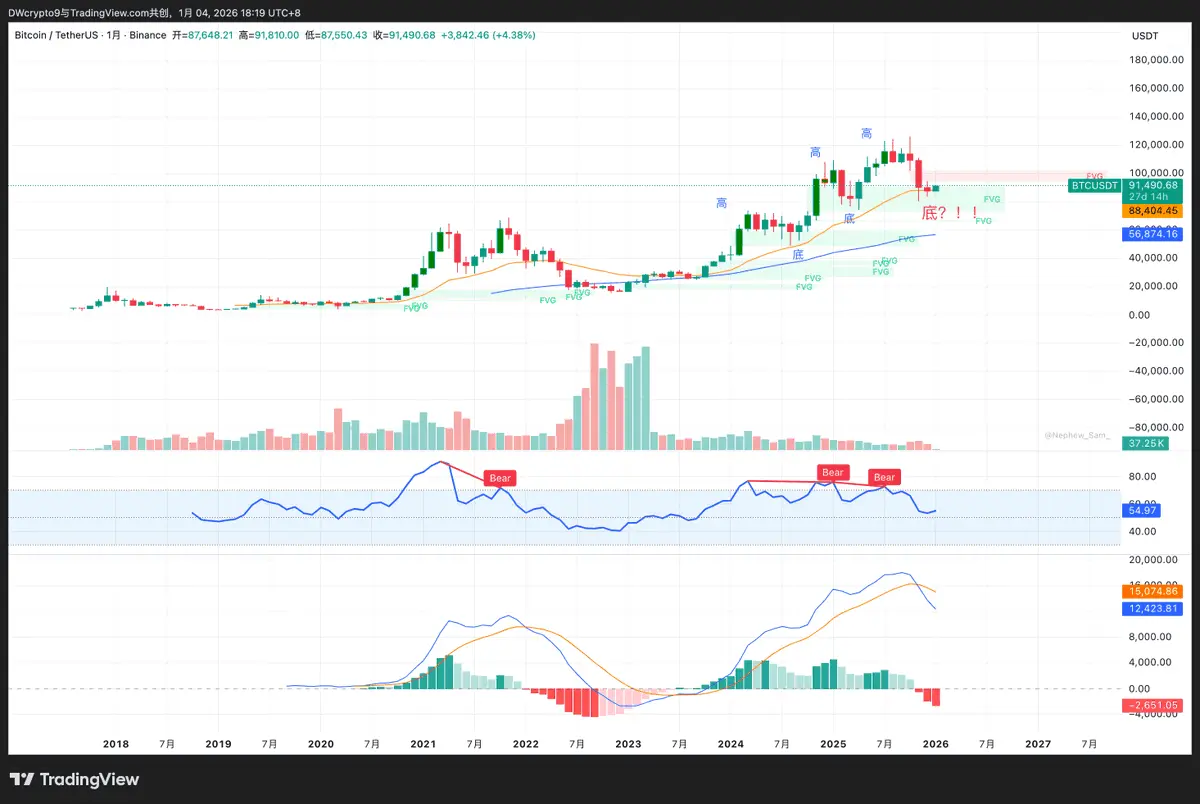
🔥 BTC, long-term stable, short-term panic, here comes the key 👇
From the monthly chart, BTC has been making higher highs + higher lows,
which indicates one thing—
👉 The long-term upward trend is not broken
In the last two corrections, BTC has always
📍稳稳 supported around the 20-month moving average of $88,400
This has become a lifeline support level for the bulls
⚠️ But note:
If the price closes below the 20-month moving average,
and also falls below the April low of $74,500,
then it means 👇
The “higher lows” structure is broken
Buyers are clearly retreating
The bulls are waiting for lower
BTC0,85%
- Reward
- like
- Comment
- Repost
- Share
#BNB
🔥 BNB Price Forecast
🟢 Bullish Scenario Plays Out Like This 👇
As long as the closing price stays above the 50-day moving average,
the market has the chance to continue pushing upward 🚀
The first major hurdle above is—
👉 $928 strong resistance level
Why is this critical ❓
Because:
Once the closing price stabilizes above $928,
it will directly form a bullish ascending triangle pattern 📈
At that point, the bullish space opens up immediately,
🎯 with the target directly at $1080
🔴 Where is the counterattack point for the bears?
Still at $928 ⚔️
If the price:
is sharply knocked down ne
BNB0,75%
- Reward
- like
- Comment
- Repost
- Share
#XRP
🔥 XRP👇
🟢 What are the bulls doing?
The goal is clear:
👉 Push the price above the 20-day moving average of $1.9
As long as it stays steady here, the recovery rally is considered to have successfully ignited🔥
What’s next?
First, break through the 50-day moving average of $2.02
Then challenge the downtrend line ⚔️
This is the last line of defense for the bears,
⚠️ Once the daily close is above the trend line,
It likely means—
👉 The trend reversal is officially confirmed
Subsequently, the price may directly rally to $2.7
🔴 Where are the bears’ cards?
Keep a close eye on a key level:
�
XRP9,37%
- Reward
- like
- Comment
- Repost
- Share
#DOGE
🔥 DOGE is now on the edge of a cliff 👇
🔴 What are the bears doing?
It's simple, just one goal:
👉 Drive DOGE below $0.12
Once achieved, the downtrend may restart,
Directly targeting the October 10 low of $0.8385
If this step is missed, the sentiment will turn cold instantly ⚠️
🟢 Bulls need to save themselves, only quick, decisive, and accurate actions will do
Bulls cannot hesitate now,
👉 Must push the price back above the moving average as soon as possible
Otherwise, they will be pressed down by the bears.
If the rebound is successful:
First target $0.2
This means the market has cl
DOGE-0,13%
- Reward
- like
- 2
- Repost
- Share
DrinkingAloneUnderTheMoon666 :
:
New Year Wealth Explosion 🤑View More
#ADA
🔥 ADA Price Forecast👇
🔴 The bears' plan is very clear
The bears now have one goal:
👉 Drive the price below $0.34
Once successful, the market may accelerate downward:
First target $0.33
If it can't hold, the October 10 low of $0.27 will likely be tested again⚠
In one sentence: $0.34 is one of the last lines of defense for the bulls
🟢 The bulls need to show strength to turn the tide
What is the first real sign of strength?
👉 Price breaks through and closes above the 20-day moving average
As long as it holds, the bulls will officially be back at the table♟
Subsequently, ADA is expecte
ADA3,62%
- Reward
- like
- Comment
- Repost
- Share
#LINK
🔥 LINK is showing signs of a turnaround!
🟢 The bulls are quietly gaining strength
RSI divergence indicates a key point—
👉 Selling pressure is weakening, and the bears are starting to falter😮💨
This also significantly increases the probability of LINK hitting the 50-day moving average.
Once broken through, the market is very likely to rebound to $15 🎯
If the closing price stays firmly above $15, then it’s very clear:
➡️ The downtrend is likely over, and the bulls are officially returning🔥
🔴 The bear’s counterattack script
Of course, the bears won’t surrender easily😈
If LINK is h
View Original🔥 LINK is showing signs of a turnaround!
🟢 The bulls are quietly gaining strength
RSI divergence indicates a key point—
👉 Selling pressure is weakening, and the bears are starting to falter😮💨
This also significantly increases the probability of LINK hitting the 50-day moving average.
Once broken through, the market is very likely to rebound to $15 🎯
If the closing price stays firmly above $15, then it’s very clear:
➡️ The downtrend is likely over, and the bulls are officially returning🔥
🔴 The bear’s counterattack script
Of course, the bears won’t surrender easily😈
If LINK is h
- Reward
- like
- Comment
- Repost
- Share
#SOL
🔥 SOL is it holding above the 20-day moving average⚔
🟢 Bullish scenario (breaking upward)
If SOL's closing price successfully stays above the 20-day moving average, it indicates that the bulls are gaining strength💪
The market is likely to test higher:
First target: $147
There might be some minor resistance around the 50-day moving average at $131.6
But honestly, this level is very likely to be broken through directly by the bulls🔥
Once it stabilizes, market sentiment will significantly improve.
🔴 Bearish scenario (continued decline)
But if SOL falls below and stays below the moving a
SOL1,85%

- Reward
- like
- Comment
- Repost
- Share
#ETH
🔥 The tip of the triangle, the direction is about to be chosen!
ETH has now reached a critical point in its technical pattern. The next move is not to slowly proceed but to directly choose a direction📉📈
🔺 Bullish scenario (rebound route)
If ETH's closing price stays firmly above the 50-day moving average, it’s like giving the green light for a rebound🚦
Next, the price is likely to retest the upper resistance line of the symmetrical triangle.
Here comes the key👇
Strong breakout of the triangle resistance line
Directly signals: the downtrend may be ending
Clear target: first look at
ETH2,03%
- Reward
- like
- 1
- Repost
- Share
Goalkeeper :
:
New Year Wealth Explosion 🤑#BNB
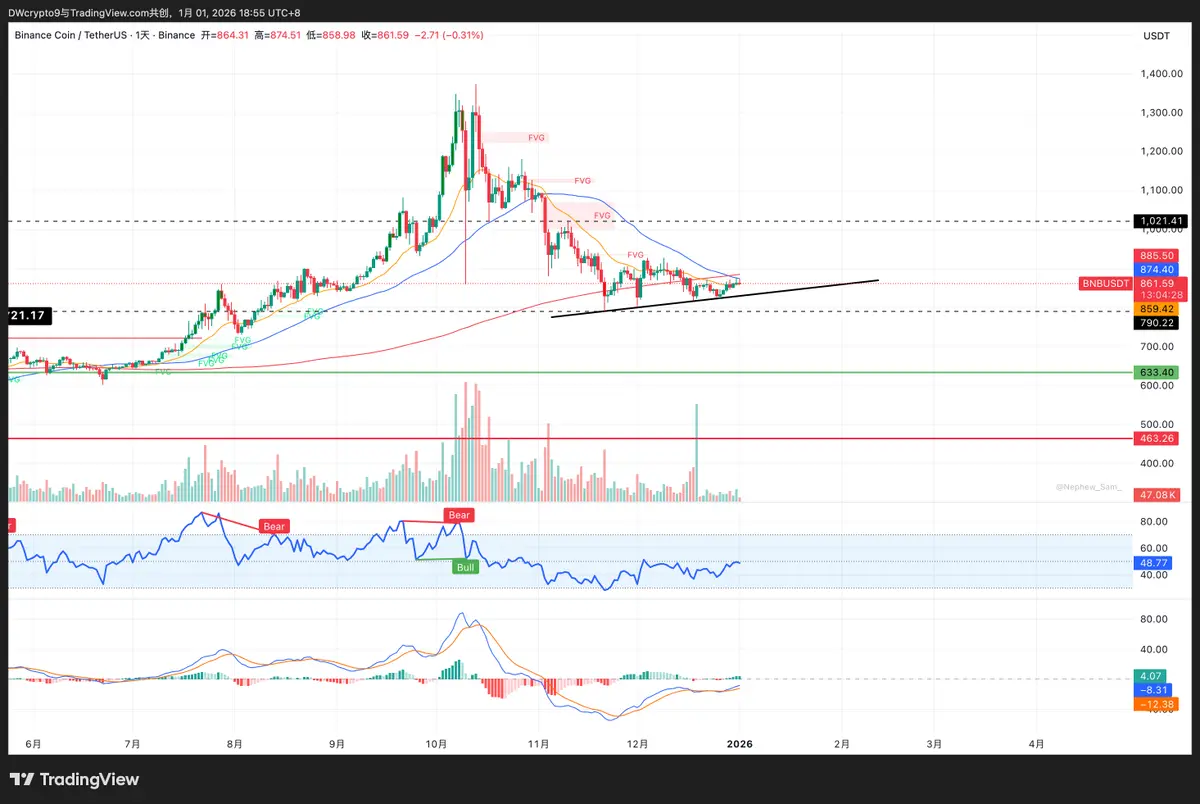
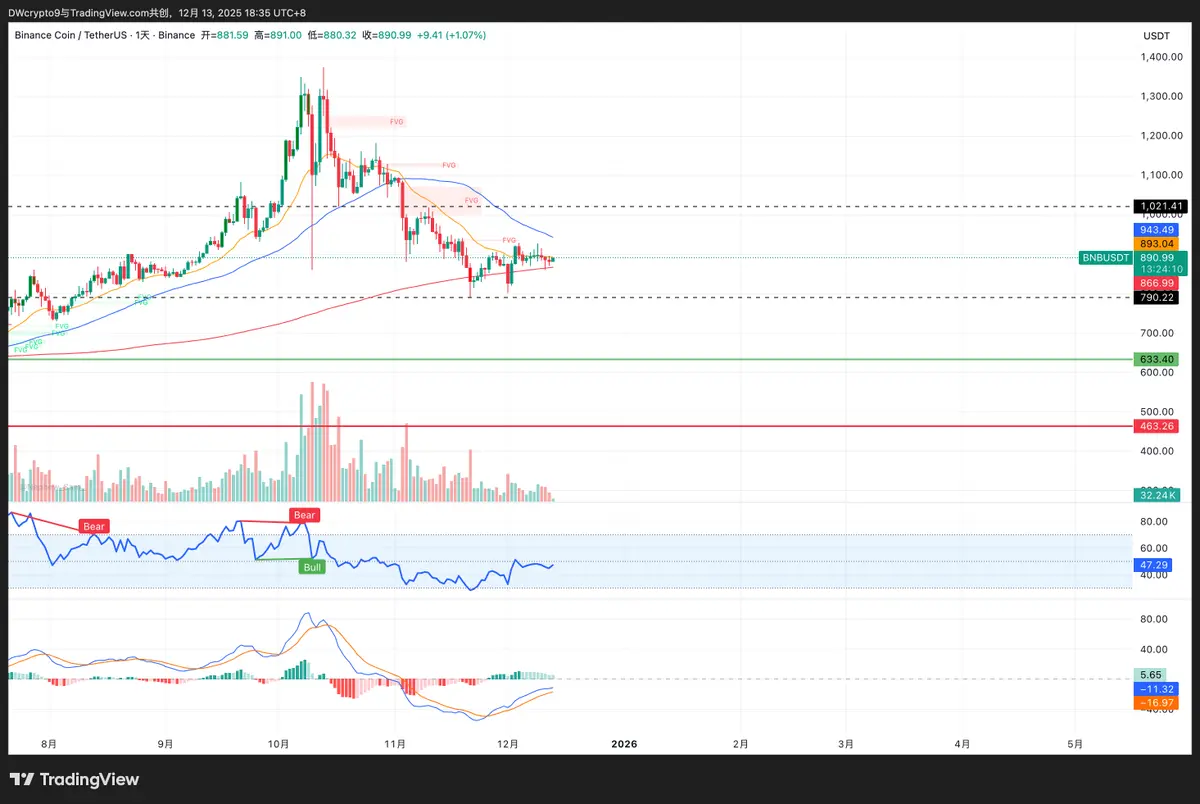
📊 BNB is not in a rush to move, but is holding back for a big move👀
The 20-day moving average is flat, and RSI is slightly below the midline, indicating that the bullish and bearish forces are temporarily balanced. The price is more likely to fluctuate between $790 and $1021.
🔻 Bearish scenario
If the sellers gain strength and break below this key support level of $790,
then the downward momentum may accelerate significantly, and BNB faces a risk of rapidly dropping to $730⚠
🔺 Bullish scenario
Conversely, as long as the closing price stays above $1021,
it indicates that this correcti
BNB0,75%
- Reward
- like
- Comment
- Repost
- Share
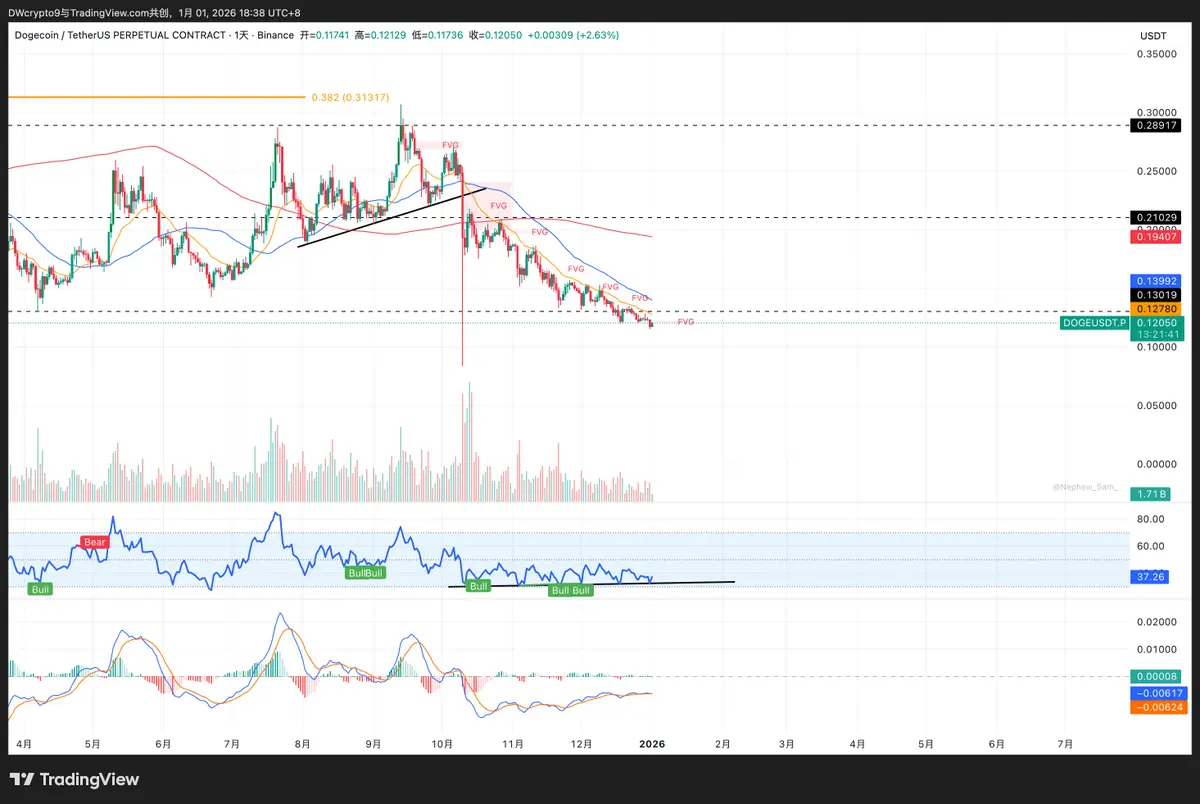
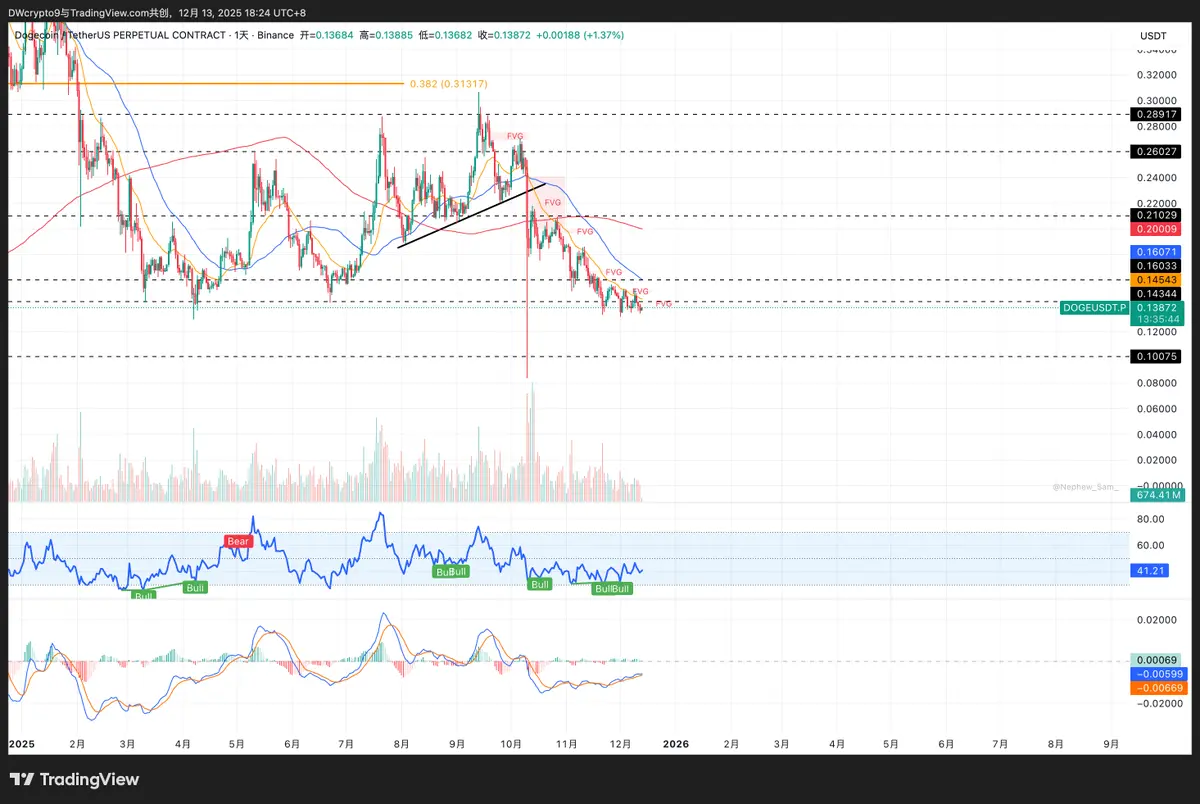
#DOGE
🐶Currently, DOGE is at a critical juncture between life and death, and the trend is very crucial⚠️
📉 Bearish scenario: once broken, be cautious
If the price continues to decline and closes below $0.13, it will essentially confirm the start of a new downward trend.
In this case, DOGE may quickly drop to the October 10 low of $0.08385📉
It should be noted that this level is likely to attract bottom-fishing buy orders, and a short-term rebound may occur.
📈 The first signal of a bullish counterattack
There is only one true strong signal👇
👉 Price breaks through and stabilizes above the
DOGE-0,13%
- Reward
- 1
- Comment
- Repost
- Share
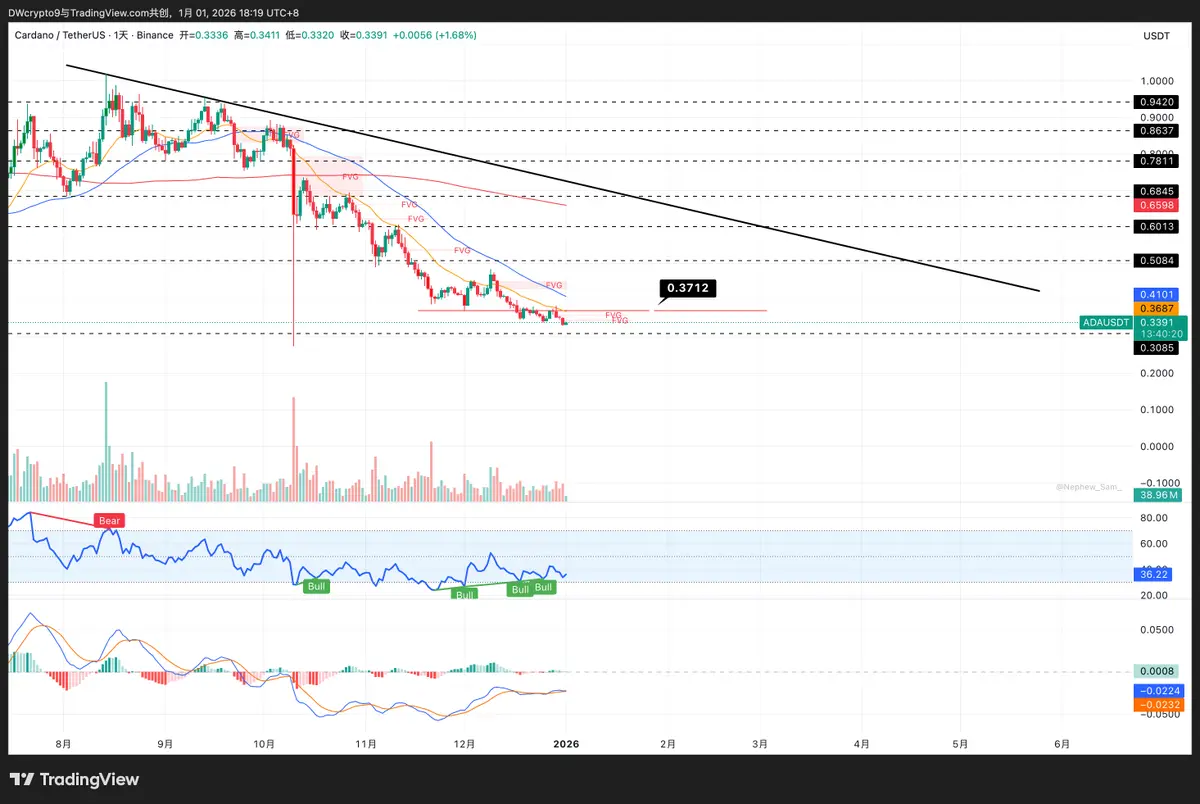
#ADA
🔥Looking at the current trend, the 20-day moving average at $0.4366 continues to press down, and the RSI is declining, indicating that the bears temporarily hold the dominant position😈. Market sentiment is cautious, and funds are clearly watching and waiting.
📉 Downside risks need close attention
$0.40 and $0.37 are the most critical defense lines right now
If it drops below $0.37, selling pressure may rapidly increase
ADA could plunge straight to $0.31, and in extreme cases, test the stage lows of $0.27⚠️
📈 The only signal for a bullish rebound
To truly reverse the situation, bulls
ADA3,62%

- Reward
- like
- Comment
- Repost
- Share
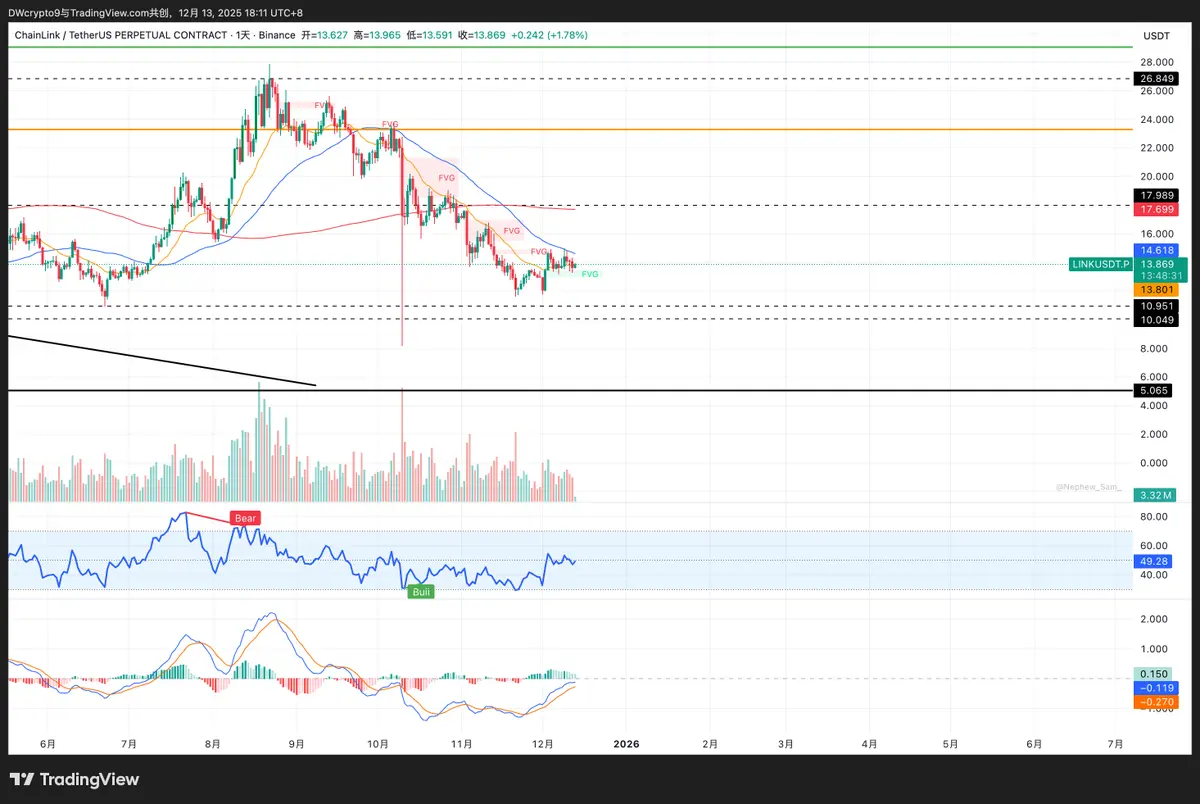
#LINK
🔥LINK has been trading within a narrow range recently, but this calm often signals that a storm is approaching🌪️— once the range is broken, the market is likely to rapidly expand.
📈 Bullish Scenario: Breakout to the upside
If the price breaks above and closes above the 50-day moving average of $14.61, it indicates that the bulls are officially taking control of the market💪
Once momentum kicks in, LINK could potentially surge to $19, offering considerable room for growth🔥
📉 Bearish Scenario: Accelerate downward
Conversely, if the price sharply breaks below the 20-day moving average
View Original🔥LINK has been trading within a narrow range recently, but this calm often signals that a storm is approaching🌪️— once the range is broken, the market is likely to rapidly expand.
📈 Bullish Scenario: Breakout to the upside
If the price breaks above and closes above the 50-day moving average of $14.61, it indicates that the bulls are officially taking control of the market💪
Once momentum kicks in, LINK could potentially surge to $19, offering considerable room for growth🔥
📉 Bearish Scenario: Accelerate downward
Conversely, if the price sharply breaks below the 20-day moving average
- Reward
- like
- Comment
- Repost
- Share
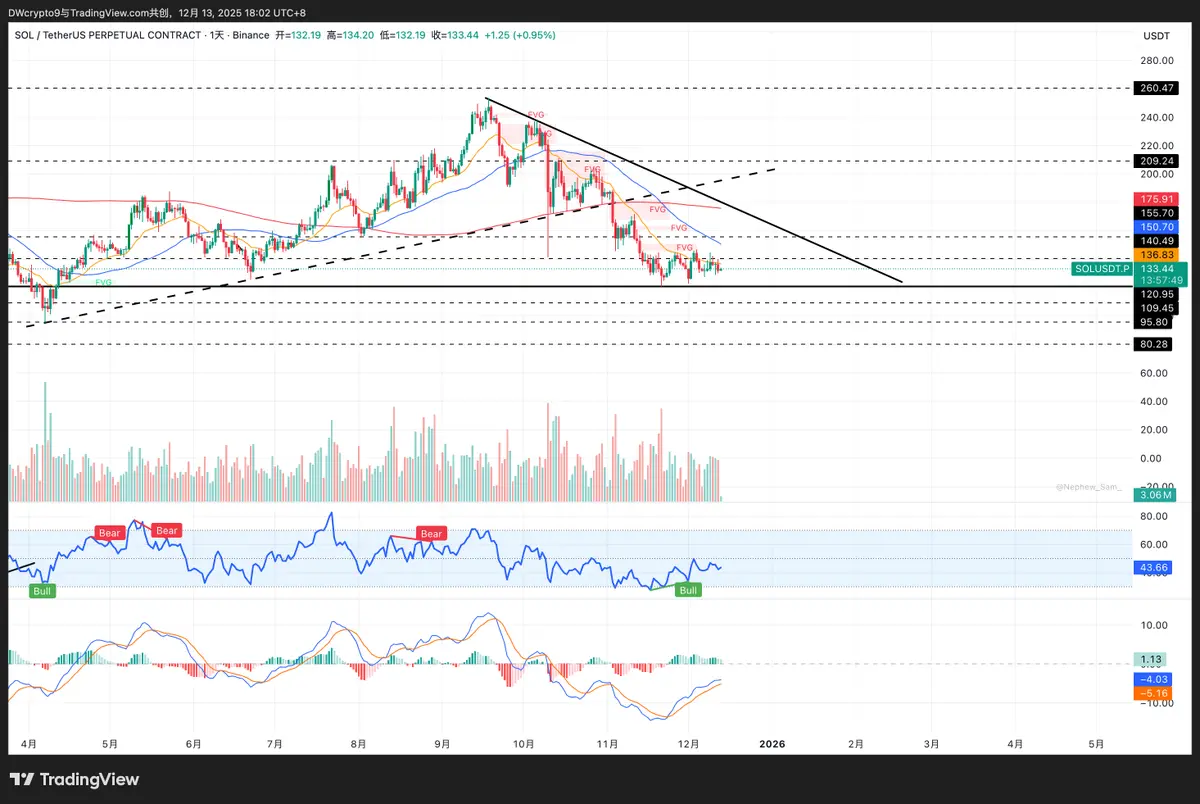
#SOL
🔥SOL is currently at the battle point between bulls and bears. What's next depends entirely on this segment's performance👇
📈 Bullish Reversal Route
To turn the situation around, bulls must push the price strongly above the 50-day moving average of $150.7.
Once stabilized, a short-term reversal signal is confirmed✅
SOL is expected to rebound to $171.8 and potentially push further to $189.1🔥
📉 Bearish Continuation Route
But if the price drops below and closes under $126, it’s not just a simple correction⚠️
This indicates that the downtrend is still ongoing,
SOL may quickly drop to $10
SOL1,85%
- Reward
- like
- Comment
- Repost
- Share
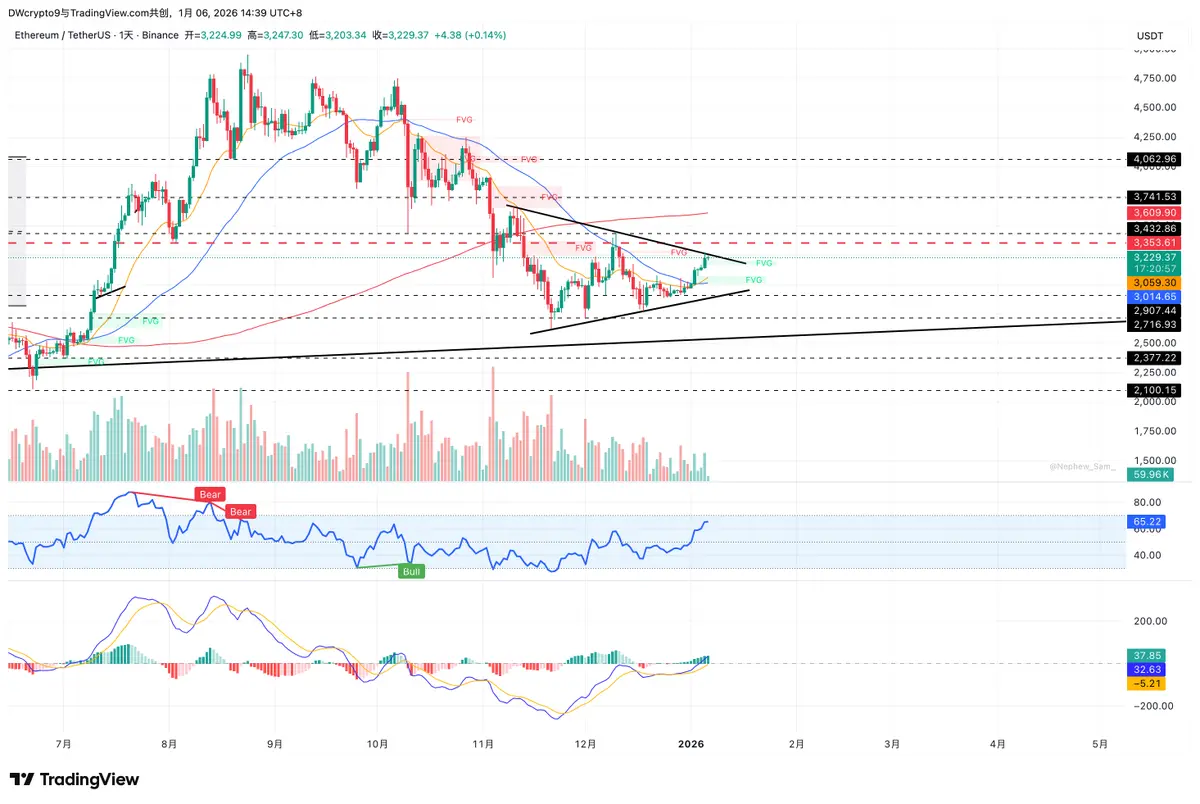
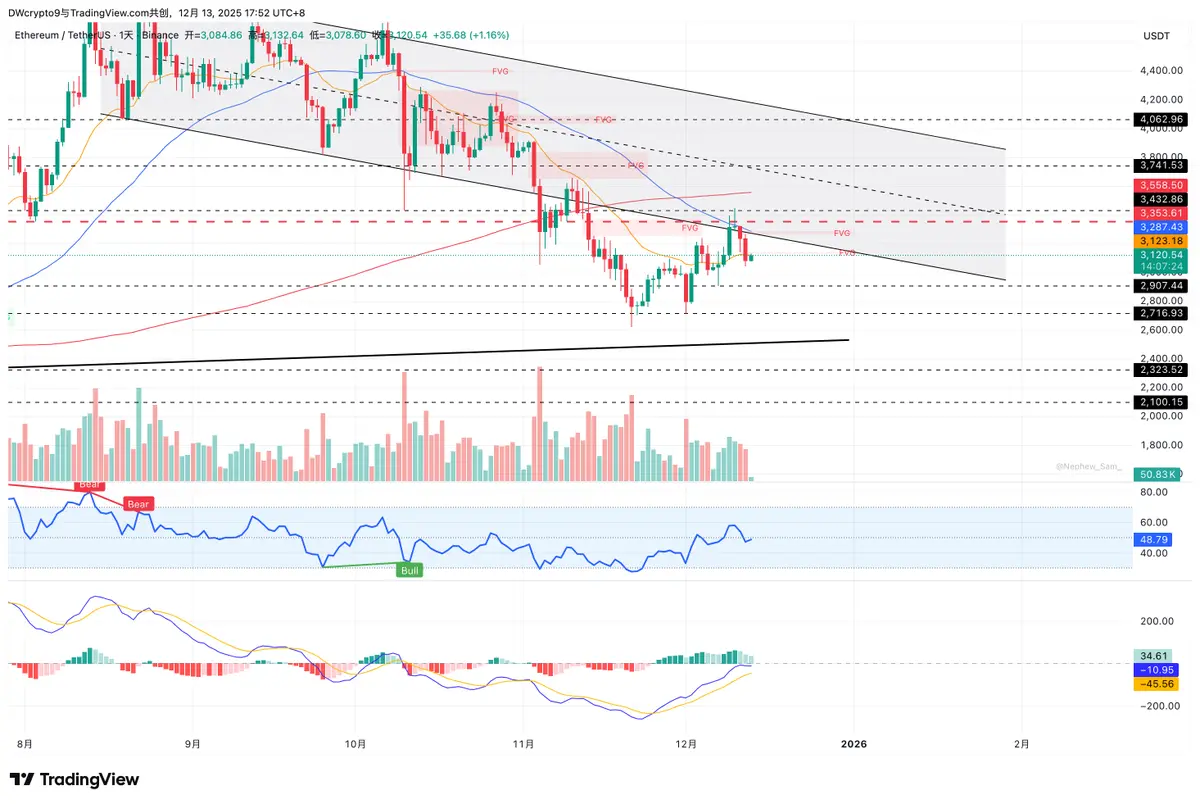
#ETH
🔥The current trend of 🔥ETH is essentially a battle between bulls and bears during a rebound.
📉 Bearish Scenario
If the rebound is again suppressed, it indicates that bears are still selling on rallies.
ETH may first fall back to $2907, then dip further to $2716.
Once the closing price drops below $2623, it can be confirmed that—
👉 The downtrend is restarting, and market sentiment will clearly weaken😰.
📈 Bullish Scenario
Conversely, as long as the price strongly breaks through the $3350 resistance level, the signal will fully turn bullish🚀.
This means a new upward trend is beginnin
ETH2,03%
- Reward
- like
- Comment
- Repost
- Share
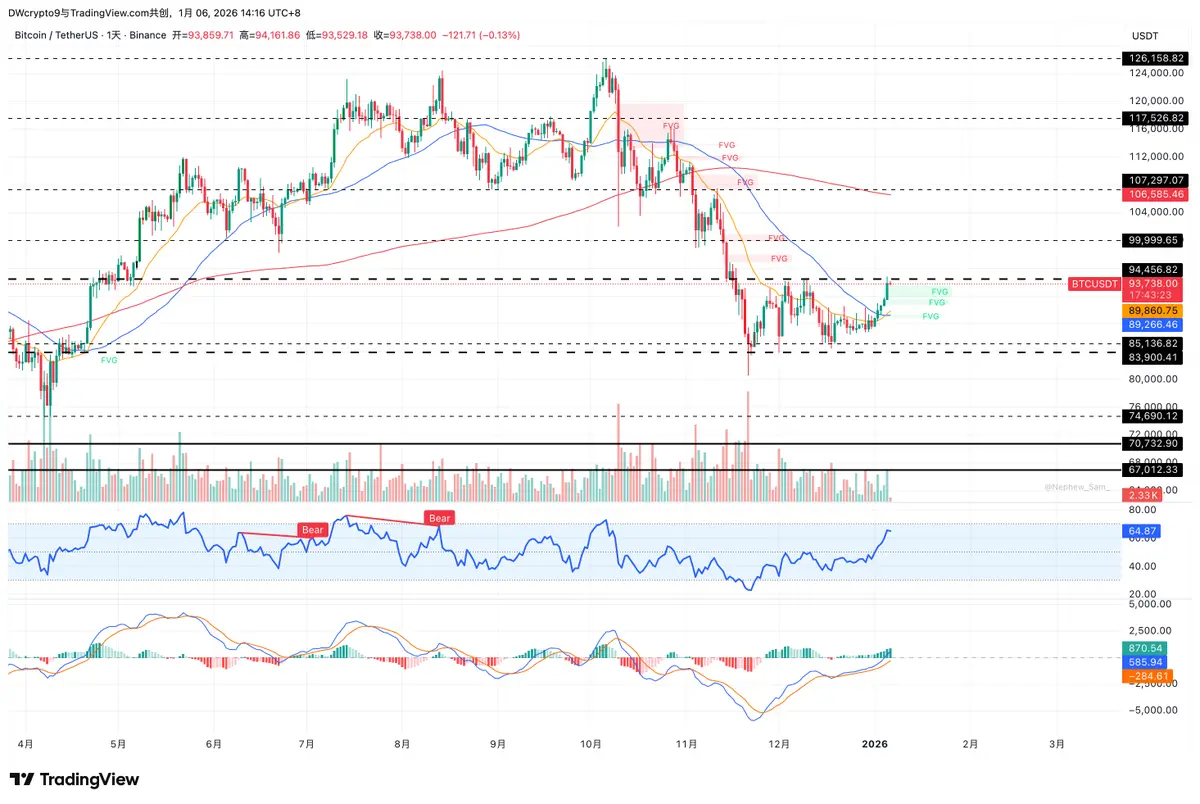
#BTC
🚀BTC's rebound was halted near the 50% Fibonacci retracement level at $94,050⚠️, indicating that the bears have already started to take action at high levels, and the rebound is not easy.
📉 What’s the support level below?
Currently, the key supports are at $87,700 and $84,000 in order.
Once the $84,000 support is broken, be cautious, as BTC is very likely to retest the November 21 low of $80,600😰.
📈 For the bulls to turn the tide, the conditions are very clear!
To regain strength, buyers must push the price above $94,500. Once stabilized, BTC has the chance to continue upward toward
BTC0,85%

- Reward
- like
- Comment
- Repost
- Share
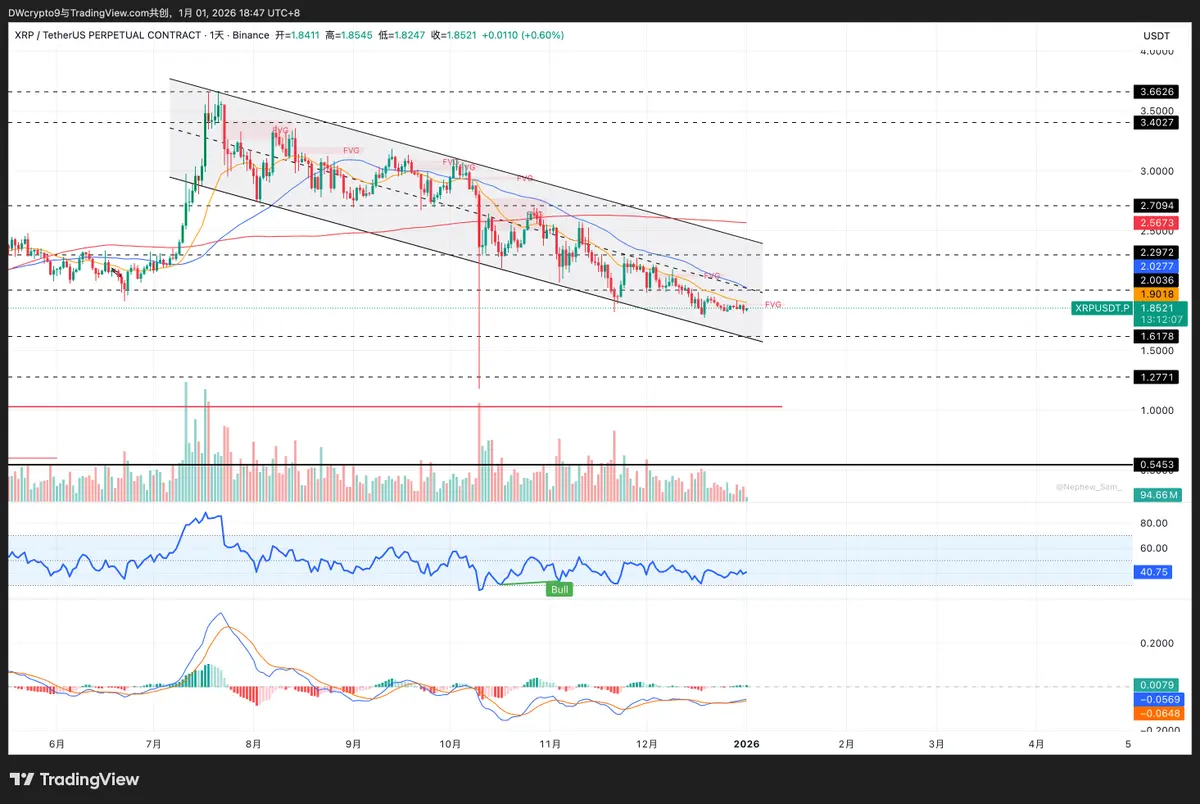
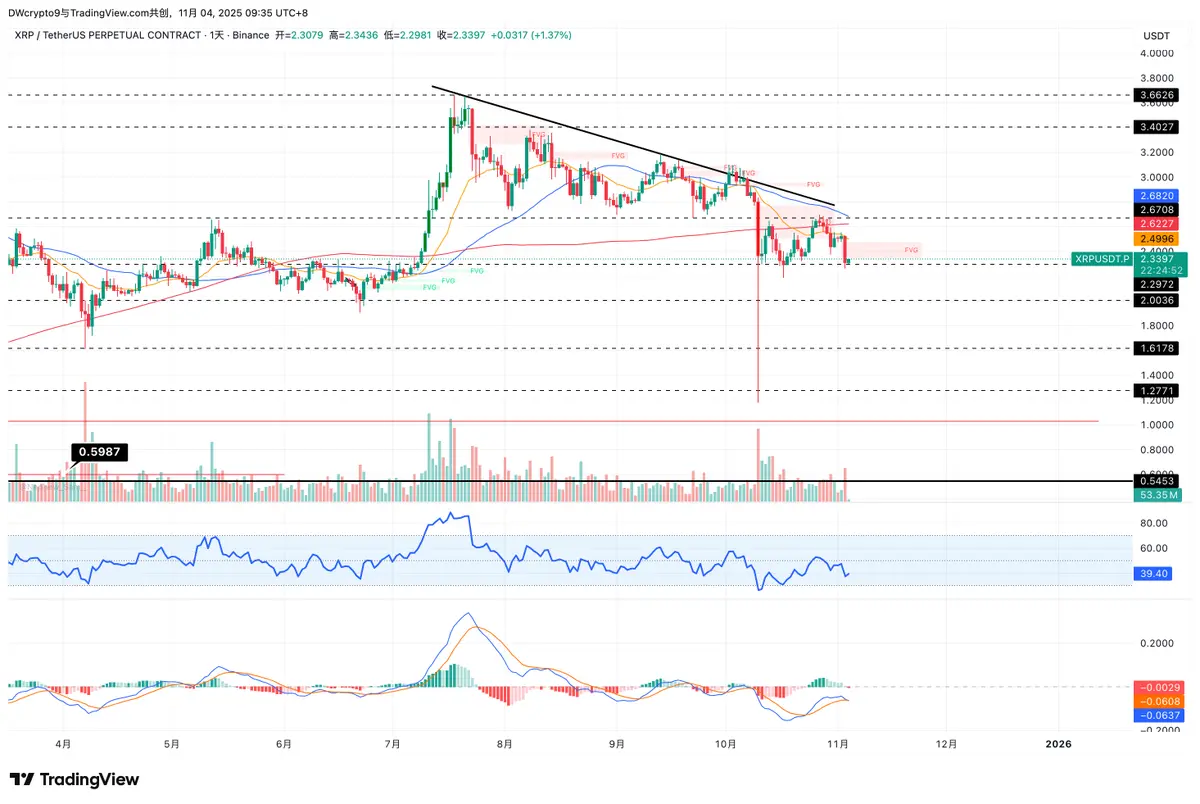
#XRP#
🚀XRP's recent movement can be described as dancing on the edge of a knife! 💃 Buyers are desperately trying to push the price above the 20-day moving average ($2.5), but the bears are holding their ground firmly, and both sides are truly at a standoff ⚡.
📉 The most critical support level right now is - $2.20! This is the price level that must be closely monitored in the short term. If it is broken by bears, XRP could continue to slide down to $2 or even $1.80, and that would be quite disastrous 🥶.
📈 However, if there's a rebound, brothers, don't get too excited—there wil
XRP9,37%
- Reward
- like
- Comment
- Repost
- Share
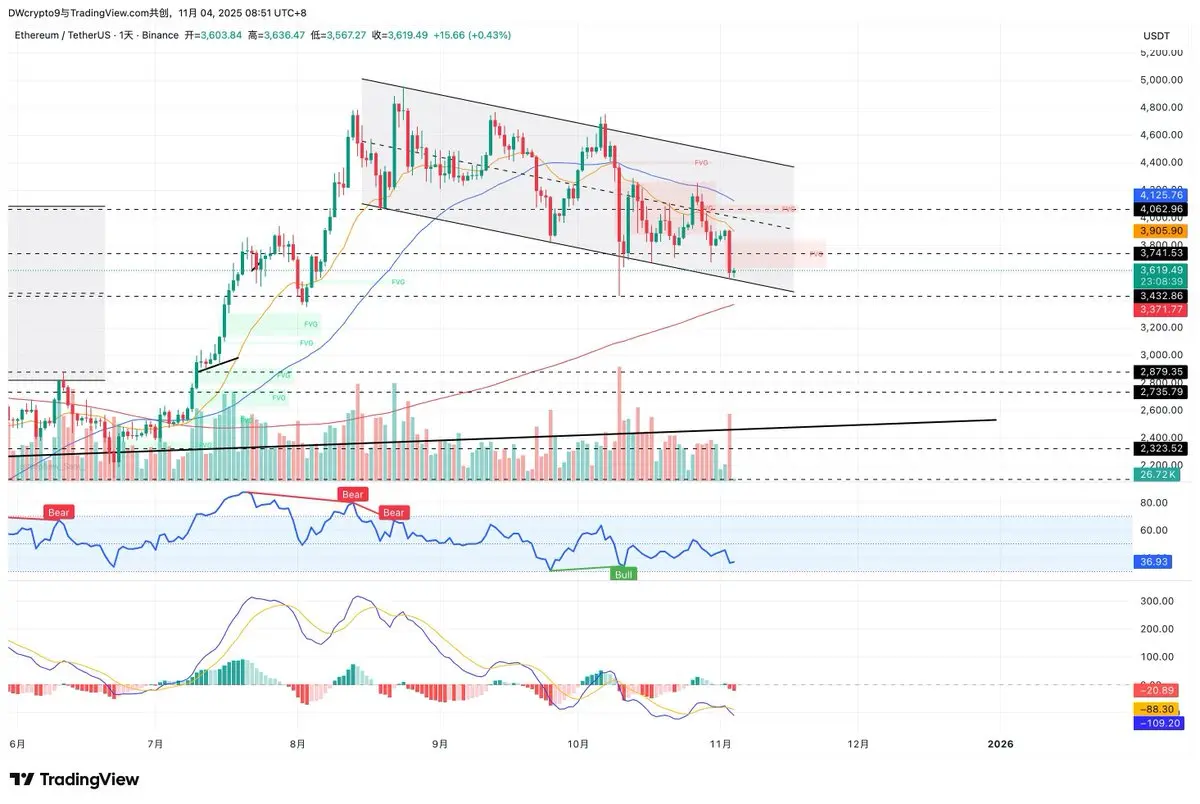
🚨ETH dropped directly below the 20-day moving average ($3917) on November 3, breaking through the support line of the descending channel, with short positions being aggressive 💣.
📉 From a technical perspective, the declining moving average + RSI dropping below 37 indicates that short positions have taken control. If this wave of ETH closes steadily below the channel support line, the next step is likely to test the key support zone between $3435 and $3350. That is the last line of defense for bulls; if it can't hold, it may continue to plunge.
💪 However, don't be too pessimistic—if
ETH2,03%
- Reward
- like
- Comment
- Repost
- Share