Trade
Trading Type
Spot
Trade crypto freely
Alpha
Points
Get promising tokens in streamlined on-chain trading
Pre-Market
Trade new tokens before they are officially listed
Margin
Magnify your profit with leverage
Convert & Block Trading
0 Fees
Trade any size with no fees and no slippage
Leveraged Tokens
Get exposure to leveraged positions simply
Futures
Futures
Hundreds of contracts settled in USDT or BTC
Options
HOT
Trade European-style vanilla options
Unified Account
Maximize your capital efficiency
Demo Trading
Futures Kickoff
Get prepared for your futures trading
Futures Events
Participate in events to win generous rewards
Demo Trading
Use virtual funds to experience risk-free trading
Earn
Launch
CandyDrop
Collect candies to earn airdrops
Launchpool
Quick staking, earn potential new tokens
HODLer Airdrop
Hold GT and get massive airdrops for free
Launchpad
Be early to the next big token project
Alpha Points
NEW
Trade on-chain assets and enjoy airdrop rewards!
Futures Points
NEW
Earn futures points and claim airdrop rewards
Investment
Simple Earn
Earn interests with idle tokens
Auto-Invest
Auto-invest on a regular basis
Dual Investment
Buy low and sell high to take profits from price fluctuations
Soft Staking
Earn rewards with flexible staking
Crypto Loan
0 Fees
Pledge one crypto to borrow another
Lending Center
One-stop lending hub
VIP Wealth Hub
Customized wealth management empowers your assets growth
Private Wealth Management
Customized asset management to grow your digital assets
Quant Fund
Top asset management team helps you profit without hassle
Staking
Stake cryptos to earn in PoS products
BTC Staking
HOT
Stake BTC and earn 10% APR
GUSD Minting
Use USDT/USDC to mint GUSD for treasury-level yields
More
LD Capital Weekly Macro Report (12.18): Powell's unexpected dovish sentiment led to aggressive repricing in the market
The chart above is the most important chart of the week, the FOMC members “collectively turned”, it can be said that the Fed’s December meeting released the clearest signal of interest rate cuts to date, and the 75bp drop also exceeded market expectations, after which everything from stocks to bonds, non-US currencies to commodities, everything was rising, but cryptocurrencies lagged this time.
Because on December 1, Powell also warned the market that “it is too early to guess when to start easing”, and on December 13, he said that “the issue of interest rate cuts has begun”, so this dovish turn is beyond market expectations, and last week the Dow and Nasdaq 100 both hit record highs, and the S&P 500 is only one step away from the all-time high. The small-cap represents the Russell 2000 index, which jumped 5.7% last week and is still more than 15% away from its all-time high.
Market risk appetite has strengthened further and substantially: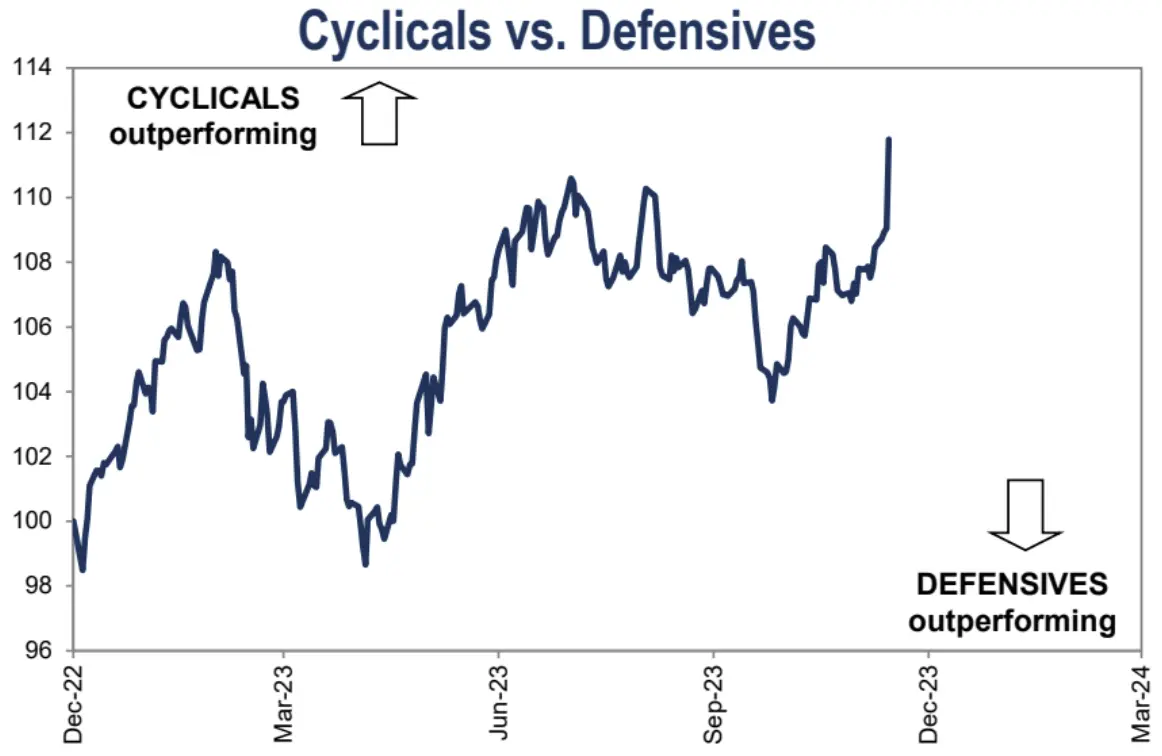
Funds are making rapid valuation repairs to real estate, consumer discretionaries, and industrial stocks, and there seems to be room for this:
The U.S. China Concept Index HXC rose 3%, although A closed lower for the sixth consecutive week;
The US 30-year Treasury yield fell below the 4% mark last week from a multi-year high of 5.18% in October, and the 10-year fell below the 3.9% mark. Williams and Bostic dampened some of the market’s enthusiasm on Friday, but the market correction was extremely limited, highlighting the fact that the Pivot narrative is still ongoing.
The derivatives market has already bet on an annual benchmark interest rate as low as 3.9% and started cutting rates in March. This is well below the 4.6% interest rate level shown by the Fed’s dot plot. Considering that the U.S. economic momentum, financial market performance, job market performance, business loan default rate (1.33%), credit default rate (90D 1.3%) and other indicators are all in a healthy or even overheated range, except that inflation is approaching the target, we do not see the reason why the Fed is rushing to cut interest rates after three months.
Moreover, the first interest rate cut cannot be regarded as a real easing of monetary policy, but a precautionary adjustment will be made in the case of a sharp easing of price pressures, and the overall level of restrictions will still be maintained, and if the economic growth performance next year is higher than the Fed’s 1.5% target, the actual room for interest rate cuts may be extremely limited.
The room for further optimism seems to have come to an end, and it could be a pretty good short-term take-profit point for bond bulls. For the equity market, there may still be some upside, mainly given the favourable macro backdrop, mainly the fact that a very friendly position has just been reached between the Fed and US economic growth, and secondly, seasonality and capital flows, which remain in a favourable situation.
But the overall Fed’s tone last week was still more dovish than that of the ECB, for example: ECB Governing Council member Madis Muller said on Friday that markets are ahead of their bets that the ECB will start cutting interest rates in the first half of next year. On Thursday, ECB President Christine Lagarde said that the bank had not discussed a rate cut at all.
After the meeting, major institutions also lowered their U.S. bond yield curve forecasts, with Barclays falling from 4.5% to 4.35%, Goldman Sachs from 4.3% to 4%, and JPMorgan Chase from 4.3% to 3.65% for 10Y U.S. Treasury bonds at the end of 24. We also saw Goldman Sachs directly raise the SPX price target by 8% to 5100 by the end of next year
BofA predicts 152 rate cuts by central banks around the world next year:
Jefferies: Heavily overbought
According to the 14-day RSI, 49% of stocks in the S&P 500 are considered overbought (>70). It’s rare for more than 50% of stocks in the SPX to be overheated. This has happened only once since 1990. This situation may be driven by a number of market stop-loss orders. It also usually marks a turning point in the market, where the market may enter a cooling-off period:
Historical Data:
Money market fund assets retreated for the first time since October
About $11.6 billion flowed out of U.S. money market funds in the week ended Dec. 13. Total assets fell to $5.886 trillion from $5.898 trillion in the previous week, the first net outflow since eight weeks.
Investors have poured $1.4 trillion into money market funds this year, while U.S. equity funds have received only $95 billion in inflows, a huge disparity
Money market fund assets falling from record highs before the quarterly tax day could signal a shift in flows, as the prospect of interest rate cuts next year prompts investors to seek higher returns on other assets.
However, according to Bank of America Merrill Lynch’s analysis, the large-scale and sustained inflow of money market funds into the risk asset market may not wait until the fourth quarter of next year, and most of them have historically been triggered by the end of the recession:
Over the past four cycles, money market fund inflows have continued for an average of 14 months after the last Fed rate hike. Considering that the last rate hike was in July 2023, this means that the inflow is likely to continue until September 2024.
Since 1990, money market fund outflows have started on average 12 months after the first rate cut, and if this trend continues, then outflows will begin in the first quarter of 2025.
Since 1990, all money market fund divestments have been triggered by the end of a recession, with the only exception being the soft landing in 2019, when there were no outflows.
Over the past five cycles, money market funds have seen outflows equivalent to 20% of previous inflows, meaning that approximately $250 billion of cash will be deployed into risky assets, which is expected to begin in the fourth quarter of 2024 or the first quarter of 2025.
Money Flow and Positions
Deutsche Bank’s measure of total equity position rose again this week, moving further into overweight territory (z-score 0.46, 70th percentile), high, but not extreme
Among them, the position level of independent strategy investors is 86 percentiles, and the systematic strategy is only 51 percentiles
Inflows into equity funds ($25.3 billion) also surged to their highest level in nearly 21 months, led by the United States ($25.9 billion), with the largest increase in emerging market equities:
The allocation of CTA funds to stocks has finally returned to the normal range and is currently trading at the 39th percentile:
BofA’s quantitative tracker believes that CTA funds have overtaken long positions in the Nasdaq and S&P and further buying is limited, although momentum in small-cap stocks is still expected to be supported in the coming week:
Goldman Sachs client trading data, total leverage rose 2.4 percentage points to 199.1% (100th percentile in three-year history) and net leverage rose 0.9 percentage points to 54.6% (48th percentile) The overall long/short ratio rose 0.2% to 1.755 (25th percentile):
Treasury funds saw their biggest two-week outflows since June 2020, and despite the recent rally in Treasuries, it could be seen that the funds that entered the market first may be cashing in:
Emotions
The Bank of America CBBS indicator reached its highest level since the start of the bull market 14 months ago, although it is far from reaching the extreme selling zone:
For the fifth week in a row, Goldman Sachs’ sentiment indicator is at the “excessive” level:
AAII Investor Survey Bullish Percentage Rises to Highest Since July 20,
The CNN Fear and Greed Index edged higher, sitting in the >70 greed range, but did not touch extreme greed