Bittensor – one of the prominent AI tokens on the market – is trading around $190 as of Thursday. The steady upward trend is also spreading across the cryptocurrency market, with Bitcoin holding firmly above $71,000 and Ethereum maintaining stability above $2,000.
Bittensor Gains in Value Amid Low Retail Investor Participation
Bittensor’s derivatives market continues to weaken as open interest (OI) in futures contracts decreased to $132 million on Thursday, down from $138 million the previous day. The growth momentum appears to be stalling, especially after OI reached $176 million in February but failed to sustain the expansion.
Data from CoinGlass shows that OI hit a record high of $418 million in November, coinciding with TAO’s price surge to $539. However, if retail investors continue to stay on the sidelines—reflecting caution and lack of confidence among traders in this AI token—the current recovery could lose momentum and increase the risk of a price correction.
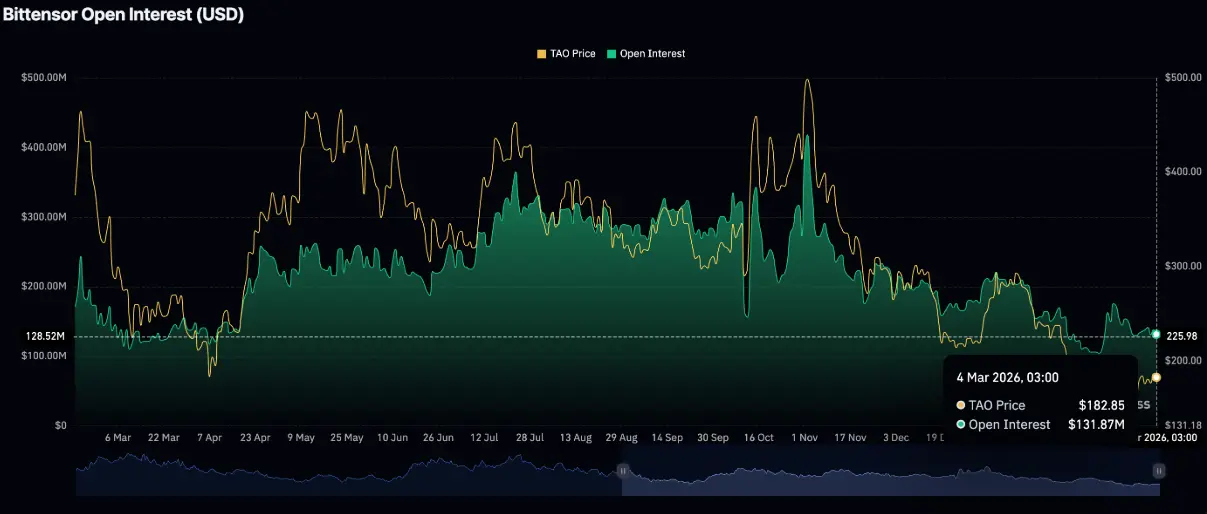 Bittensor Open Interest (OI) | Source: CoinGlass
Nevertheless, the picture is not entirely negative. Despite the decline in OI, traders are showing signs of increased participation in TAO’s derivatives products. This is evidenced by the funding rate, which stood at 0.0057% on Thursday, up from 0.0048% the day before. If this indicator continues to trend upward, it could become a key support factor for the price recovery, as short-term confidence in Bittensor’s prospects gradually strengthens.
Bittensor Open Interest (OI) | Source: CoinGlass
Nevertheless, the picture is not entirely negative. Despite the decline in OI, traders are showing signs of increased participation in TAO’s derivatives products. This is evidenced by the funding rate, which stood at 0.0057% on Thursday, up from 0.0048% the day before. If this indicator continues to trend upward, it could become a key support factor for the price recovery, as short-term confidence in Bittensor’s prospects gradually strengthens.
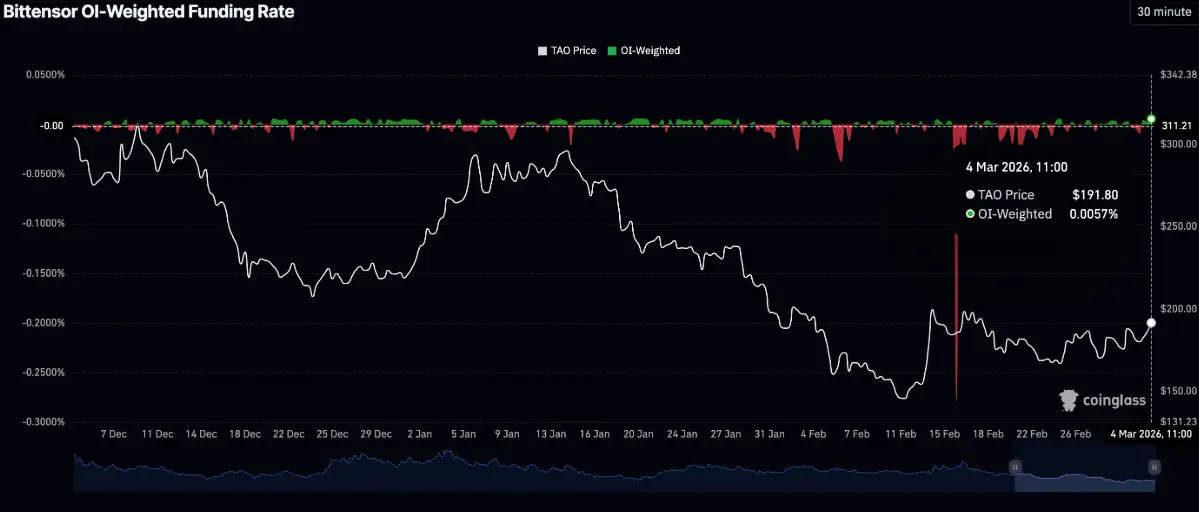 Bittensor Funding Rate | Source: CoinGlass
Technical Outlook: Bittensor Tests Short-Term Recovery Strength
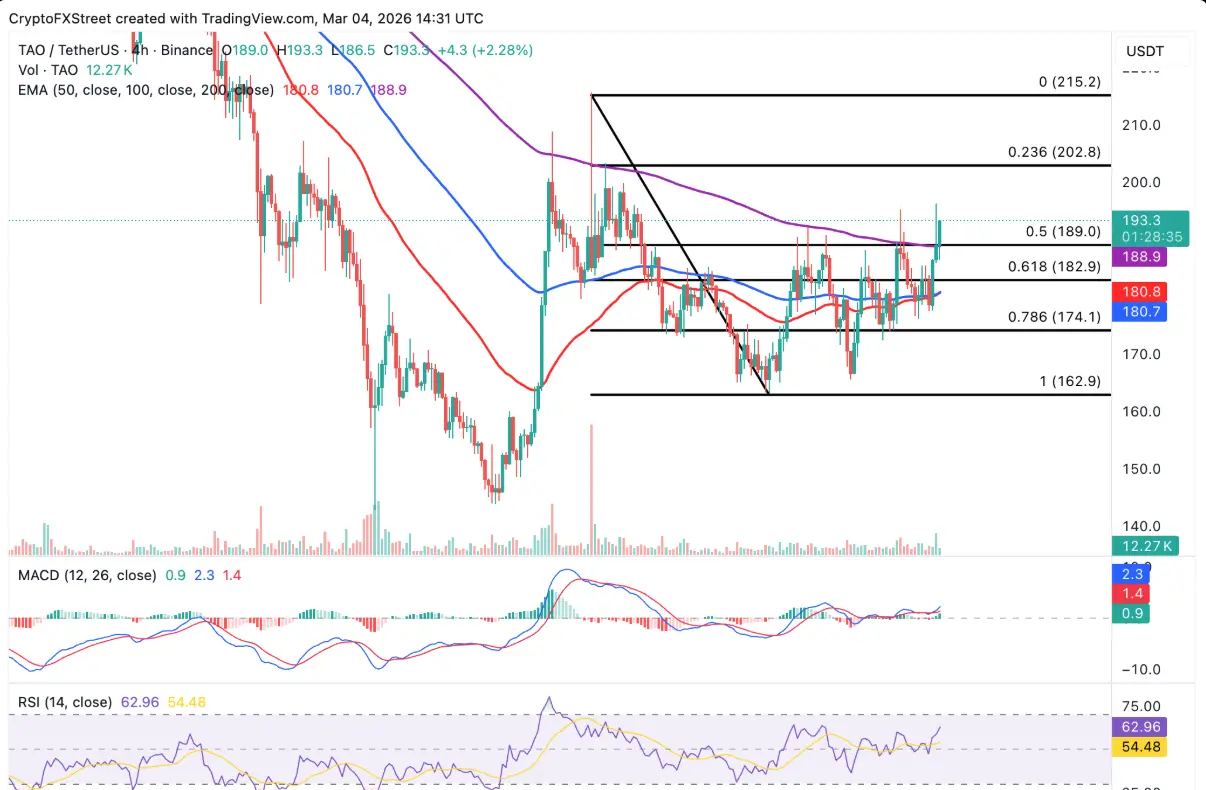
On the 4-hour chart, Bittensor is gradually breaking above the 50, 100, and 200-period exponential moving averages (EMA), currently clustered between $181 and $189. The 200-period EMA acts as the nearest support zone, providing a foundation for the bulls to sustain the recovery momentum and aim for the psychological $200 level.
Notably, the 50-period EMA is trending upward and crossing above the 100-period EMA, which could form a short-term Golden Cross—a signal often interpreted as a sign that the bullish trend is gaining dominance.
 TAO/USDT 4-hour Chart | Source: TradingView
In terms of momentum, the MACD indicator remains above its signal line, with green histogram bars continuing to expand. This reflects increasing buying pressure, supporting the short-term bullish outlook.
Meanwhile, the RSI indicator is oscillating around 63 and trending toward overbought territory. If this continues upward, the price rally is likely to be further reinforced.
Regarding key technical levels, the nearest support is identified around $189, where the 200-day EMA intersects with the 50% Fibonacci level. If the price closes below this short-term demand zone, Bittensor could retrace to the 61.8% Fibonacci level before testing the convergence of the 50 and 100 EMAs near $181.
Disclaimer: The information on this page may come from third parties and does not represent the views or opinions of Gate. The content displayed on this page is for reference only and does not constitute any financial, investment, or legal advice. Gate does not guarantee the accuracy or completeness of the information and shall not be liable for any losses arising from the use of this information. Virtual asset investments carry high risks and are subject to significant price volatility. You may lose all of your invested principal. Please fully understand the relevant risks and make prudent decisions based on your own financial situation and risk tolerance. For details, please refer to
Disclaimer.
Related Articles
XRP Breaks Above $1.40 as Spot ETF Inflows Hit $17.6M Milestone
XRP breaks $1.40 after Ripple partnership boosts investor confidence and market momentum.
Spot XRP ETFs record $17.6M inflows, signaling rising institutional demand and interest.
Technical indicators show resistance ahead, with support holding near $1.40 and $1.3840.
Ripple’s XRP is
CryptoNewsLand1h ago
PEPE Reclaims 0.00000400 — Is This 1.8% Move the Start of a Bigger Run?
PEPE rebounds from 0.00000385 support, forming higher lows and stronger bullish structure.
Technical indicators like MACD and RSI show momentum with room for further upside.
Key resistance at 0.00000410; support at 0.00000380 critical for trend continuation.
PepeCoin — PEPE, has
CryptoNewsLand6h ago
ETH drops 0.58% in 15 minutes: derivatives liquidity contraction and proactive position reduction dominate short-term pullback
From 2026-04-19 04:30 to 2026-04-19 04:45 (UTC), within ETH’s 15-minute candlestick chart, the return recorded -0.58%, and the price range was 2321.62 to 2342.04 USDT, with an amplitude of 0.87%. The short-term selloff occurred against a backdrop of increased overall market volatility and a broad decline in the prices of major crypto assets; overall market risk appetite clearly fell, and traders’ wait-and-see sentiment strengthened.
The main driver behind this abnormal move is a sharp contraction in liquidity in the derivatives market and leveraged funds proactively reducing positions. Data shows that over the past 24 hours, the ETH/USD perpetual contract trading volume dropped 67.16% to approximately 74.87 million, open interest edged down 3.33% to 329 million, and liquidation amounts did not expand unusually. This structure indicates that the market lacks the risk of passive cascades; more funds chose to proactively step aside and wait on the sidelines, intensifying short-term selling pressure.
In addition, the long/short structure in which shorts held the upper hand (long/short ratio 47.48%:52.52%) and sentiment synchronization with the panic range reinforced the downward price trend. During the same period, major coins such as BTC and SOL also fell 2%-3.4% in tandem, further showing that this pullback was driven by system-wide risk sentiment. On-chain funds did not show any large abnormal transfers or large-scale liquidations of DeFi protocols; spot and on-chain liquidity remained generally stable, and no sudden system risk resonance was observed.
Current volatility-related risks still need close monitoring, especially as overall risk appetite continues to contract—ETH’s short-term price may face further downside probing. Watch subsequent changes in derivatives trading volume and open interest, extreme shifts in the long/short ratio and funding rate, and promptly monitor on-chain fund flows, large transfers, and any signs of amplified platform net outflows. For more market anomalies and deeper analysis, please continue to follow our upcoming market updates.
GateNews7h ago
Spark Protocol's January delisting of rsETH proves prudent as Aave faces ETH liquidity crisis
Spark Protocol's strategy of delisting low-usage assets and tightening collateral has faced initial backlash but proved wise during market turmoil. While maintaining higher interest rate caps, SparkLend ensures liquidity, unlike Aave, which now faces significant risks.
GateNews7h ago
Request Network (REQ) Surges 23.68% in 15 Minutes, 24-Hour Gain Reaches 116.52%
Request Network (REQ) surged 23.68% in just 15 minutes, reaching $0.152, with a 24-hour rise of 116.52% and trading volume over $8 million. Factors include retail interest and whale accumulation. Resistance at $0.160 and support at $0.122 are under observation.
GateNews8h ago
Solana Price Stalls Near $80 as ETF Outflows Weigh
Solana trades around $80, facing bearish sentiment due to ETF outflows and declining retail participation. Technical indicators show mixed signals, with resistance at $87 and $98, while support at $77 remains critical for stability.
CryptoFrontNews13h ago
