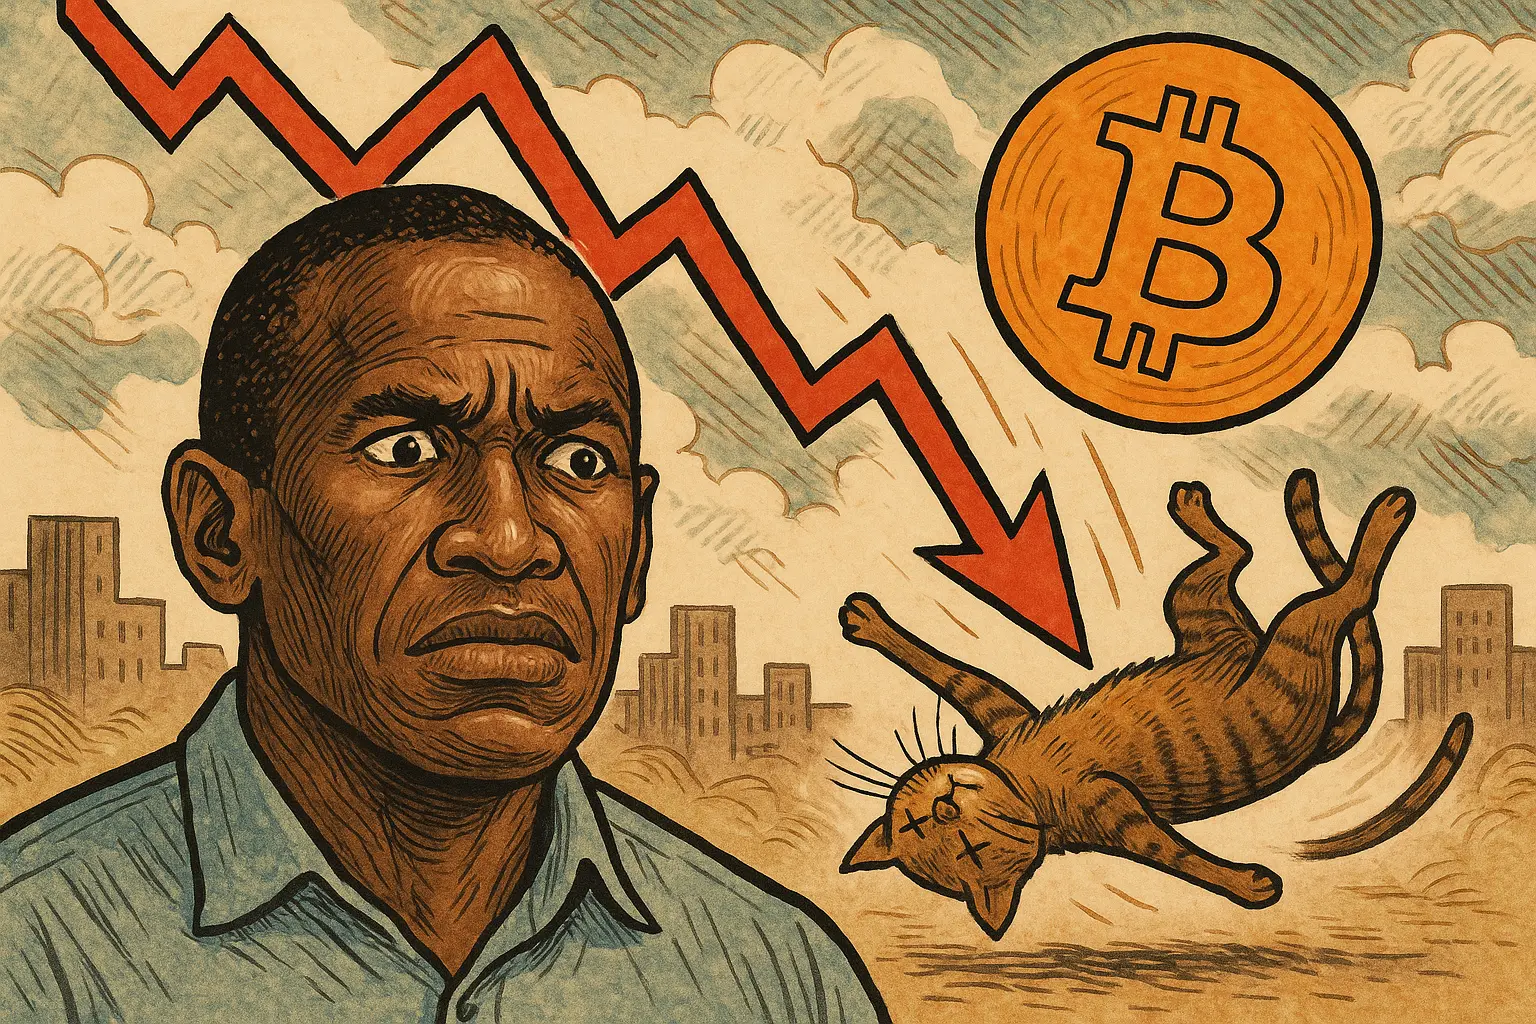
Legendary trader Arthur Hayes posted on social platform X on Wednesday, sharing a chart that shows Bitcoin and the US SaaS Software ETF (IGV) have been highly synchronized over the past year. He explicitly stated that Bitcoin has not yet decoupled from US SaaS tech companies, and the current rebound may only be a “dead cat bounce,” urging investors to remain patient.
Chart Interpretation: One-Year Synchronization of BTC and SaaS
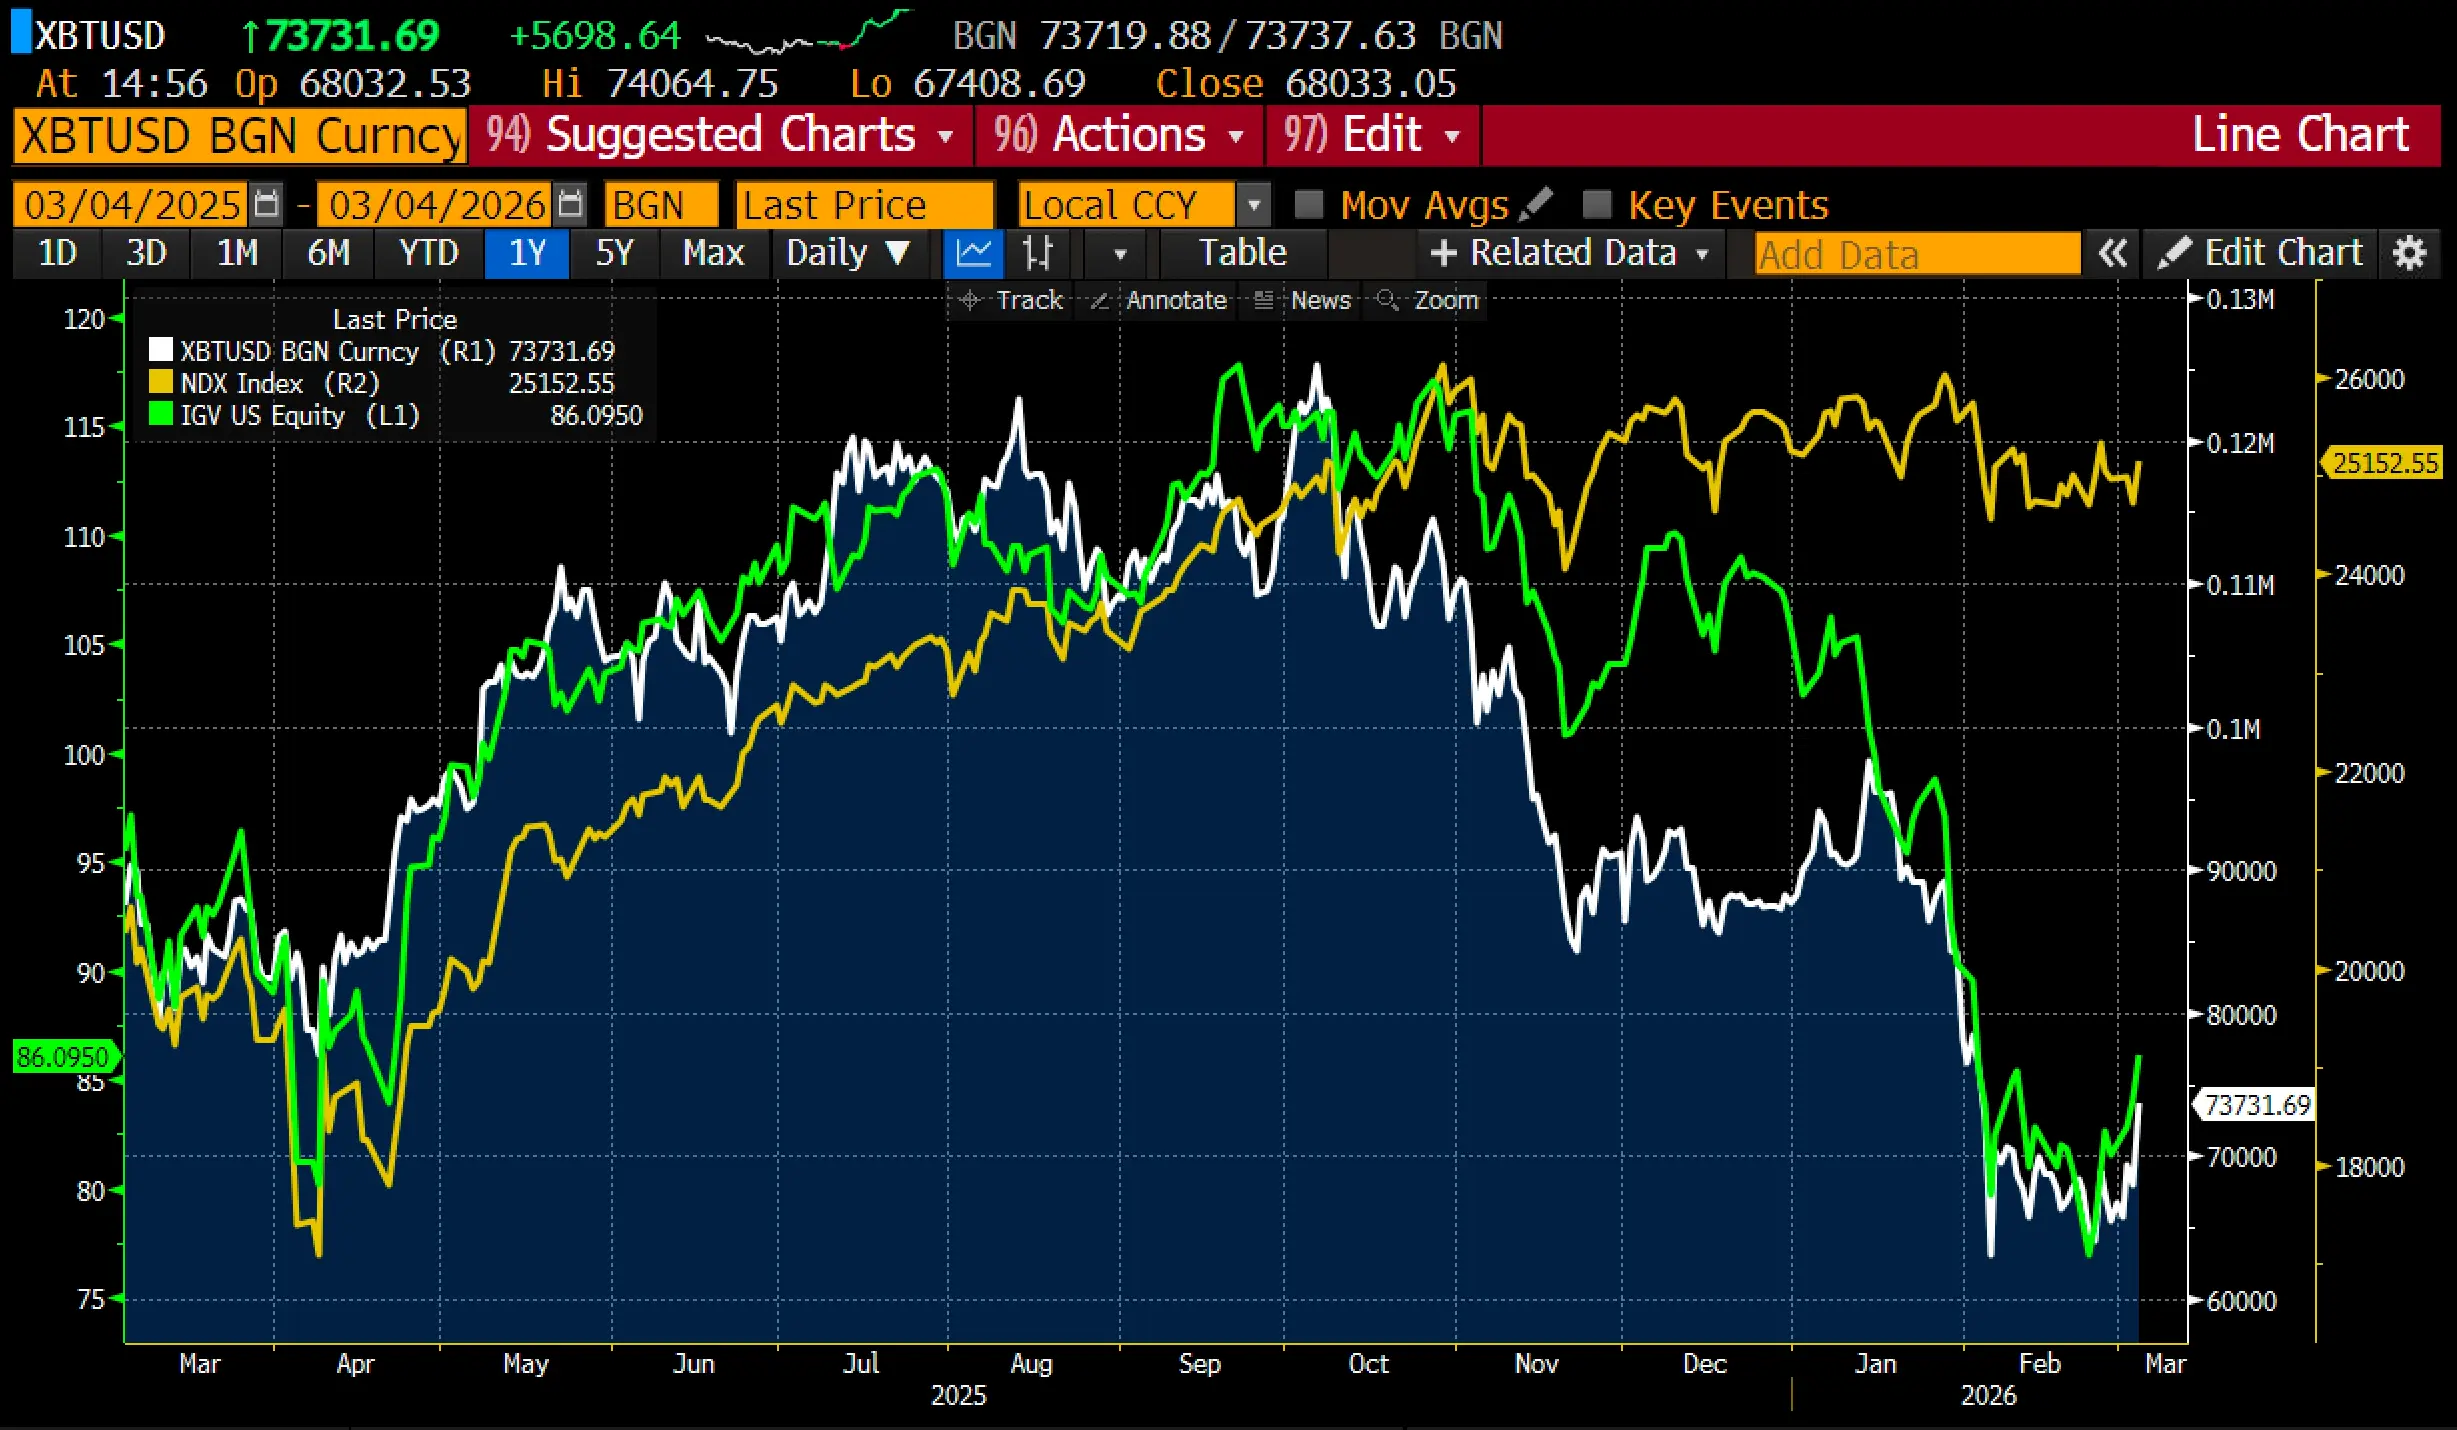
(Source: Arthur Hayes X)
The chart shared by Hayes covers exactly one year from March 2025 to March 2026, displaying the trends of Bitcoin (white line), Nasdaq 100 Index (NDX, yellow line), and iShares North American Technology Software ETF (IGV, green line). The three lines show clear synchronization at the following points: rising together in summer 2025, peaking together in October to November, crashing at the end of January 2026, and rebounding nearly equally over the past two weeks.
IGV is currently around 86, with a decline similar to Bitcoin. The synchronized pullback from their respective highs clearly indicates that Bitcoin is still viewed by institutions as a “high Beta tech asset” in the current market context, rather than an independent store of value. As long as the US SaaS sector remains under pressure, Bitcoin will find it difficult to break out into an independent trend.
Dead Cat Bounce Mechanism: How to Distinguish Short-Term Rebound from True Bottom
A “dead cat bounce” is a classic technical analysis pattern—an asset experiences a brief rebound after a prolonged decline, only to continue falling afterward. This pattern essentially reflects a temporary easing of selling pressure and technical correction, not a structural reversal confirming a market bottom.
Key Points to Identify a Dead Cat Bounce in Current Market Conditions
Cross-Asset Correlation: Bitcoin and SaaS tech stocks (IGV) continue to move in high sync, lacking independent upward momentum from tech stocks.
Volume Confirmation: Genuine bottoms are usually confirmed with increased volume; a rebound on declining volume raises doubts about sustainability.
Macro Environment: The macro factors driving SaaS sector declines—interest rate expectations, tech valuation corrections—have not fundamentally changed.
Hayes’ Position Shift: He previously set an extremely bullish target of $500,000 to $750,000 by year-end. His recent warning to “remain patient” is seen as a strong signal of short-term caution.
Decoupling as the True Bullish Start: Historical Precedents and Current Gaps
On-chain analyst PlanB pointed out that after Bitcoin decoupled from US stocks in 2015, BTC surged nearly tenfold over the next two years. Dissolving correlation often signals the start of a new major rally. However, Hayes’ chart clearly shows that, at least for now, this decoupling has not occurred. Before Bitcoin truly breaks away from the high correlation with SaaS tech stocks, any rebound should be cautiously evaluated for its sustainability, rather than being seen as a confirmed trend reversal.
FAQs
Q: Why does Arthur Hayes believe the current rebound is a dead cat bounce rather than a true bottom?
A: Hayes’ reasoning is based on the chart showing synchronized movements of Bitcoin and IGV (SaaS ETF), indicating both are still driven by the same macro forces. The lack of independent outperformance by Bitcoin suggests the rebound is more likely a technical correction rather than a trend reversal.
Q: What is IGV, and why is it an important indicator for Bitcoin decoupling?
A: IGV (iShares Expanded Tech-Software Sector ETF) tracks major US SaaS and tech software companies, including Salesforce, ServiceNow, and others with high valuations. These assets are high-risk, high-growth, and highly sensitive to interest rate and liquidity changes. The correlation between IGV and Bitcoin is a key reference for assessing whether Bitcoin is entering an independent trend.
Q: When will Bitcoin truly decouple from SaaS tech stocks?
A: Historically, decoupling requires Bitcoin to demonstrate independent demand—such as the effects of halving, institutional buying breakthroughs, or significant on-chain activity increases. Hayes’ chart shows high correlation still persists; a true decoupling signal will be confirmed only when Bitcoin consistently outperforms IGV on a relative basis.
Disclaimer: The information on this page may come from third parties and does not represent the views or opinions of Gate. The content displayed on this page is for reference only and does not constitute any financial, investment, or legal advice. Gate does not guarantee the accuracy or completeness of the information and shall not be liable for any losses arising from the use of this information. Virtual asset investments carry high risks and are subject to significant price volatility. You may lose all of your invested principal. Please fully understand the relevant risks and make prudent decisions based on your own financial situation and risk tolerance. For details, please refer to
Disclaimer.
Related Articles
PEPE Reclaims 0.00000400 — Is This 1.8% Move the Start of a Bigger Run?
PEPE rebounds from 0.00000385 support, forming higher lows and stronger bullish structure.
Technical indicators like MACD and RSI show momentum with room for further upside.
Key resistance at 0.00000410; support at 0.00000380 critical for trend continuation.
PepeCoin — PEPE, has
CryptoNewsLand2h ago
ETH drops 0.58% in 15 minutes: derivatives liquidity contraction and proactive position reduction dominate short-term pullback
From 2026-04-19 04:30 to 2026-04-19 04:45 (UTC), within ETH’s 15-minute candlestick chart, the return recorded -0.58%, and the price range was 2321.62 to 2342.04 USDT, with an amplitude of 0.87%. The short-term selloff occurred against a backdrop of increased overall market volatility and a broad decline in the prices of major crypto assets; overall market risk appetite clearly fell, and traders’ wait-and-see sentiment strengthened.
The main driver behind this abnormal move is a sharp contraction in liquidity in the derivatives market and leveraged funds proactively reducing positions. Data shows that over the past 24 hours, the ETH/USD perpetual contract trading volume dropped 67.16% to approximately 74.87 million, open interest edged down 3.33% to 329 million, and liquidation amounts did not expand unusually. This structure indicates that the market lacks the risk of passive cascades; more funds chose to proactively step aside and wait on the sidelines, intensifying short-term selling pressure.
In addition, the long/short structure in which shorts held the upper hand (long/short ratio 47.48%:52.52%) and sentiment synchronization with the panic range reinforced the downward price trend. During the same period, major coins such as BTC and SOL also fell 2%-3.4% in tandem, further showing that this pullback was driven by system-wide risk sentiment. On-chain funds did not show any large abnormal transfers or large-scale liquidations of DeFi protocols; spot and on-chain liquidity remained generally stable, and no sudden system risk resonance was observed.
Current volatility-related risks still need close monitoring, especially as overall risk appetite continues to contract—ETH’s short-term price may face further downside probing. Watch subsequent changes in derivatives trading volume and open interest, extreme shifts in the long/short ratio and funding rate, and promptly monitor on-chain fund flows, large transfers, and any signs of amplified platform net outflows. For more market anomalies and deeper analysis, please continue to follow our upcoming market updates.
GateNews3h ago
Spark Protocol's January delisting of rsETH proves prudent as Aave faces ETH liquidity crisis
Spark Protocol's strategy of delisting low-usage assets and tightening collateral has faced initial backlash but proved wise during market turmoil. While maintaining higher interest rate caps, SparkLend ensures liquidity, unlike Aave, which now faces significant risks.
GateNews4h ago
Request Network (REQ) Surges 23.68% in 15 Minutes, 24-Hour Gain Reaches 116.52%
Request Network (REQ) surged 23.68% in just 15 minutes, reaching $0.152, with a 24-hour rise of 116.52% and trading volume over $8 million. Factors include retail interest and whale accumulation. Resistance at $0.160 and support at $0.122 are under observation.
GateNews5h ago
Solana Price Stalls Near $80 as ETF Outflows Weigh
Solana trades around $80, facing bearish sentiment due to ETF outflows and declining retail participation. Technical indicators show mixed signals, with resistance at $87 and $98, while support at $77 remains critical for stability.
CryptoFrontNews9h ago
Dogecoin Holds $0.094 as X Cashtags Drive Market Attention
Key Insights
Dogecoin holds above $0.094 despite market weakness as Bitcoin and Ethereum stabilize, reflecting resilience and sustained demand across major cryptocurrencies during the consolidation phase.
X launches smart cashtags enabling real-time crypto and stock tracking, improving marke
CryptoNewsLand12h ago
