The true usage map of stablecoins: Over 170 million holders worldwide, with more than 90% flowing into DEX and CEX
Author: Dune
Compiled by: Felix, PANews
Recently, Dune partnered with Steakhouse Financial to release a stablecoin data set. This dataset covers dimensions such as holder composition, fund flows, on-chain activity classification, and circulation speed, providing a basis for institutional analysis, research reports, compliance monitoring, and high-level decision-making. Through analysis of the dataset, Dune’s article reveals some real-world aspects of the stablecoin market. Below are the details.
Everyone is citing stablecoin supply data. In every report, earnings call, and policy hearing, supply figures are everywhere. But besides the figure “over $300 billion in circulation,” how much do we really understand about stablecoins?
Who holds them? How concentrated is ownership? How fast do they circulate? On which blockchains do they operate? What are their actual uses? Are they for DeFi liquidity, payments, or just idle capital?
As Meta announced plans to integrate third-party stablecoin payments on its platform; Bridge received approval from the U.S. Office of the Comptroller of the Currency (OCC) to establish a national trust bank; Payoneer enabled stablecoin features for 2 million merchants; Anchorage Digital launched compliant stablecoin services for non-U.S. banks. Institutions and regulators are entering the space in large numbers, and they need answers far deeper than a simple supply figure.
Using Dune’s latest stablecoin dataset, we answer these questions. The following are insights revealed by the data:
Overview of Supply
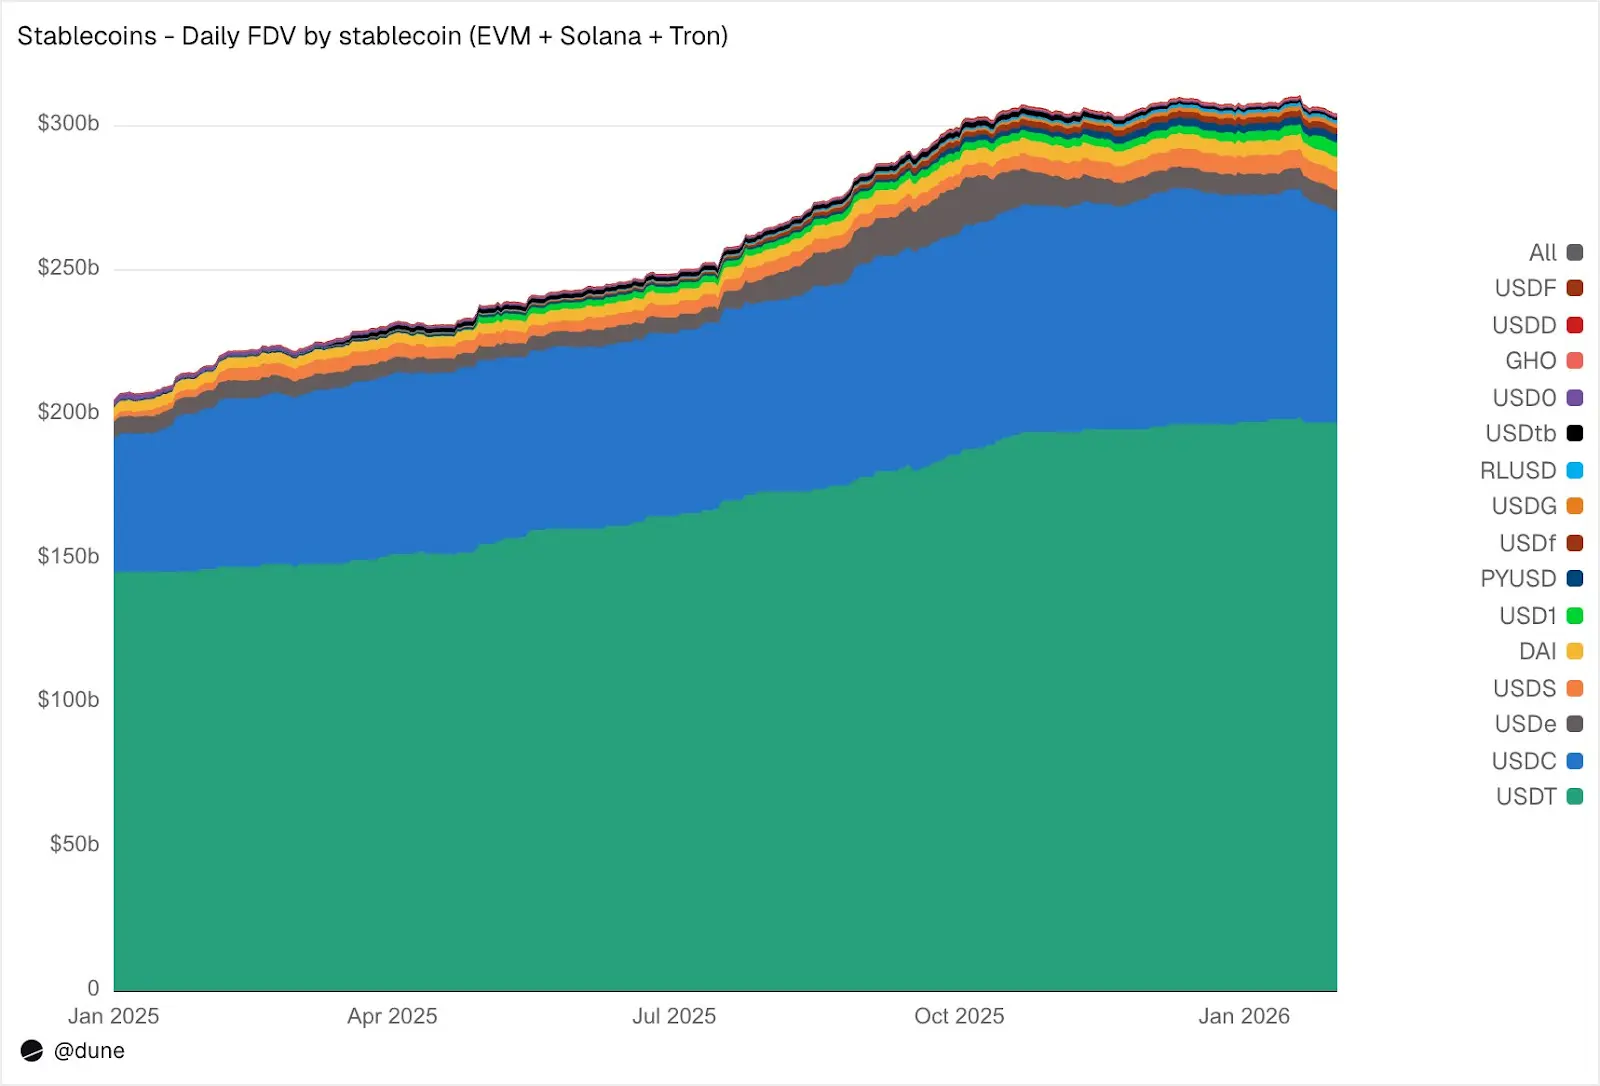
As of January 2026, the fully diluted supply of the top 15 stablecoins on EVM-compatible chains, Solana, and Tron reached $304 billion, a 49% increase year-over-year. Tether’s USDT ($197 billion) and Circle’s USDC ($73 billion) still account for 89% of the market share.
By chain, Ethereum holds $176 billion (58%), Tron $84 billion (28%), Solana $15 billion (5%), and BNB Chain $13 billion (4%). Despite the total supply nearly doubling, the distribution across chains has remained almost unchanged over the past year.
Source: Dune
But beyond the two major stablecoins, 2025 is the “year of challengers.” USDS (Sky Ecosystem) grew by 376%, reaching $6.3 billion. PYUSD (PayPal) surged by 753%, reaching $2.8 billion. RLUSD (Ripple) skyrocketed from $58 million to $1.1 billion, a 1803% increase. USDG’s market cap increased 52 times. USD1’s market cap jumped from zero to $5.1 billion.
Not all challengers grew, however. USD0 declined by 66%, and Ethena’s USDe peaked in October (nearly tripling) before ending the year up 23%. Even so, the group of competitors under USDT and USDC has expanded significantly.
Who Holds Stablecoins
Most stablecoin datasets only show total supply. Because our dataset tracks wallet-level balances and address labels, we can identify who holds these stablecoins.
Source: Dune
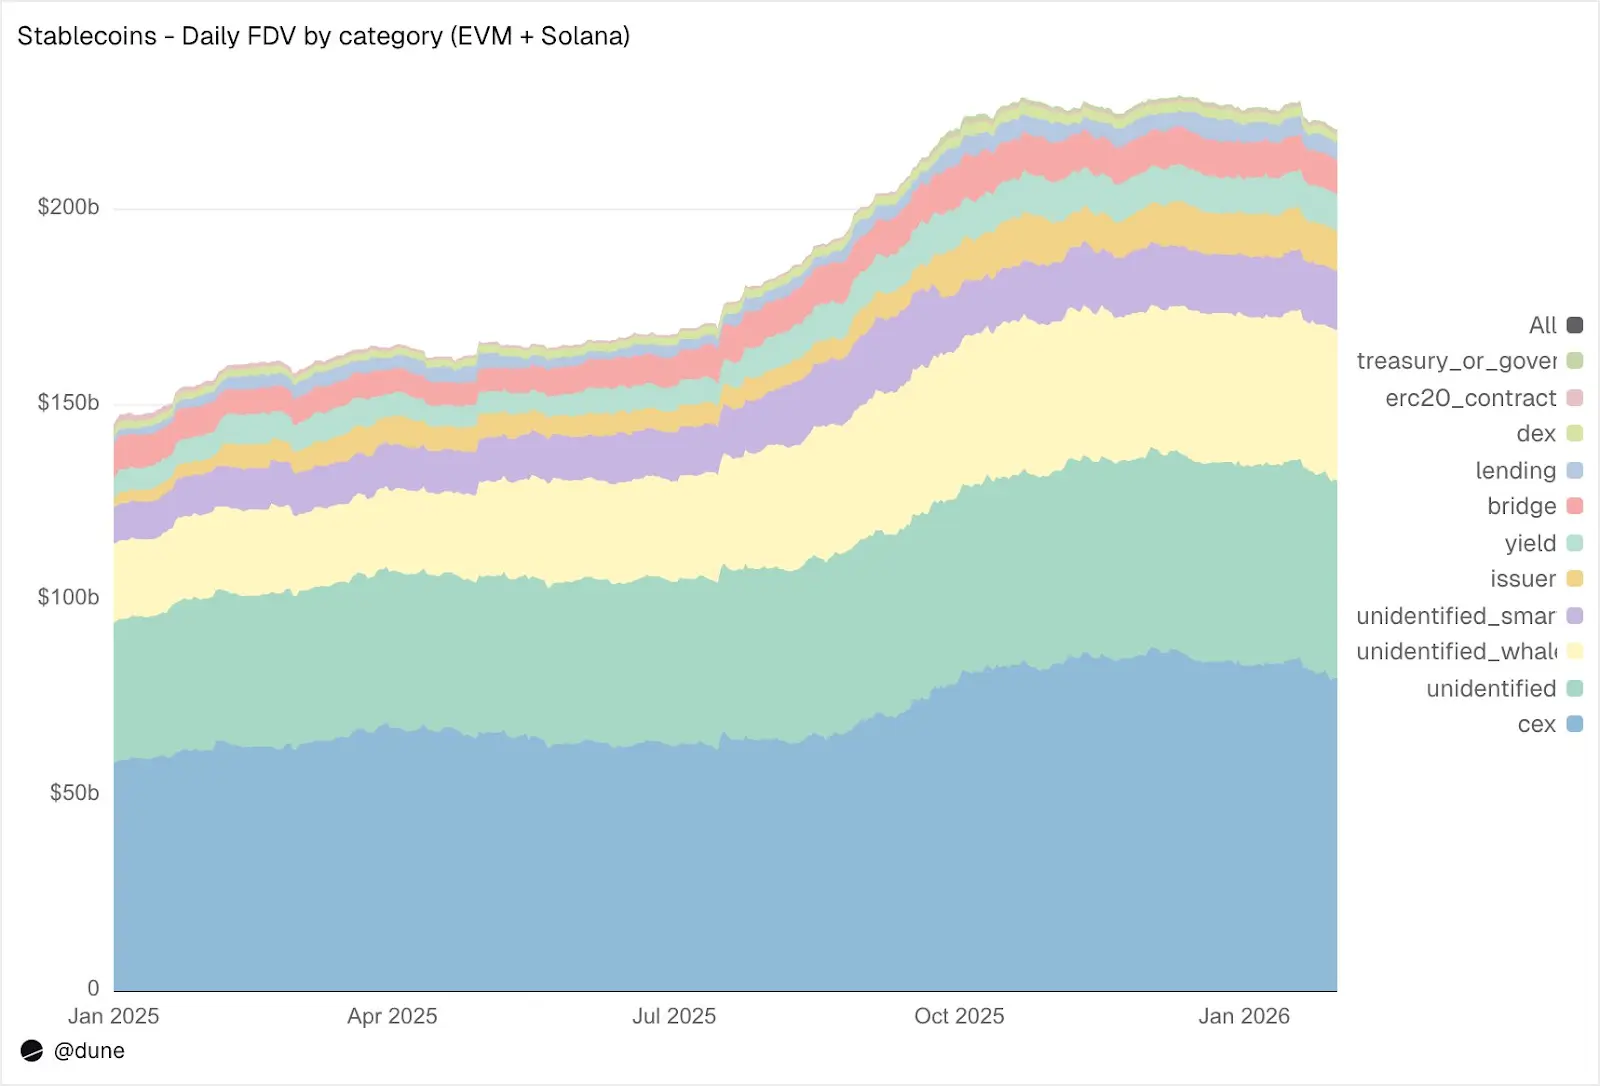
On EVM and Solana, centralized exchanges (CEXs) are the largest known holders, with $80 billion (up from $58 billion last year). The primary function of stablecoins remains as trading and settlement infrastructure for exchanges. Whale wallets hold $39 billion. Yield protocol holdings nearly doubled to $9.3 billion, reflecting growth in on-chain yield strategies. Issuer addresses (treasuries and mint/burn contracts) jumped 4.6 times from $2.2 billion to $10.2 billion, directly indicating the scale of new supply entering the market.
Regarding label quality: only 23% of the supply is in completely unrecognized addresses. For on-chain data, this is a very high recognition rate. This is crucial for understanding the actual risk sources of stablecoins.
172 Million Holders, but Highly Concentrated
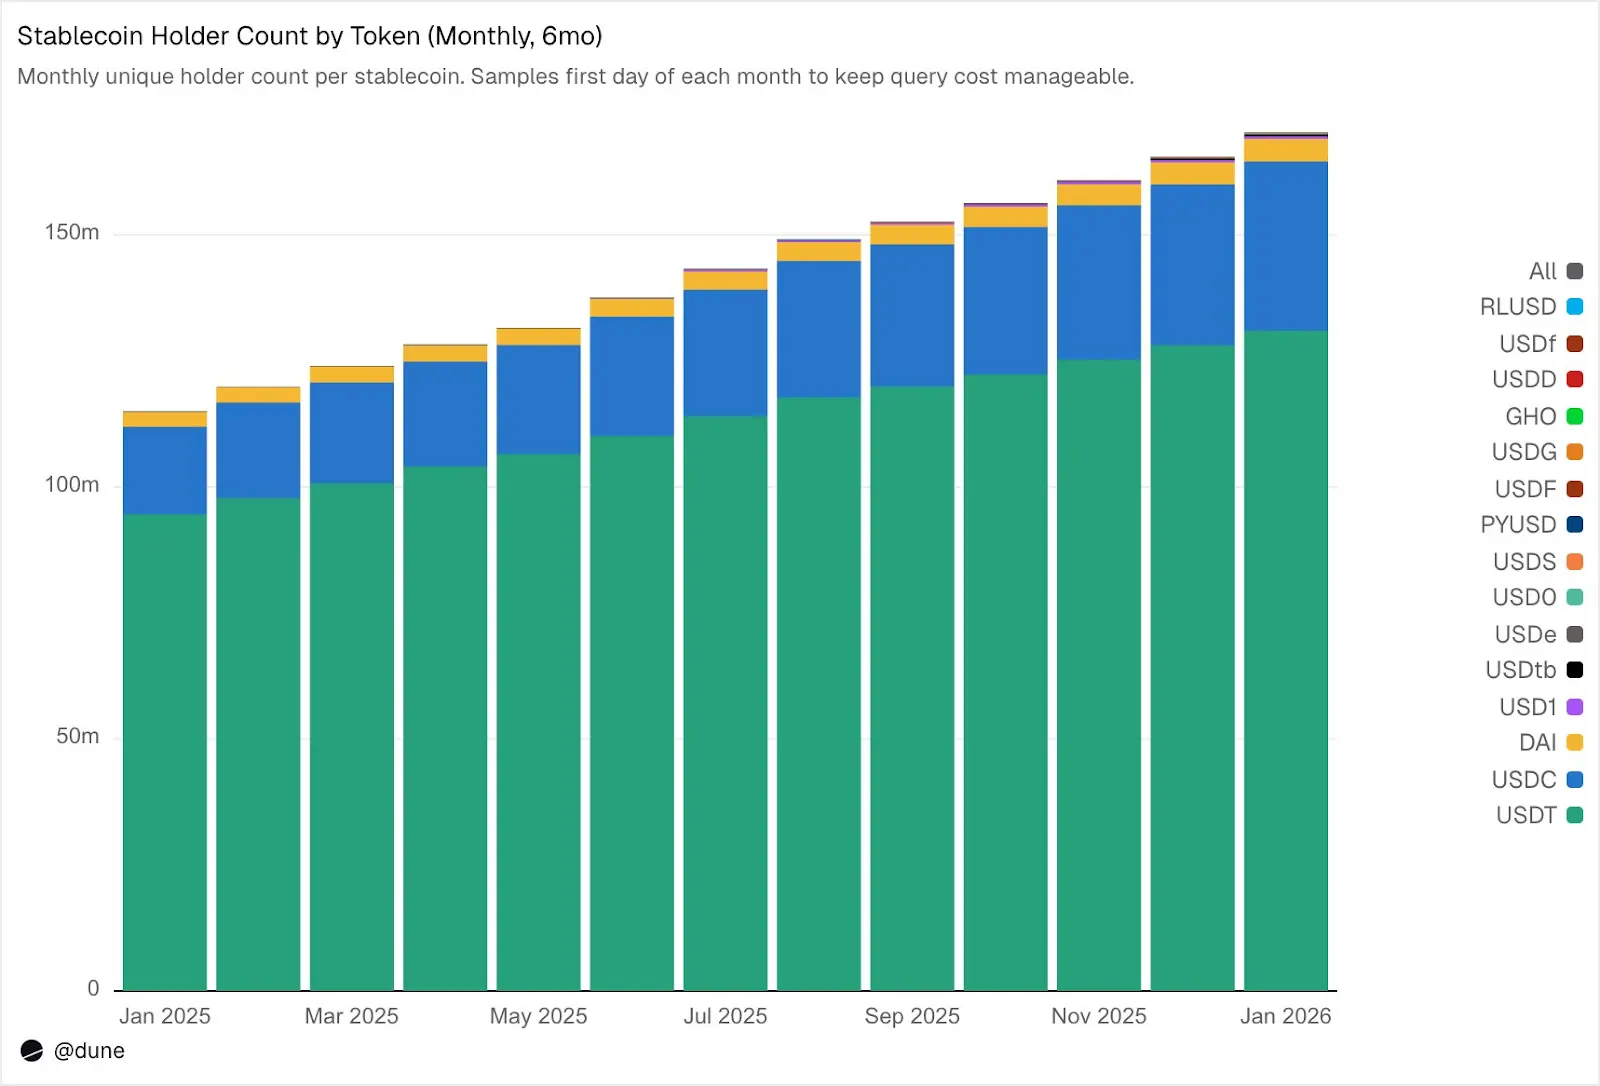
As of February 2026, 172 million unique addresses hold at least one of these 15 stablecoins. Among them, USDT accounts for 136 million, USDC 36 million, DAI 4.7 million. The distribution of these three stablecoins is very broad: the top 10 wallets hold only 23-26% of the supply; the Herfindahl-Hirschman Index (HHI, a standard measure of economic concentration, 0 means fully dispersed, 1 means a single holder) is below 0.03.
Source: Dune
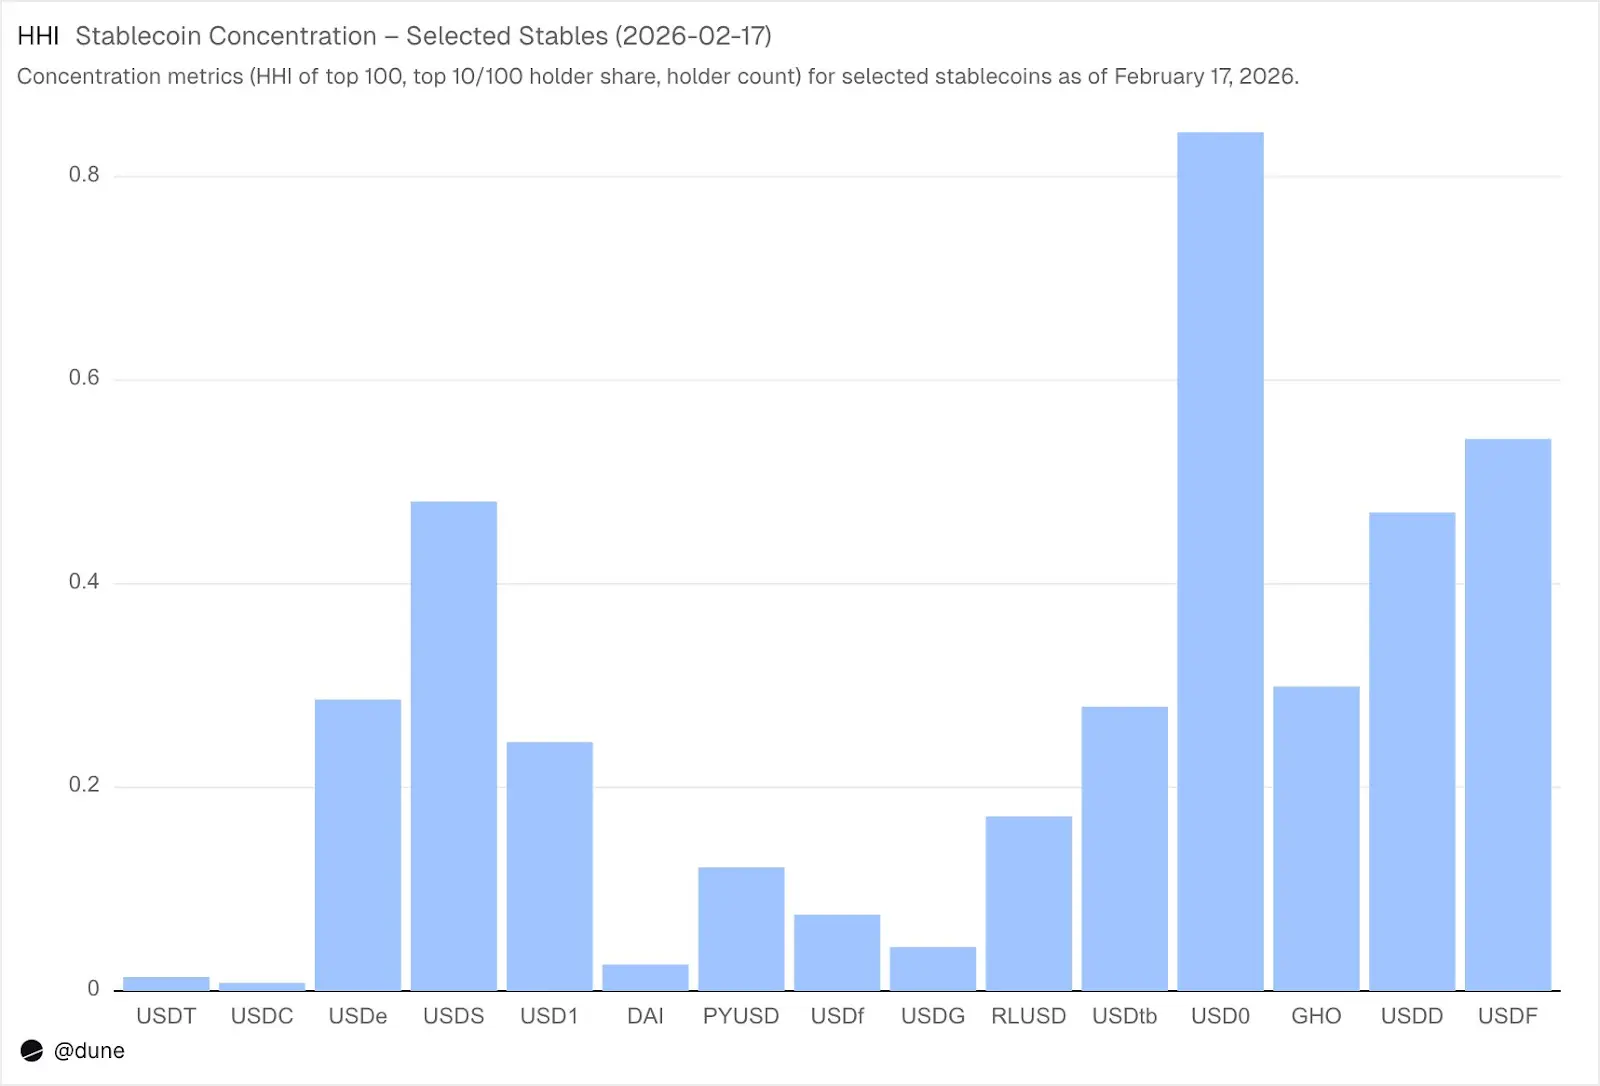
However, other stablecoins are quite different. The top 10 wallets hold 60-99% of the supply. USDS, despite a circulation of $6.9 billion, is 90% concentrated in 10 wallets (HHI 0.48); USDF 99% in the top 10 (HHI 0.54); USD0 is the most extreme, with 99% in the top 10 (HHI 0.84), meaning even among large holders, the supply is dominated by one or two wallets.
Source: Dune
This does not necessarily mean these stablecoins are problematic—some are newer, some are intentionally concentrated by institutions. But it does mean their supply data should be treated differently from USDT or USDC. Concentration affects de-pegging risk, liquidity depth, and whether supply reflects natural demand or demand from a few large participants. Only by knowing all holders’ balances, not just mint/burn events, can such analysis be performed.
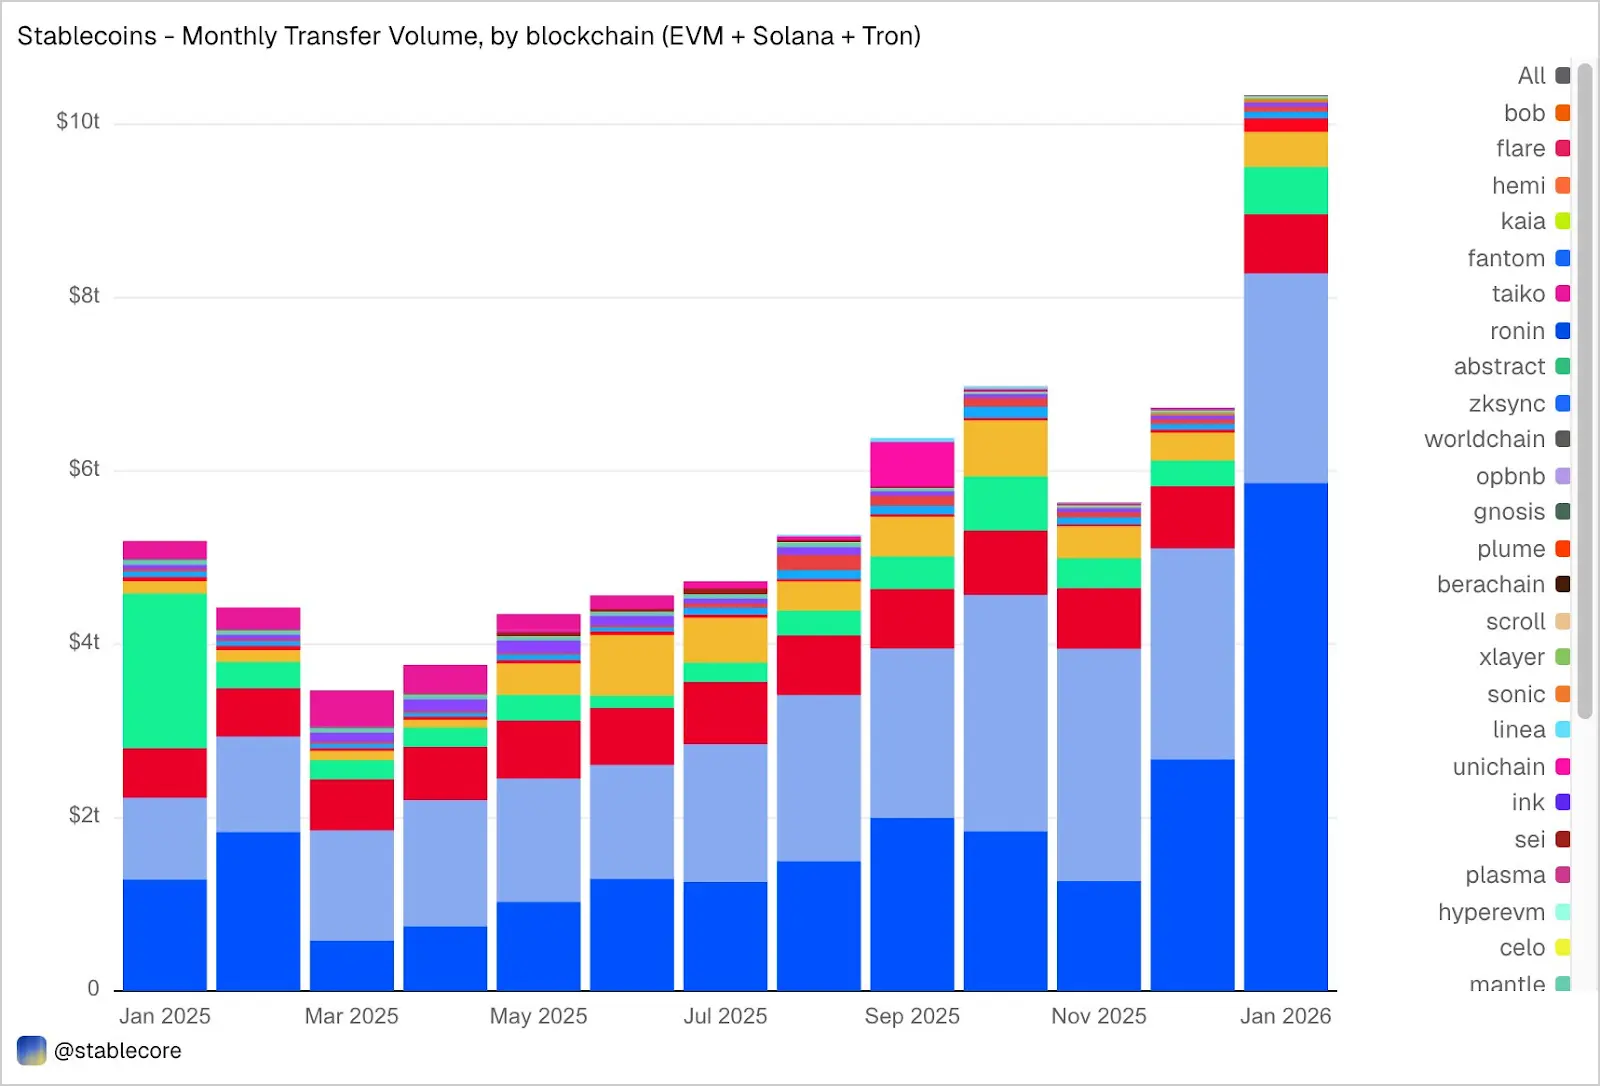
$10.3 Trillion in Transfers in January
In January, stablecoin transfer volume on EVM, Solana, and Tron reached $10.3 trillion, more than double January 2025. The distribution of on-chain transaction volume is notable and differs sharply from supply share: Base’s supply is only $4.4 billion, yet it led with $5.9 trillion in transactions; Ethereum $2.4 trillion; Tron $682 billion; Solana $544 billion; BNB Chain $406 billion.
Source: Dune
By token, USDC dominates with $8.3 trillion, nearly five times USDT’s $1.7 trillion, despite its supply being only 2.7 times smaller. USDC’s transfer speed and frequency are clearly much higher than USDT. DAI’s volume is $138 billion, USDS $92 billion, USD1 $43 billion.
Importantly, these data are objective and neutral. The dataset does not pre-filter transfers based on fixed interpretations of “real” economic activity, so totals may include flows related to arbitrage, bots, internal routing, or other automation. Our goal is to present an objective full picture of on-chain activity, allowing users to apply their own filters—such as removing bot-driven transactions, separating natural usage, or defining more realistic activity metrics.
What Are Stablecoins Really Doing?
The dataset’s transfer data is not only labeled as “volume” but also classified into specific on-chain activities:
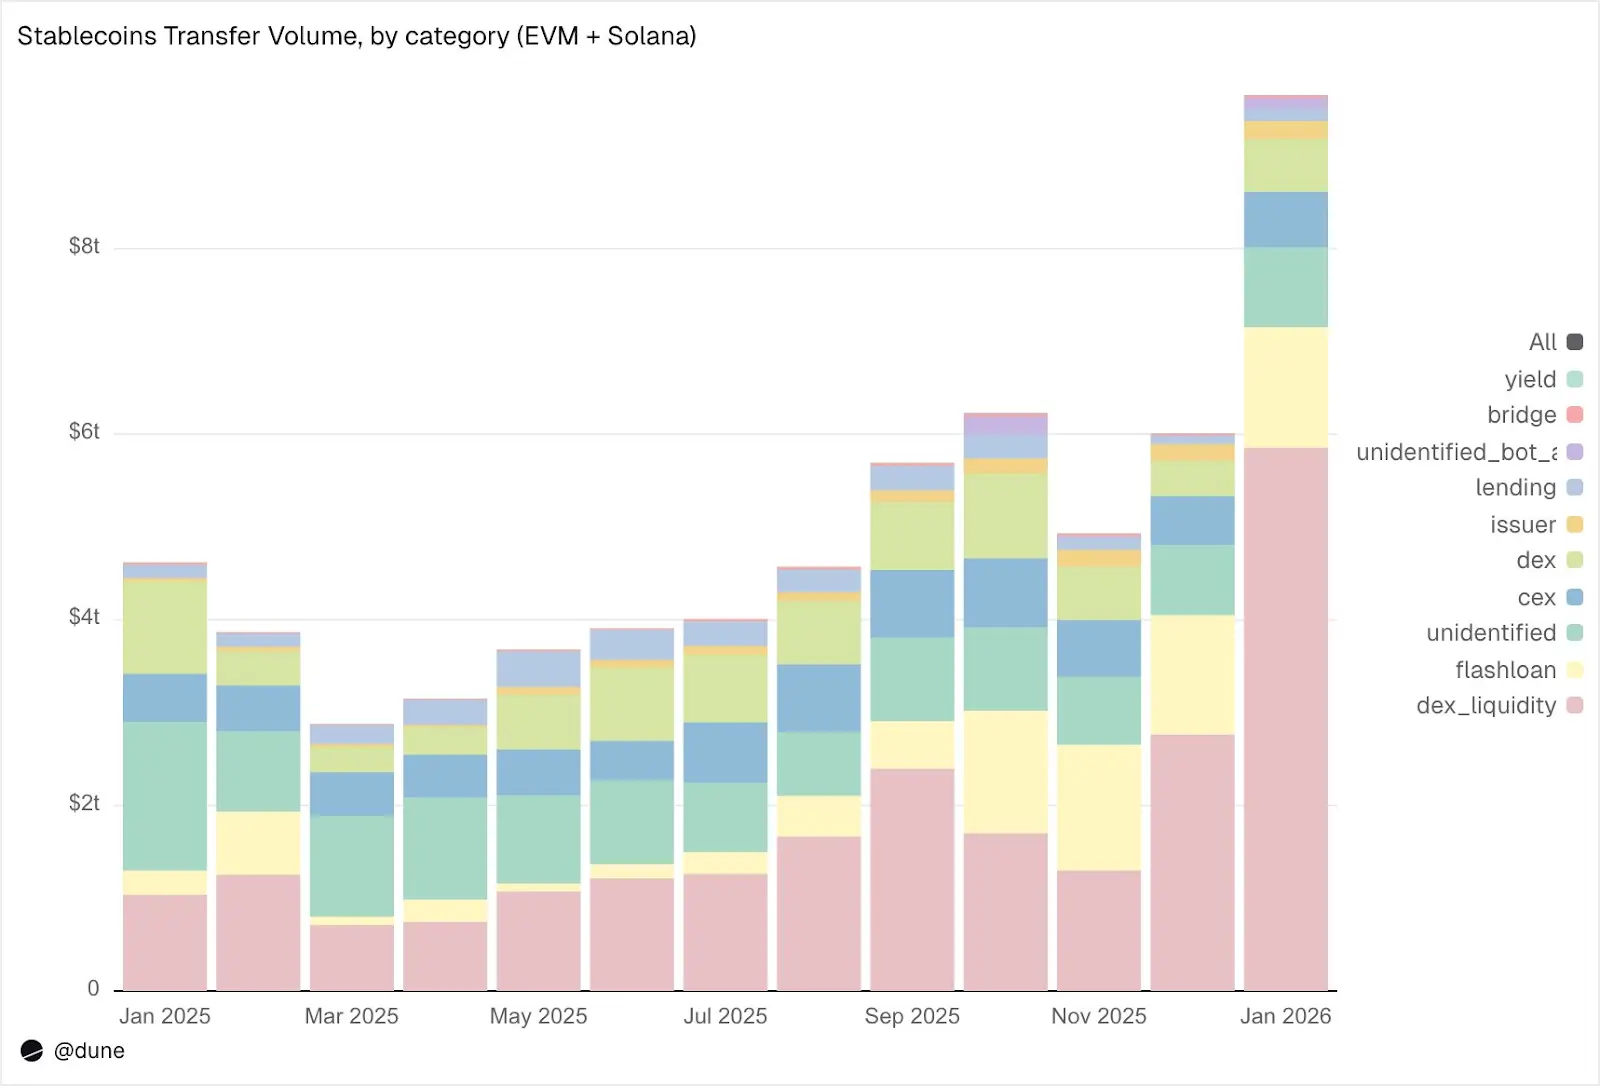
January breakdown:
1. Market Infrastructure (DEX trading and liquidity):
DEX liquidity provision and extraction: $5.9 trillion. This is the largest single use case, reflecting stablecoins’ role as on-chain market-making assets.
DEX swaps: $376 billion. Direct trading activity via automated market makers.
Together, these indicate stablecoins mainly serve as trading collateral and liquidity infrastructure. Notably, trading volume is concentrated in incentive-driven activities (like yield farming and active capital optimization), rather than pure trading demand.
2. Leverage and Capital Efficiency (Lending + Flash Loans):
Flash loans (borrowing and repayment): $1.3 trillion. Automated arbitrage and liquidation cycles.
Lending activities: supply, borrow, repay, withdraw totaling $137 billion. Reflecting short-term capital efficiency and structured credit on-chain.
3. Access Channels (CEX and bridging):
CEX flows: deposits ($224 billion), withdrawals ($224 billion), internal transfers ($151 billion), totaling $599 billion.
Cross-chain bridge deposits and withdrawals: $28 billion. These flows show stablecoins’ role in CEXs and cross-chain settlement.
4. Issuance Operations (Minting and Burning):
Issuer activities: minting ($28 billion), burning ($20 billion), de-pegging adjustments ($23 billion), other activities, totaling $106 billion—almost five times last year’s $42 billion.
5. Yield Protocols
Yield protocol activity: $2.7 billion. A smaller but structurally important part, closely related to structured strategies and on-chain asset management.
Overall, 90% of transfer volume flows through recognized activity categories, providing detailed insights into stablecoin movement across each layer of the on-chain tech stack.
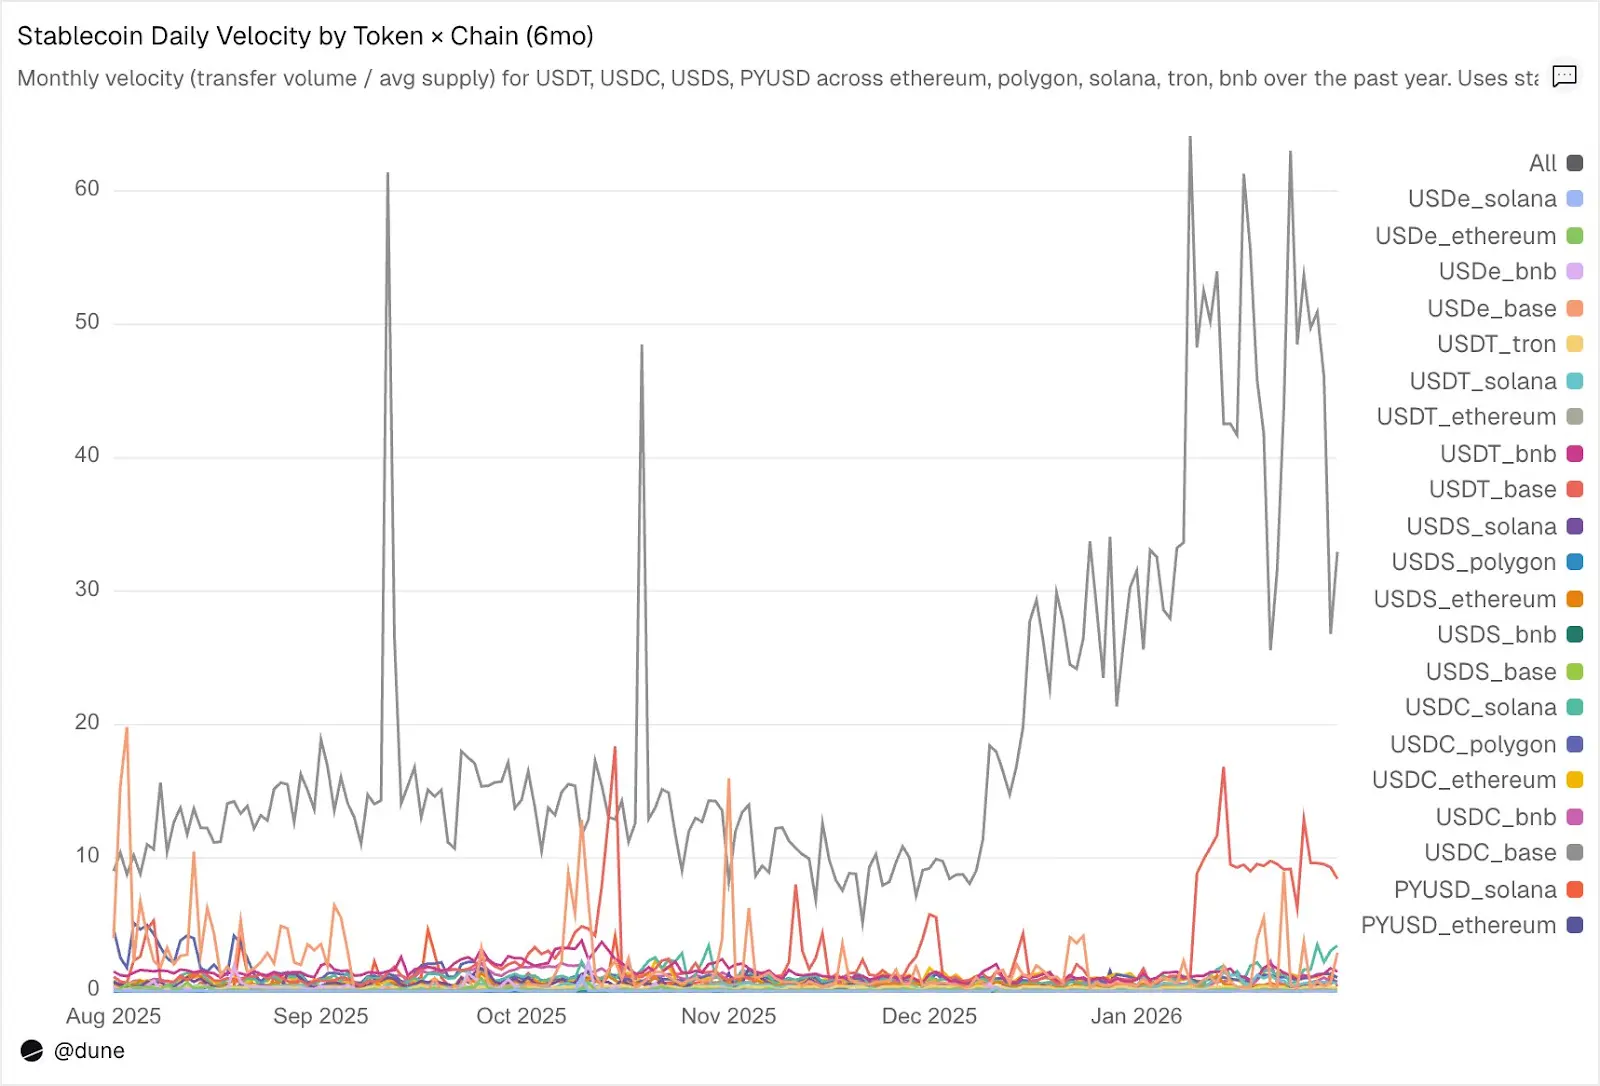
Circulation Speed: Different Worlds for the Same Token
Daily turnover rate (transfer volume divided by supply) may be the most underestimated metric in stablecoin analysis. It reflects activity as a medium of exchange, not just holdings.
Among the tokens analyzed, USDC and USDT stand out again, despite differences.
Source: Dune
USDC on Layer 2 and Solana has the fastest circulation speed. On Base, USDC’s daily average circulation speed reaches 14x, mainly driven by high-frequency DeFi trading activity. On Solana and Polygon, about 1x; on Ethereum, 0.9x—almost all supply is traded daily.
USDT is fastest on BNB and Tron. On BNB Chain, daily speed is 1.4x, reflecting active trading; on Tron, 0.3x, with lower but stable volume, consistent with its role as a cross-border payment channel. On Ethereum, USDT’s daily speed is only 0.2x, with most of the $1 trillion+ supply idle.
USDe and USDS have slower speeds, intentionally. USDe on Ethereum has a daily speed of only 0.09x, USDS about 0.5x. Both are designed as yield-bearing stablecoins: USDe is often staked in sUSDe to capture Ethena’s delta-neutral strategy yields; USDS is deposited into Sky Savings Rate for protocol-sponsored returns. Much of their supply remains idle in savings contracts, Aave, or structured yield cycles. Low circulation speed is not a disadvantage but an advantage: these assets are designed to accumulate yield, not to circulate.
Chain matters more than tokens. PYUSD on Solana has a daily speed of 0.6x, four times Ethereum’s 0.1x. The same token can have very different usage patterns across ecosystems.
Supply and volume reflect parts of the picture. Circulation speed links the two, measuring whether stablecoins on a specific chain operate as active infrastructure or idle funds.
Beyond the Dollar
This analysis focuses on 15 USD stablecoins, but the full dataset covers more. It tracks over 200 stablecoins representing more than 20 currencies: Euro (17 tokens, $990 million), Brazilian Real ($1.41 million), Japanese Yen ($13 million), and tokens denominated in Nigerian Naira, Kenyan Shilling, South African Rand, Turkish Lira, Indonesian Rupiah, Singapore Dollar, among others.
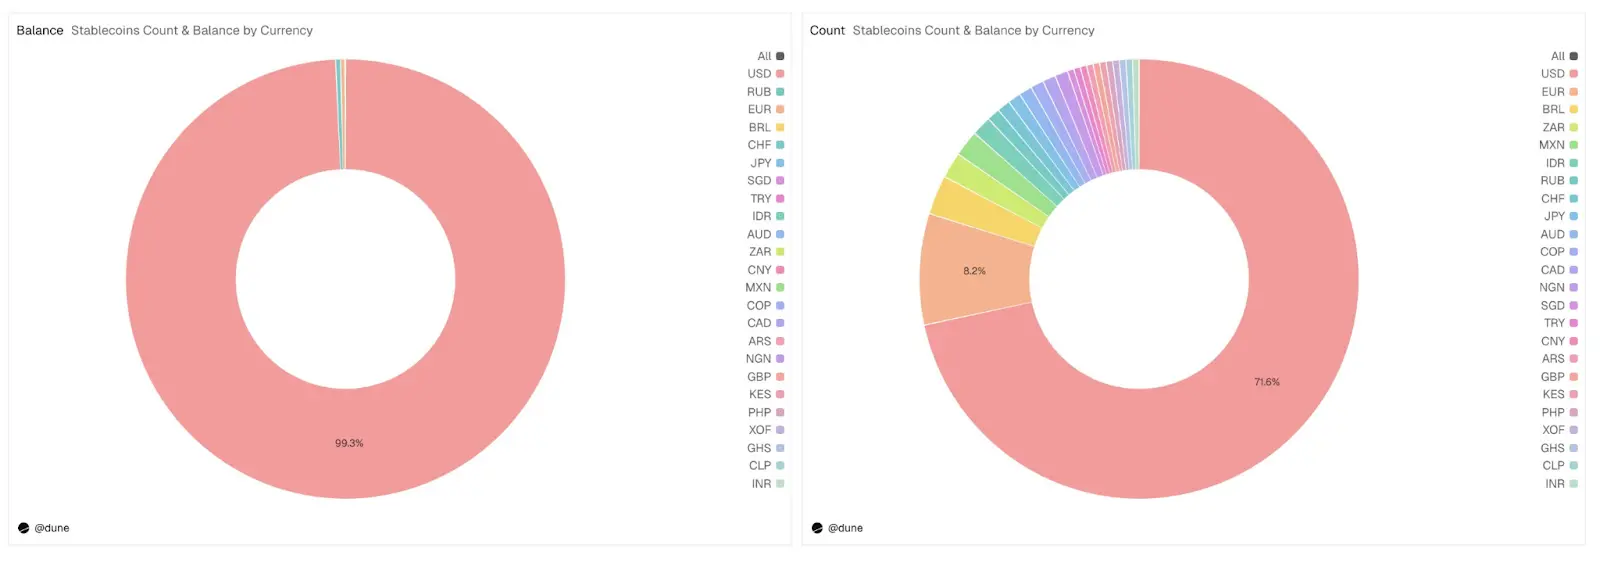
Source: Dune
Non-USD stablecoins currently total only $1.2 billion, but 59 tokens are spread across six continents, accounting for nearly 30% of the total tokens in the dataset. Infrastructure for local currency stablecoins is being built on-chain, and data tracking their development is ready.