
Hedera is starting to catch attention again. The HBAR price is up 8.12% in the last 24 hours, trading around $0.103, and it’s moving a lot faster than the rest of the market. Bitcoin only gained about 1.6%, so this isn’t just a general bounce, HBAR is showing its own strength right now.
A big part of this move comes from money rotating back into altcoins. The CMC Altcoin Season Index jumped more than 20% recently, and Hedera is clearly benefiting from that shift. What really makes the move stand out is volume. Trading activity has jumped over 90% to $223.5 million, which tells us buyers are stepping in with real conviction.
- HBAR Price Is Running Into a Major Resistance Zone
- Why a Breakout Could Trigger a 50% Rally
- The Bottom Line for the HBAR Price
HBAR Price Is Running Into a Major Resistance Zone
A chart shared by World Of Charts indicates what traders are watching closely: HBAR is testing a crucial resistance level, and a breakout could open the door for a much larger rally.
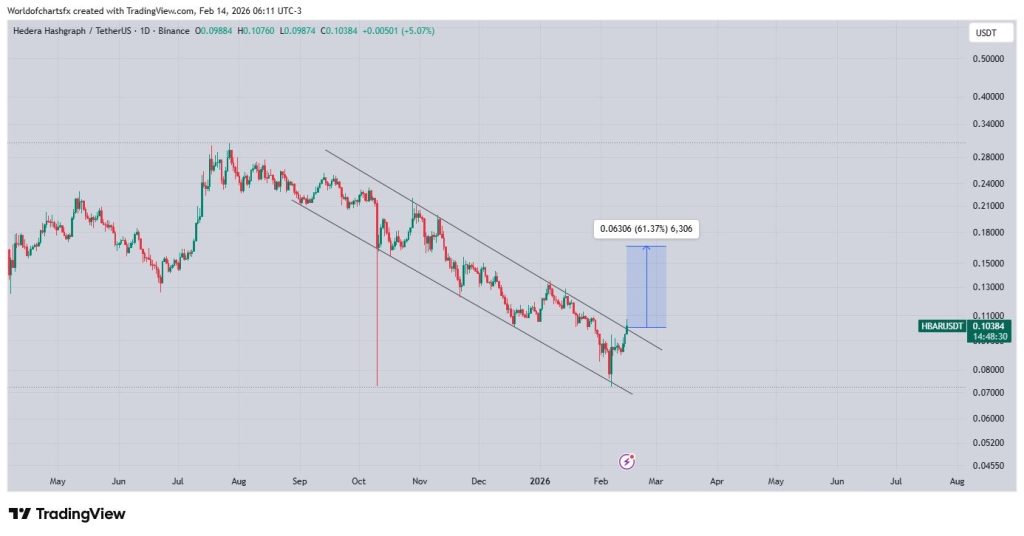
Source: X/@WorldOfCharts1
The setup is pretty clear. Hedera has been stuck in a long-term downtrend, held down by a series of lower highs. This downtrend has dominated the market from late 2025 into early 2026.
But a new attitude is emerging. HBAR has broken out from the lower boundary of this downtrend channel and is moving up to meet the upper resistance line, a line that has stopped all rallies during this downtrend.
Why a Breakout Could Trigger a 50% Rally
The chart points to a possible upside move of around 50% if HBAR can break above this channel resistance and actually hold. From current levels near $0.103, that would put the next major target closer to the $0.16 zone.
That level isn’t random either. It lines up with an older price area from late 2025, where HBAR spent time consolidating before the bigger drop happened.
If the downtrend breaks, price often snaps back into those previous zones quickly. And unlike some fake breakouts, this one has volume behind it, which gives the move more weight.
Why Hedera (HBAR) Could Overtake XRP in the Race for Global Finance_**
The Bottom Line for the HBAR Price
Right now, $0.095 is the key support level. As long as the HBAR price stays above that area, bulls still have control of the structure.
The immediate resistance is around $0.105, which lines up with the top of the channel. A clean daily close above that would be the strongest signal yet that Hedera is finally breaking out of this downtrend. If it fails here, a pullback toward $0.088 wouldn’t be surprising, since that’s where buyers defended the last major dip.
Hedera is showing real signs of waking up. The HBAR price is outperforming the market, volume is exploding higher, and the chart is sitting right at the most important resistance level it has faced in months.
If this altcoin rotation continues and HBAR confirms the breakout above $0.105, the setup for a 50% upside move becomes very real. Now it’s all about whether bulls can push through and hold that level in the days ahead.
Disclaimer: The information on this page may come from third parties and does not represent the views or opinions of Gate. The content displayed on this page is for reference only and does not constitute any financial, investment, or legal advice. Gate does not guarantee the accuracy or completeness of the information and shall not be liable for any losses arising from the use of this information. Virtual asset investments carry high risks and are subject to significant price volatility. You may lose all of your invested principal. Please fully understand the relevant risks and make prudent decisions based on your own financial situation and risk tolerance. For details, please refer to
Disclaimer.
Related Articles
XRP Faces Pressure as Network Usage and Momentum Decline
Key Insights
XRP Ledger transactions and active accounts dropped sharply, signaling reduced usage and weakening demand that directly impacts the asset’s broader market outlook.
Price continues to face resistance at key technical levels, while compression below moving averages reflects
CryptoNewsLand39m ago
Solana Price Holds Near $80 as Analysts Split on Next Move
Key Insights:
Solana trades near $80 under pressure, with persistent lower highs and weak recovery attempts reinforcing a clear short-term bearish market structure.
Analysts identify the $75 to $45 range as a key accumulation zone, supported by historical demand levels and long-term
CryptoNewsLand49m ago
ETH drops 0.67% in 15 minutes: short-term profit-taking triggers a pullback
During the period from 2026-03-30 19:00 to 19:15 (UTC), the ETH spot return recorded -0.67%, with a price range of 2014.67 to 2032.63 USDT and a volatility amplitude of 0.88%. Trading in the market during this time window was active, with significant short-term fluctuations, drawing investor attention. Market data shows that, compared with the previous trading day, trading volume expanded in parallel, indicating that more capital battles were being concentrated and released in the short term. The main driving force behind this abnormal move was the proactive selling by short-term profit-taking positions and the concentrated execution of certain large sell orders. Intraday market action originally continued the prior uptrend, but then it was interrupted by this sudden fluctuation, leading to increased volatility and a shift in market sentiment.
GateNews1h ago
Bitcoin ETF Investors in Red Amid Price Decline
Bitcoin ETF holders are facing an average loss of 10% as the price of Bitcoin remains below its realized price. This downturn reflects a broader decline in the spot price and raises concerns about market pressure and future trends.
BlockChainReporter1h ago
Shiba Inu Holds Range While Rising Reserves Signal Growing Sell Pressure
Shiba Inu's massive -1,813% spot flow change reflects low baseline distortion rather than actual capital flight, with exchange reserves increasing and modest market activity, indicating steady sell-side pressure but limited momentum.
CryptoFrontNews1h ago
Dogecoin Holds Key Support as 23% YTD Drop Deepens
Key Insights:
Dogecoin has declined over 23% year to date, with broader macroeconomic pressure and weak crypto sentiment driving sustained selling across major digital assets.
The $0.07 to $0.08 range remains a historically strong support zone, previously triggering sharp recoveries and
CryptoNewsLand1h ago
