
Key Takeaways
-
OriginTrail (TRAC) has surged around 12% in a single day, drawing renewed attention to the token.
-
TRAC has broken out from an ascending triangle near $0.46 on the daily chart, signaling growing bullish momentum.
-
Similar breakout structures in July and October 2025 previously led to strong rallies of 63% and 113%.
-
Holding the $0.44–$0.46 zone as support will be crucial to keep the bullish fractal setup intact.
-
If the pattern plays out, TRAC could attempt a move toward its long-term ascending resistance above $1.00.
OriginTrail, the decentralized knowledge graph protocol, is stepping back into the spotlight as its native token TRAC records a strong 12% daily surge. Beyond the price jump, the real signal is coming from the charts, where a familiar fractal breakout structure is starting to emerge on the daily timeframe, hinting that a larger upside move could be forming.
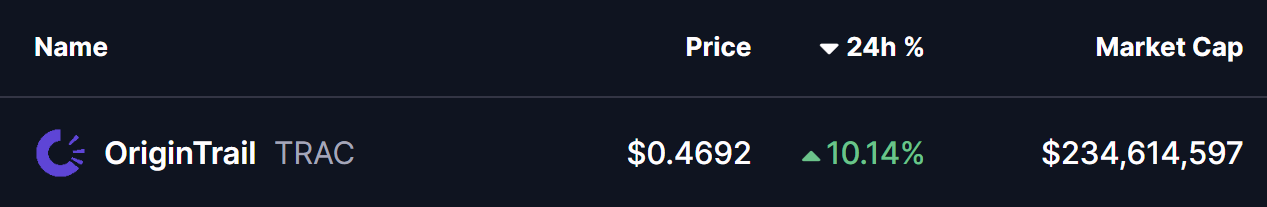
Source: Coinmarketcap
Fractal Breakout Hints at Potential Upside Move
On the daily chart, TRAC has confirmed a breakout from an ascending triangle pattern near the $0.46 level. This breakout is particularly important as price is now trading just above the 200-day moving average, a level that has historically acted as a major trend-defining zone for TRAC.
What makes this setup more compelling is its similarity to previous breakout phases. In late July 2025, a comparable structure resulted in a 63% upside move after price held above its breakout base. Later, in early October 2025, TRAC broke out from a right-angled descending broadening wedge pattern. That move was followed by a reclaim of the 200-day moving average and ultimately led to a powerful 113% rally.
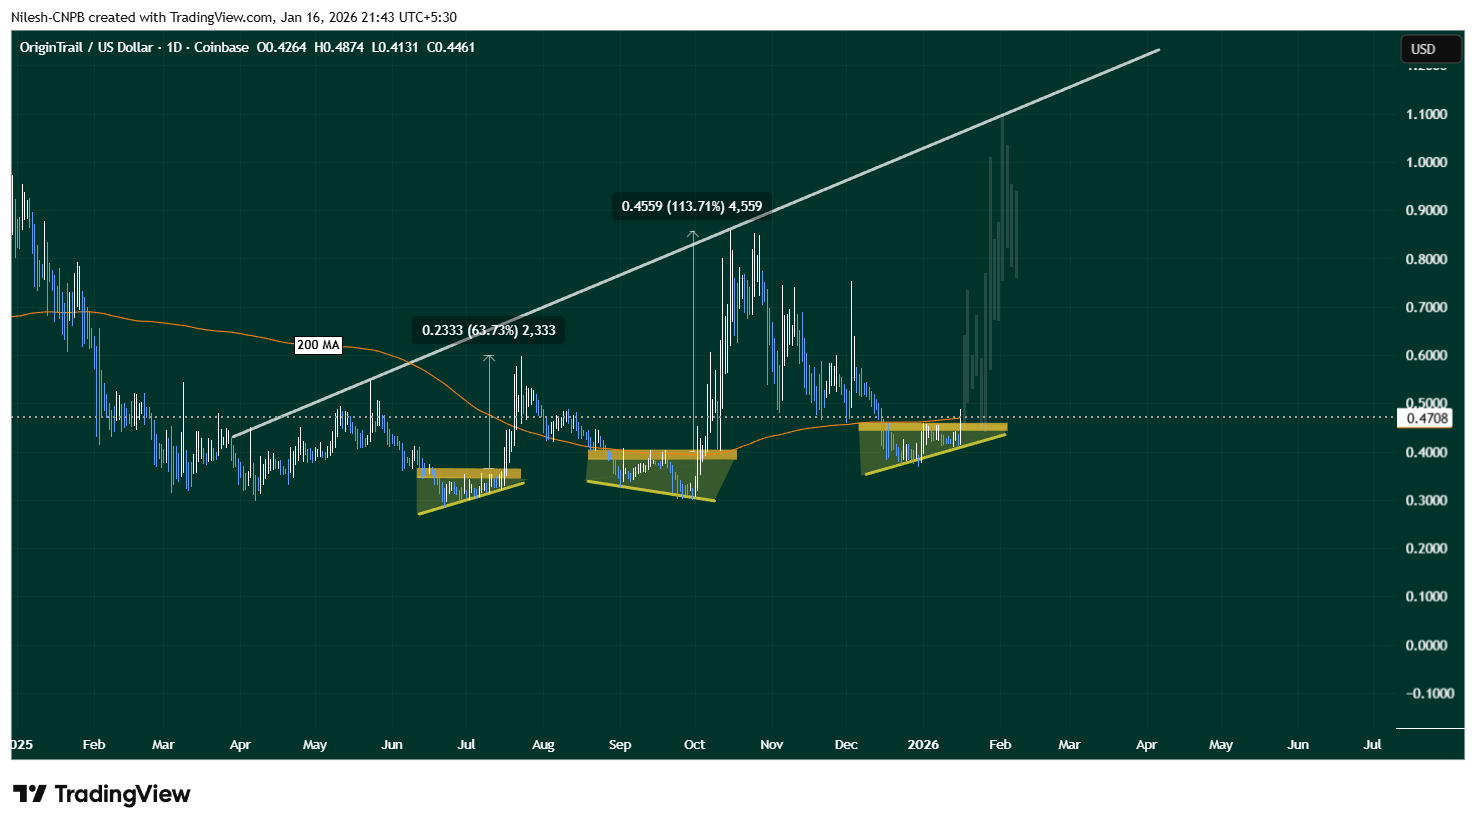
OriginTrail (TRAC) Daily Chart/Coinsprobe (Source: Tradingview)
The current setup shares key characteristics with those earlier moves. Price compression, a clean breakout, and interaction with the 200-day MA suggest that TRAC may once again be transitioning from consolidation into expansion.
What’s Next for TRAC?
If this fractal breakout plays out as expected, holding the $0.44–$0.46 zone as support will be crucial. A sustained hold above this range, along with continued strength above the 200-day moving average, could act as a launchpad for further upside.
In that scenario, TRAC may attempt a move toward its long-term ascending resistance trendline, which currently sits above the $1.00 level. A push toward that zone would align closely with the magnitude of prior fractal-driven rallies seen on the chart.
That said, fractal patterns are never guarantees. Broader market conditions, liquidity, and overall sentiment will continue to influence price action. A failure to hold the $0.44–$0.46 support zone or a rejection back below the 200-day moving average could invalidate the breakout and weaken the bullish fractal thesis.
Bottom Line
TRAC is showing early signs of another technically significant breakout, supported by historical fractal behavior and a reclaim of a key long-term moving average. If buyers can defend the current support zone, the chart suggests that OriginTrail may be positioning itself for a larger upside move in the weeks ahead.
Disclaimer: The views and analysis presented in this article are for informational purposes only and reflect the author’s perspective, not financial advice. Technical patterns and indicators discussed are subject to market volatility and may or may not yield the anticipated results. Investors are advised to exercise caution, conduct independent research, and make decisions aligned with their individual risk tolerance.
About Author: Nilesh Hembade is the Founder and Lead Author of Coinsprobe, with over 5 years of experience in the cryptocurrency and blockchain industry. Since launching Coinsprobe in 2023, he has been providing daily, research-driven insights through in-depth market analysis, on-chain data, and technical research.
Disclaimer: The information on this page may come from third parties and does not represent the views or opinions of Gate. The content displayed on this page is for reference only and does not constitute any financial, investment, or legal advice. Gate does not guarantee the accuracy or completeness of the information and shall not be liable for any losses arising from the use of this information. Virtual asset investments carry high risks and are subject to significant price volatility. You may lose all of your invested principal. Please fully understand the relevant risks and make prudent decisions based on your own financial situation and risk tolerance. For details, please refer to
Disclaimer.
Related Articles
Iran–U.S. war ceasefire for 2 weeks! Bitcoin surges to 72k, TSMC jumps sharply—but we still can’t be too optimistic
Pakistan helped broker a two-week ceasefire agreement between the U.S. and Iran, easing market tensions, leading Bitcoin’s price to break above $72,000 and triggering liquidations of approximately $600 million in cryptocurrency futures. Oil prices plunged 13%, and traditional financial markets also rebounded on expectations of peace. Although the market has risen temporarily, it still needs to watch the progress of negotiations over the next two weeks, because the core issues have not been resolved and future volatility risk remains.
CryptoCity5m ago
New 6-week high! Bitcoin ETFs pulled in $470 million, analysts say: a breakout setup is brewing
U.S. spot Bitcoin ETFs pulled in $471 million on Monday, setting a six-week high, indicating that institutional investor confidence is rebounding. Despite the strong inflows, geopolitical and economic uncertainties may still affect the uptrend. Analysts say that if key macroeconomic variables improve, the crypto market could see upward momentum again.
CryptoCity6m ago
Altcoin Momentum Builds as EDGE, VVV, and ALGO Turn Bullish
EDGE surged 86%, consolidating above $0.90, with upside toward $1.50 if momentum continues.
VVV forms a bull flag near $7.2, breakout could push price toward $10–$12.
ALGO gained 48%, confirming trend reversal, next resistance sits between $0.20 and $0.23.
Altcoin activity continues to p
CryptoNewsLand13m ago
JPMorgan: Digital asset inflows of $11 billion in Q1 2026, with Strategy as the primary buyer
A JPMorgan report shows that in Q1 2026, digital-asset inflows were about $11 billion, mainly coming from Bitcoin purchases. The overall crypto market is down 20%; positions in CME futures for Bitcoin and ETH have weakened, with capital concentrating into a small number of large exchanges, suggesting that investors are cautious.
GateNews1h ago
Cardano Prints Bullish Double Bottom Pattern, $5 ADA ATH Expected as Most Altcoin Charts Remain Strong
Cardano prints bullish double bottom pattern.
$5 ADA ATH price could be hit this year.
Most altcoin price charts remain strong, signaling bull pumps ahead.
The crypto community continues to watch several altocin price charts to mange their expectations for a bullish altseason peak
CryptoNewsLand2h ago
Analyst Says the Lower XRP Goes the More Bullish the Breakout as Experts Remain Unsure About XRP Recovery
Analyst says the lower XRP goes the more bullish the breakout.
Other experts remain unsure about an XRP recovery.
Can the price of XRP set a new ATH this year?
The crypto market sees renewed hope and improved anticipation of a bullish recovery rally as the price of BTC just reclaimed pri
CryptoNewsLand3h ago
