
**Date: **Wed, Jan 07, 2026 | 05:26 AM GMT
The broader cryptocurrency market continues to show strong New Year momentum, with Bitcoin (BTC) up around 5% and Ethereum (ETH) posting gains of more than 9% on a weekly basis. While several altcoins have already accelerated higher, the privacy-focused cryptocurrency** Monero (XMR)** has moved at a more measured pace.
That said, XMR’s recent price behavior on the daily chart tells a more constructive story. Despite relatively modest weekly gains, the structure suggests that Monero is undergoing a healthy bullish retest — often a critical phase before the next leg higher.
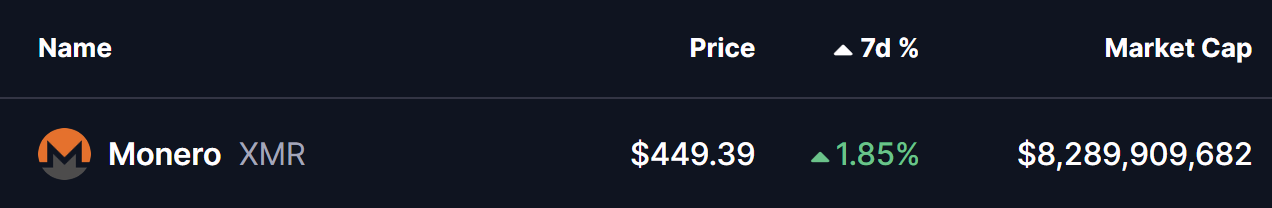
Source: Coinmarketcap
Retested Cup and Handle Breakout
On the daily timeframe, XMR had been consolidating within a well-defined Cup and Handle formation, a classic bullish continuation pattern that typically forms after an extended accumulation phase.
The pattern resolved to the upside when buyers decisively pushed price above the $412–$420 neckline resistance. This breakout sparked a sharp rally of nearly 20%, sending XMR to a local high around $498.30 and confirming a clear shift in market structure toward bullish control
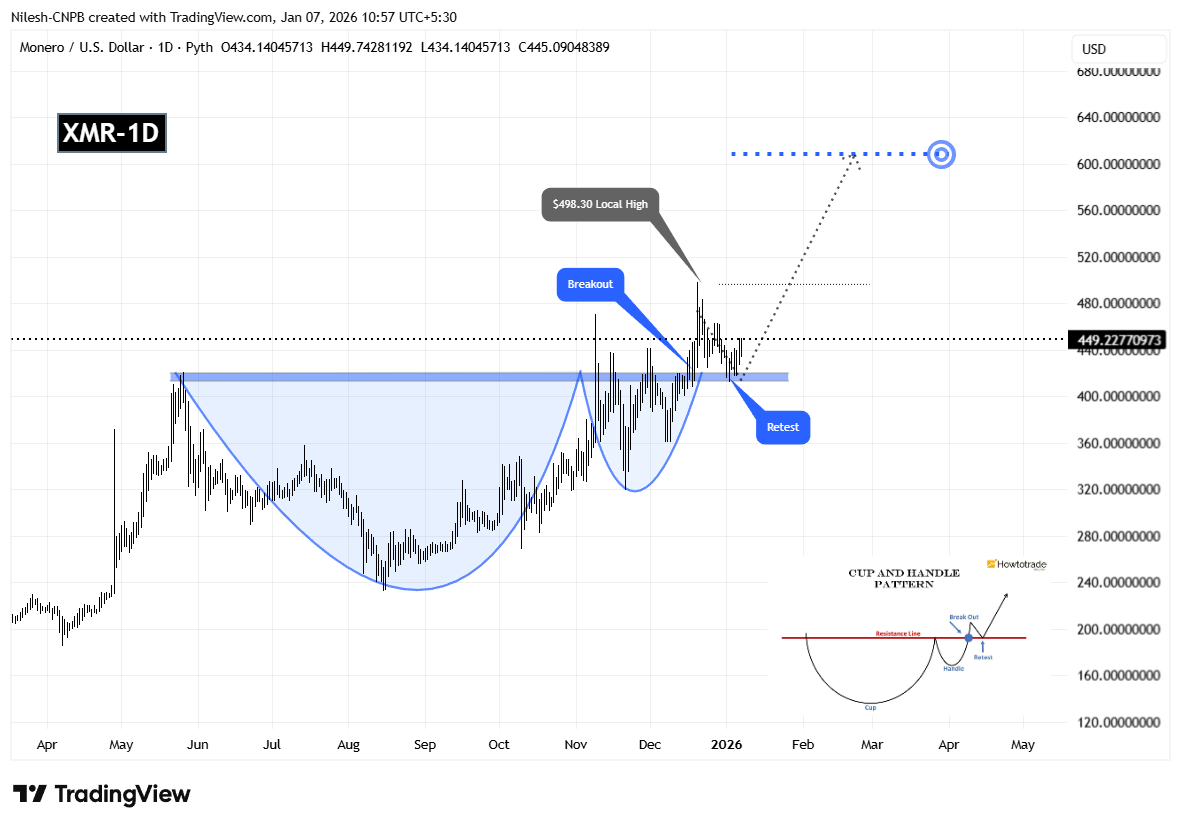
Monero (XMR) Daily Chart/Coinsprobe (Source: Tradingview)
As expected after such a strong breakout, price then pulled back to retest the former resistance zone. XMR dipped back into the $412–$420 area, allowing the market to validate this region as new support. This retest has so far been successful, with price rebounding and currently trading near the $449 level. The ability to hold above the breakout zone reinforces the strength of the underlying trend and suggests growing acceptance at higher prices.
What’s Next for XMR?
As long as buyers continue to defend the $412–$420 support area, the broader bullish structure remains firmly intact. A sustained move back above the recent swing high near $498 would likely signal renewed upside momentum and open the door for continuation of the breakout trend.
Based on the depth of the cup formation, the technical upside projection points toward the $608 region. Reaching this level would imply a potential upside of roughly 35% from current prices, consistent with the measured-move expectations of this pattern.
On the downside, a failure to hold the $412–$420 zone could temporarily slow bullish momentum and lead to additional consolidation. However, unless price slips back toward the lower portion of the cup, the broader structure would still remain constructive.
From a technical perspective, XMR’s current behavior reflects a textbook breakout-and-retest scenario. If market conditions remain supportive, this structure suggests Monero could be positioning itself for another meaningful move higher in the weeks ahead.
Disclaimer: The views and analysis presented in this article are for informational purposes only and reflect the author’s perspective, not financial advice. Technical patterns and indicators discussed are subject to market volatility and may or may not yield the anticipated results. Investors are advised to exercise caution, conduct independent research, and make decisions aligned with their individual risk tolerance.
About Author: Nilesh Hembade is the Founder and Lead Author of Coinsprobe, with over 5 years of experience in the cryptocurrency and blockchain industry. Since launching Coinsprobe in 2023, he has been providing daily, research-driven insights through in-depth market analysis, on-chain data, and technical research.
Disclaimer: The information on this page may come from third parties and does not represent the views or opinions of Gate. The content displayed on this page is for reference only and does not constitute any financial, investment, or legal advice. Gate does not guarantee the accuracy or completeness of the information and shall not be liable for any losses arising from the use of this information. Virtual asset investments carry high risks and are subject to significant price volatility. You may lose all of your invested principal. Please fully understand the relevant risks and make prudent decisions based on your own financial situation and risk tolerance. For details, please refer to
Disclaimer.
Related Articles
Why Aksel Kibar Believes Bitcoin Price Is Trap and This 'Rising Wedge' Signals Deeper Drop - U.Today
Analyst Aksel Kibar warns Bitcoin investors that the current price recovery is a technical trap within a downtrend. He identifies a "rising wedge" pattern and predicts potential declines to $60,000 or lower, advising caution against misinterpreting short-term fluctuations.
UToday45m ago
US Bitcoin Spot ETF Attracts Inflows for Seven Consecutive Days, Institutional Funds Return
U.S. cryptocurrency spot ETFs have recently seen a warming in capital inflows, particularly ahead of the Federal Reserve's interest rate decision, as investor interest in digital assets has rebounded. Bitcoin and Ethereum spot ETFs have recorded net inflows for multiple consecutive days, with Bitcoin attracting $199.4 million in a single day, marking a record of seven consecutive days of inflows. This phenomenon reflects increased institutional capital allocation, with market structure showing that investors are increasingly inclined to invest through regulated products, strengthening market support.
区块客1h ago
Bitcoin and Stocks Need to Confirm First: The Real Altcoin Recovery Timeline
The current crypto market continues to struggle without a clear altseason, as Bitcoin remains in a sideways trend. Analysts suggest that until Bitcoin shows a confirmed bullish structure and macroeconomic conditions improve, altcoins will likely remain stagnant. Speculation points to potential recovery in Q3 to Q4 rather than the earlier hoped-for timeline.
CaptainAltcoin1h ago
Bitcoin Decouples From S&P 500 as Retail Demand Weakens
Bitcoin retail activity has decreased by 10%, the lowest since January 2025, indicating weaker market participation. The advent of ETFs has shifted retail access off-chain, while Bitcoin has diverged from the S&P 500, marking its longest decoupling since 2020 amid a correction phase.
CryptoFrontNews1h ago
