BONK experienced a remarkable growth this week, with a price increase of approximately 46% over the past seven days—outperforming most other meme coins. However, price volatility has not fully reflected what is happening. Upon deeper analysis, it can be observed that the number of new users has surged, large wallets have been accumulating early, and the price structure still has room to continue upward. Nevertheless, the upward momentum may temporarily pause before continuing.
The key point is not the continuous daily price increase, but whether buying pressure can sustain after the initial breakout.
BONK User Activity Surges Alongside Price
An important indicator is the number of active addresses. This metric shows the number of unique wallets conducting BONK transactions each day. When this number increases, it usually indicates that more people are actively using or holding the token, rather than just engaging in short-term trading.
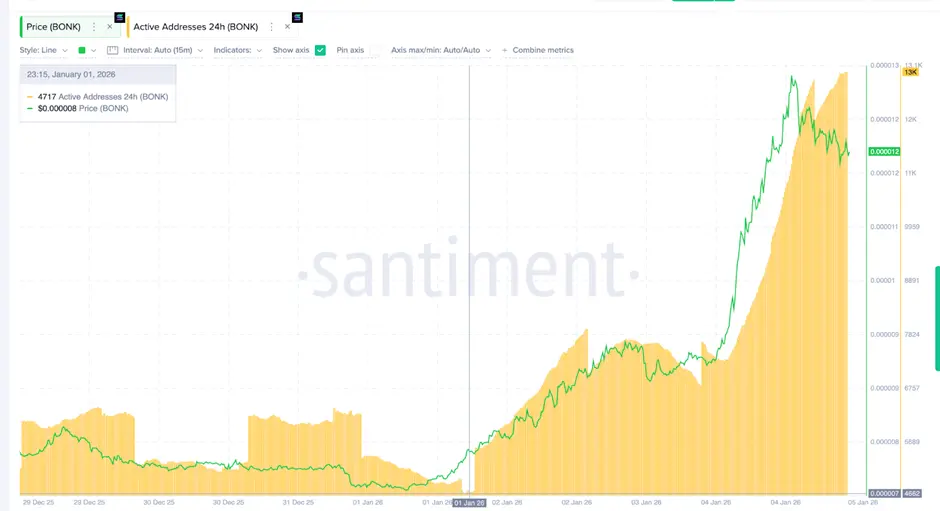 Active Addresses | Source: SantimentIn early January, BONK recorded around 4,700 active addresses. By January 5th, this number nearly tripled to nearly 13,000 addresses. This is an impressive growth in a short period.
The significance of this lies in the fact that many meme coin price rallies often fail when they only attract short-term traders. When wallet activity increases significantly like now, it indicates genuine and broader interest. Even if BONK’s price temporarily stalls, the increase in activity still supports a positive trend.
As of now, BONK’s usage has grown in tandem with its price, indicating a solid foundation for an upward trend.
Large Wallets Early Accumulation, Then Pausing
Another factor to observe is the behavior of “whales”—wallets holding large amounts of tokens. For BONK, this group includes wallets holding from 100 million BONK to 1 billion BONK.
Since December 31st, the total BONK held by these wallets increased from approximately 2.7227 trillion BONK to 2.7321 trillion BONK, adding about 9.41 billion BONK during the initial phase of the rally.
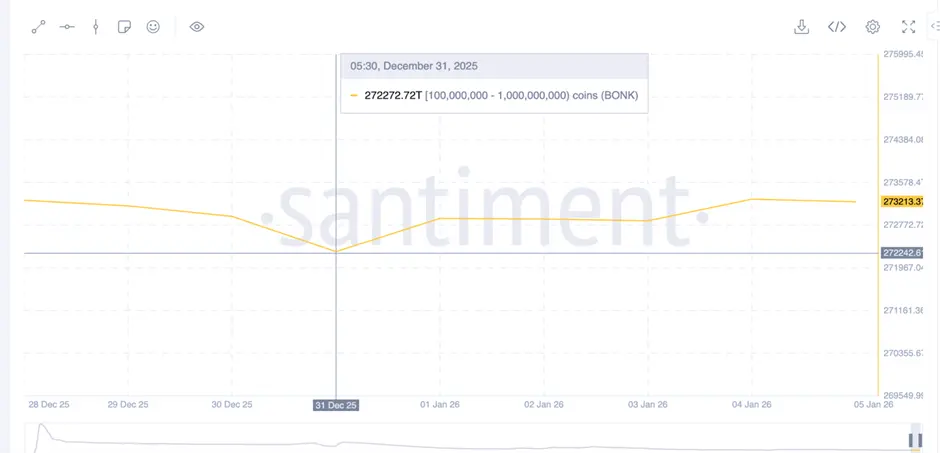 BONK Whales | Source: SantimentAfterward, the holdings of large wallets remained almost unchanged. This does not mean they sold, but simply that they stopped buying at higher prices.
This is a common strategy among large investors: buy early when prices are low, then observe as the market heats up. They often wait for stability before making their next move.
Currently, there are no clear signs of these large wallets divesting. They continue to hold the BONK they accumulated earlier.
BONK Price Structure Still Shows Growth Potential
The BONK price chart shows a strong rally followed by sideways movement, reflecting a pause among buyers after a breakout.
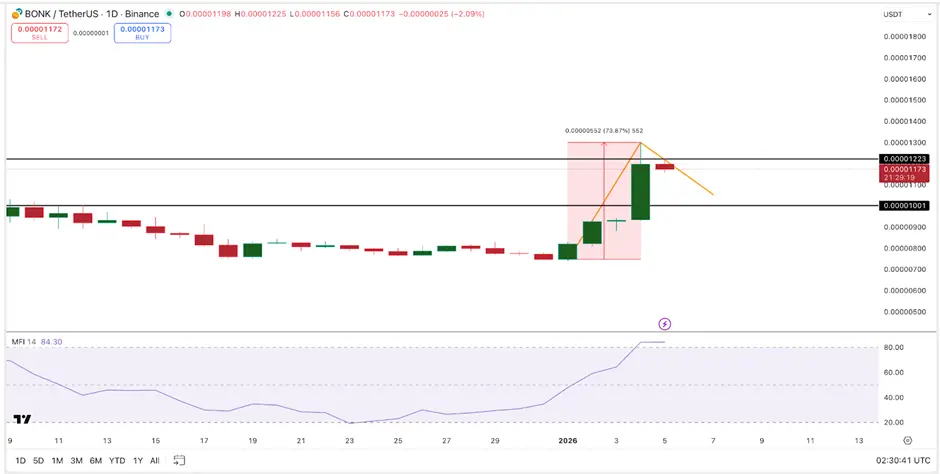 BONK Price Action | Source: TradingView As long as BONK stays above the $0.000010 level, this price structure remains intact. If the price breaks above $0.000012, it would signal that buying pressure continues to dominate. Conversely, if the price drops below $0.000010, the upward trend could reverse.
In terms of potential, the previous rally allows for an estimated growth of up to approximately 74%, if BONK continues its upward trend in the near future.
However, the (MFI) money flow index also indicates a possible correction. This index has entered overbought territory and has been sideways recently, signaling expectations of a price correction that could attract more buying interest at lower levels.
Some meme coin market analysts also point out an important confirmation threshold: if BONK surpasses $0.00001687, the next bullish trend could be triggered. Before reaching this level, minor corrections or sideways oscillations are considered normal.
For short-term support, the $0.00001069 zone is crucial and aligns with the TCR price chart. If BONK approaches this zone without dropping further, it is still viewed as a positive development after a strong rally.
Disclaimer: The information on this page may come from third parties and does not represent the views or opinions of Gate. The content displayed on this page is for reference only and does not constitute any financial, investment, or legal advice. Gate does not guarantee the accuracy or completeness of the information and shall not be liable for any losses arising from the use of this information. Virtual asset investments carry high risks and are subject to significant price volatility. You may lose all of your invested principal. Please fully understand the relevant risks and make prudent decisions based on your own financial situation and risk tolerance. For details, please refer to
Disclaimer.
Related Articles
Crypto Market Records Downturn As Fear Again Dominates Investor Sentiment
The crypto market has declined, with a total capitalization of $2.42T and a 24-hour volume drop of 6.08%. Bitcoin and Ethereum saw minor decreases, while notable gainers included $BPX and $PENGU. DeFi TVL fell by 1.56%, and NFT sales dropped 14.62%. Morgan Stanley updated its Bitcoin ETF filing, while Gemini faces a lawsuit for misleading investors.
BlockChainReporter4m ago
The Real Reason Bittensor (TAO) Price Just Pumped 30%
Bittensor's TAO surged 30% to $299, driven by endorsements from top figures like NVIDIA's Jensen Huang. Technical indicators suggest a bullish trend, eyeing resistance at $341, with strong market interest and trading volume signaling potential for ongoing recovery.
CaptainAltcoin9m ago
Bitcoin Briefly Falls Below $70,000 Mark During Asian Session as Fed Hawkishness and Macro Uncertainty Weigh on Market Volatility
Bitcoin fell below 70,000 on March 19, touching approximately 69,537, reflecting market concerns about the Federal Reserve maintaining high interest rates. Bitcoin subsequently rebounded to around 70,180, demonstrating psychological support at the 70,000 level. Despite improved market fund inflows, cryptocurrencies continue to face challenges amid global macroeconomic pressures, with 70,000 becoming a critical near-term level.
区块客39m ago
Pendle Price Challenges Inverted Flag Pattern Bottom Trendline, Technical Analysis Shows Downside Risk
Gate News reports that on March 20, Pendle token price is challenging the bottom trendline of an inverted flag pattern. Technical analysis shows that if this support level breaks, the price could fall back to the $1 level.
GateNews1h ago
Bitcoin Holds Strong at $70,000! On-Chain Data Reveals "Collective Selling Wave," Retail Investors Emerge as Biggest Selling Pressure
Against the backdrop of Middle East geopolitical tensions, Bitcoin has faced a comprehensive sell-off with nearly all coin holders turning to net selling, most notably among retail investors. According to Glassnode data, the cumulative trend score has dropped to 0.04, indicating heavy selling pressure in the market. Small-cap holders and mid-sized investors are showing significant selling intensity, while whales, though reducing their holdings, are doing so at a lower rate. Despite the dismal data, Bitcoin continues to demonstrate resilience against declines.
区块客1h ago
Bitcoin Price Trend Mirrors Late 2024 Decline Pattern, Traders Focus on Key Technical Levels
Bitcoin's current price movement is similar to the downtrend seen at the end of 2024, showing an upward tilt within narrow range fluctuations since February. Technical analysis indicates that a break below the lower band of 65,800 USD would form a key signal, while a breakthrough above could show different performance. Traders are closely monitoring this critical level.
GateNews1h ago
