Date: Thu, Dec 18, 2025 | 08:50 AM GMT
The broader cryptocurrency market has been experiencing choppy price action over the past several weeks, a phase that began after the sharp sell-off on October 10. That correction dragged** Ethereum (ETH) **down by nearly 22% over the last 60 days, keeping sustained pressure on major altcoins, including Polygon (POL).
POL has dropped more than 10% over the past week and is now down over 43% across the last 60 days. While the short-term trend remains clearly bearish, the higher-timeframe chart is beginning to reveal a technical structure that could be setting the stage for a potential rebound if key levels are reclaimed.
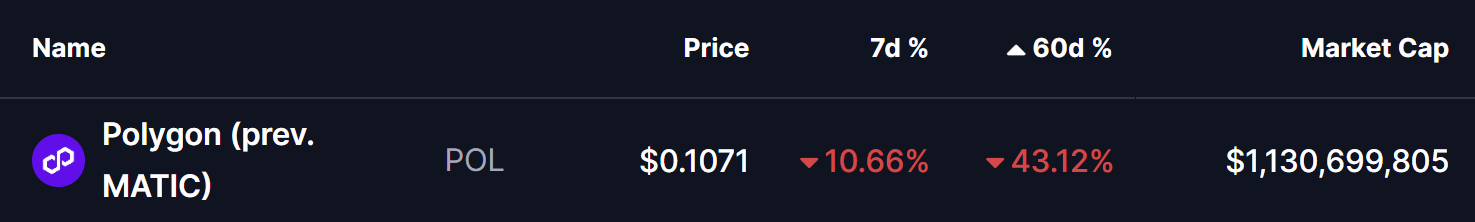
Source: Coinmarketcap
Power of 3 Pattern in Play?
On the weekly chart, POL appears to be forming a classic Power of 3 structure, a pattern often associated with market cycle lows and trend transitions. This setup typically unfolds in three phases — accumulation, manipulation, and expansion — with the most volatile move emerging once the final stage begins.
Accumulation Phase
Earlier in the year, POL spent an extended period consolidating within a well-defined range, capped by resistance near the $0.27 region and supported around the $0.15 zone. This sideways movement reflected an accumulation phase, where volatility compressed and price action became increasingly muted. Such conditions often suggest quiet positioning by larger market participants while broader interest fades and sentiment turns neutral to bearish.
This range-bound behavior laid the groundwork for the next phase of the structure, as liquidity built up on both sides of the market.
Manipulation Phase
During the latest market-wide downturn, POL broke decisively below the $0.15 accumulation support, sliding to a recent low near $0.107. This sharp breakdown, highlighted by the red-shaded area on the chart, aligns closely with the manipulation phase of the Power of 3 pattern. Moves like this are typically designed to trigger stop losses, force capitulation among weaker holders, and push sentiment to pessimistic extremes.
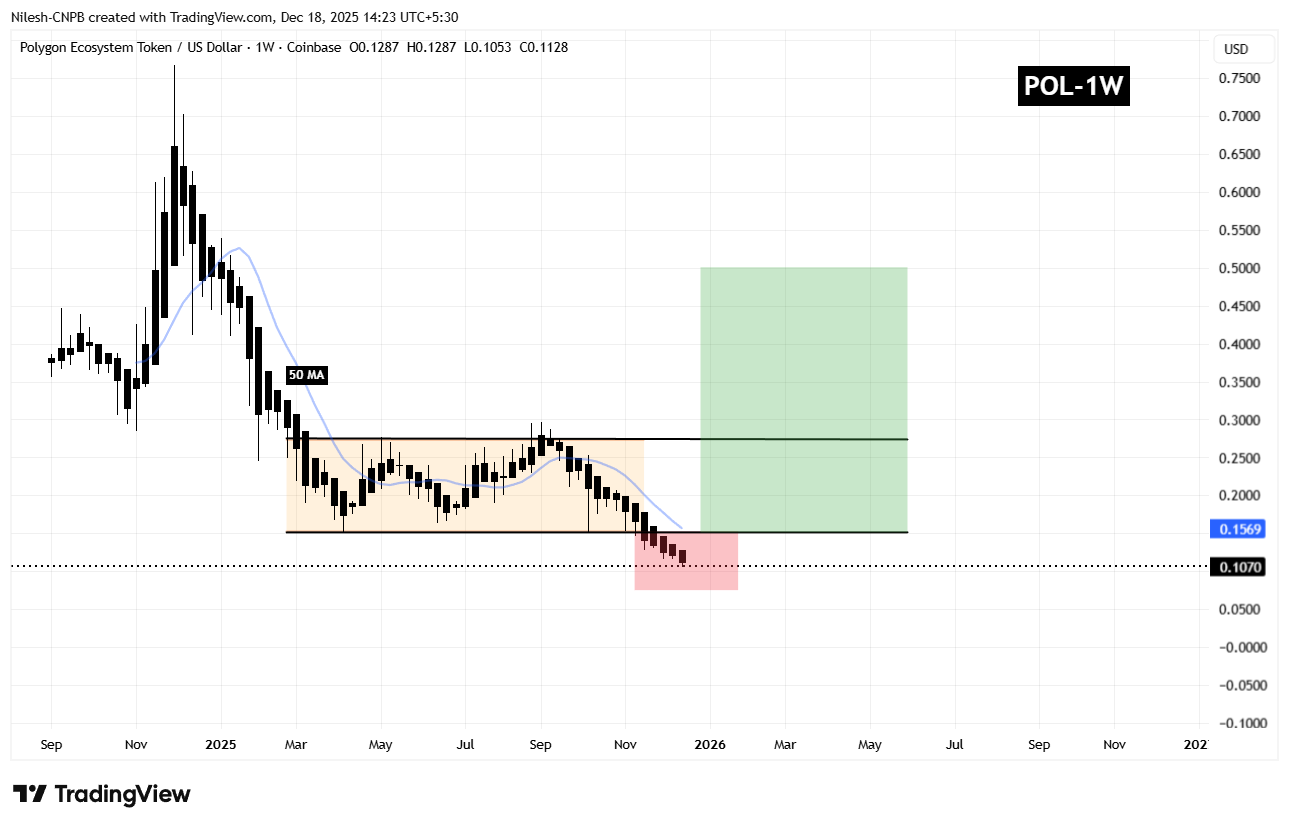
Polygon (POL) Weekly Chart/Coinsprobe (Source: Tradingview)
Notably, the selling pressure has started to lose momentum near this lower zone. Candles are compressing, and downside follow-through appears limited, suggesting that aggressive distribution may be nearing exhaustion.
What’s Next for POL?
At present, POL remains within this manipulation zone, indicating that the market is still probing for direction before committing to a larger move. A brief period of consolidation around current levels would not be unusual, as buyers and sellers continue to battle for control.
For the bullish scenario to gain traction, POL needs to reclaim the $0.15 support zone and move back above the 50-week moving average near $0.1569. A successful recovery above these levels would signal a transition into the expansion phase of the Power of 3 structure, where upside momentum typically accelerates quickly.
If that breakout materializes, the chart projection points toward a potential move into the $0.48–$0.50 region over the coming months, an area that aligns with prior structural resistance.
However, this setup remains conditional. As long as POL continues to trade below $0.15, downside risks cannot be ruled out, and the market remains vulnerable to further volatility. Holding current lows and reclaiming key resistance levels will be critical for bulls to validate the bullish reversal narrative.
Disclaimer: The views and analysis presented in this article are for informational purposes only and reflect the author’s perspective, not financial advice. Technical patterns and indicators discussed are subject to market volatility and may or may not yield the anticipated results. Investors are advised to exercise caution, conduct independent research, and make decisions aligned with their individual risk tolerance.
Disclaimer: The information on this page may come from third parties and does not represent the views or opinions of Gate. The content displayed on this page is for reference only and does not constitute any financial, investment, or legal advice. Gate does not guarantee the accuracy or completeness of the information and shall not be liable for any losses arising from the use of this information. Virtual asset investments carry high risks and are subject to significant price volatility. You may lose all of your invested principal. Please fully understand the relevant risks and make prudent decisions based on your own financial situation and risk tolerance. For details, please refer to
Disclaimer.
Related Articles
Gold and Silver Slip Slightly, Oil Rises; Bitcoin and Ethereum Volatility Indices Decline
Gate News message, April 23 — Gold prices fell to $4,731.95 per ounce with a daily decline of 0.18%, while silver dropped to $77.585 per ounce, down 0.13% intraday. Bitcoin volatility index (BVIX) stood at 43.64, declining 1.80%, and Ethereum volatility index (EVIX) reached 63.90, down 5.19%.
In
GateNews55m ago
Gate Daily Report (April 23): The U.S. government runs Bitcoin nodes; Tesla’s BTC holdings remain unchanged
Bitcoin (BTC) continues the rebound trend from the beginning of the week, trading at around $78,230 as of April 23. U.S. Pacific Command Commander Samuel Paparo said in a congressional hearing that the U.S. government operates Bitcoin nodes to conduct cybersecurity tests, but does not participate in mining. Tesla’s first-quarter Bitcoin holdings remain unchanged, and its digital-asset impairment loss is $173 million.
MarketWhisper1h ago
Probably Nothing” — But TOTAL2 Structure Points Higher, and These 5 Altcoins Could Lead the Rally
TOTAL2 continues to respect a long-term trendline, signaling underlying altcoin market strength.
Market sentiment remains muted, often a precursor to larger price expansions.
Select altcoins show strong fundamentals despite limited short-term price movement.
The wider altcoin market
CryptoNewsLand1h ago
Trump Confirms Iran Ceasefire Negotiations Have “No Timeline,” Bitcoin Reexamines $78k
On April 23, Bitcoin reclaimed above $78,000. On April 22, U.S. President Donald Trump, during an interview with Fox News reporter Martha MacCallum, confirmed that the U.S.-Iran ceasefire negotiations do not have a set timeline, and denied a report that the U.S. media outlet Axios cited the same day, which referred to a "3 to 5 day window period" attributed to U.S. officials.
MarketWhisper1h ago
Crypto Fear & Greed Index Rises to 46, Market Remains in Panic State
Crypto Fear & Greed Index rose to 46, maintaining a 'panic' state; up from 32 yesterday, which also indicated panic.
GateNews2h ago
Grayscale Hints at Bull Market Setup as Bitcoin Holds Critical Breakeven Level
Bitcoin markets are showing signs of a potential bottom as improving price action brings recent buyers back to breakeven. Grayscale points to strengthening positioning as a key signal that sentiment may be shifting toward more bullish conditions.
Key Takeaways:
Grayscale signaled bitcoin may
Coinpedia2h ago