Ethereum’s native token, Ether (ETH), is “seconds away” from entering a convincing breakout stage, according to analyst Kamran Asghar.
Key takeaways:
- Ethereum is nearing a breakout from a falling wedge, with a target of $4,400.
- A bullish crossover in Ethe’s MACD indicator supports the short-term upside outlook.
ETH price may rise above $4,400 by mid-December
As of Wednesday, ETH painted a textbook falling wedge structure while its Moving Average Convergence Divergence (MACD) indicator signaled a bull cross.
The falling wedge typically suggests that bearish momentum is fading. In Ether’s case, the structure has been developing since early October and is now approaching a breakout point near $3,560, which also aligns with the 0.236 Fibonacci retracement level.
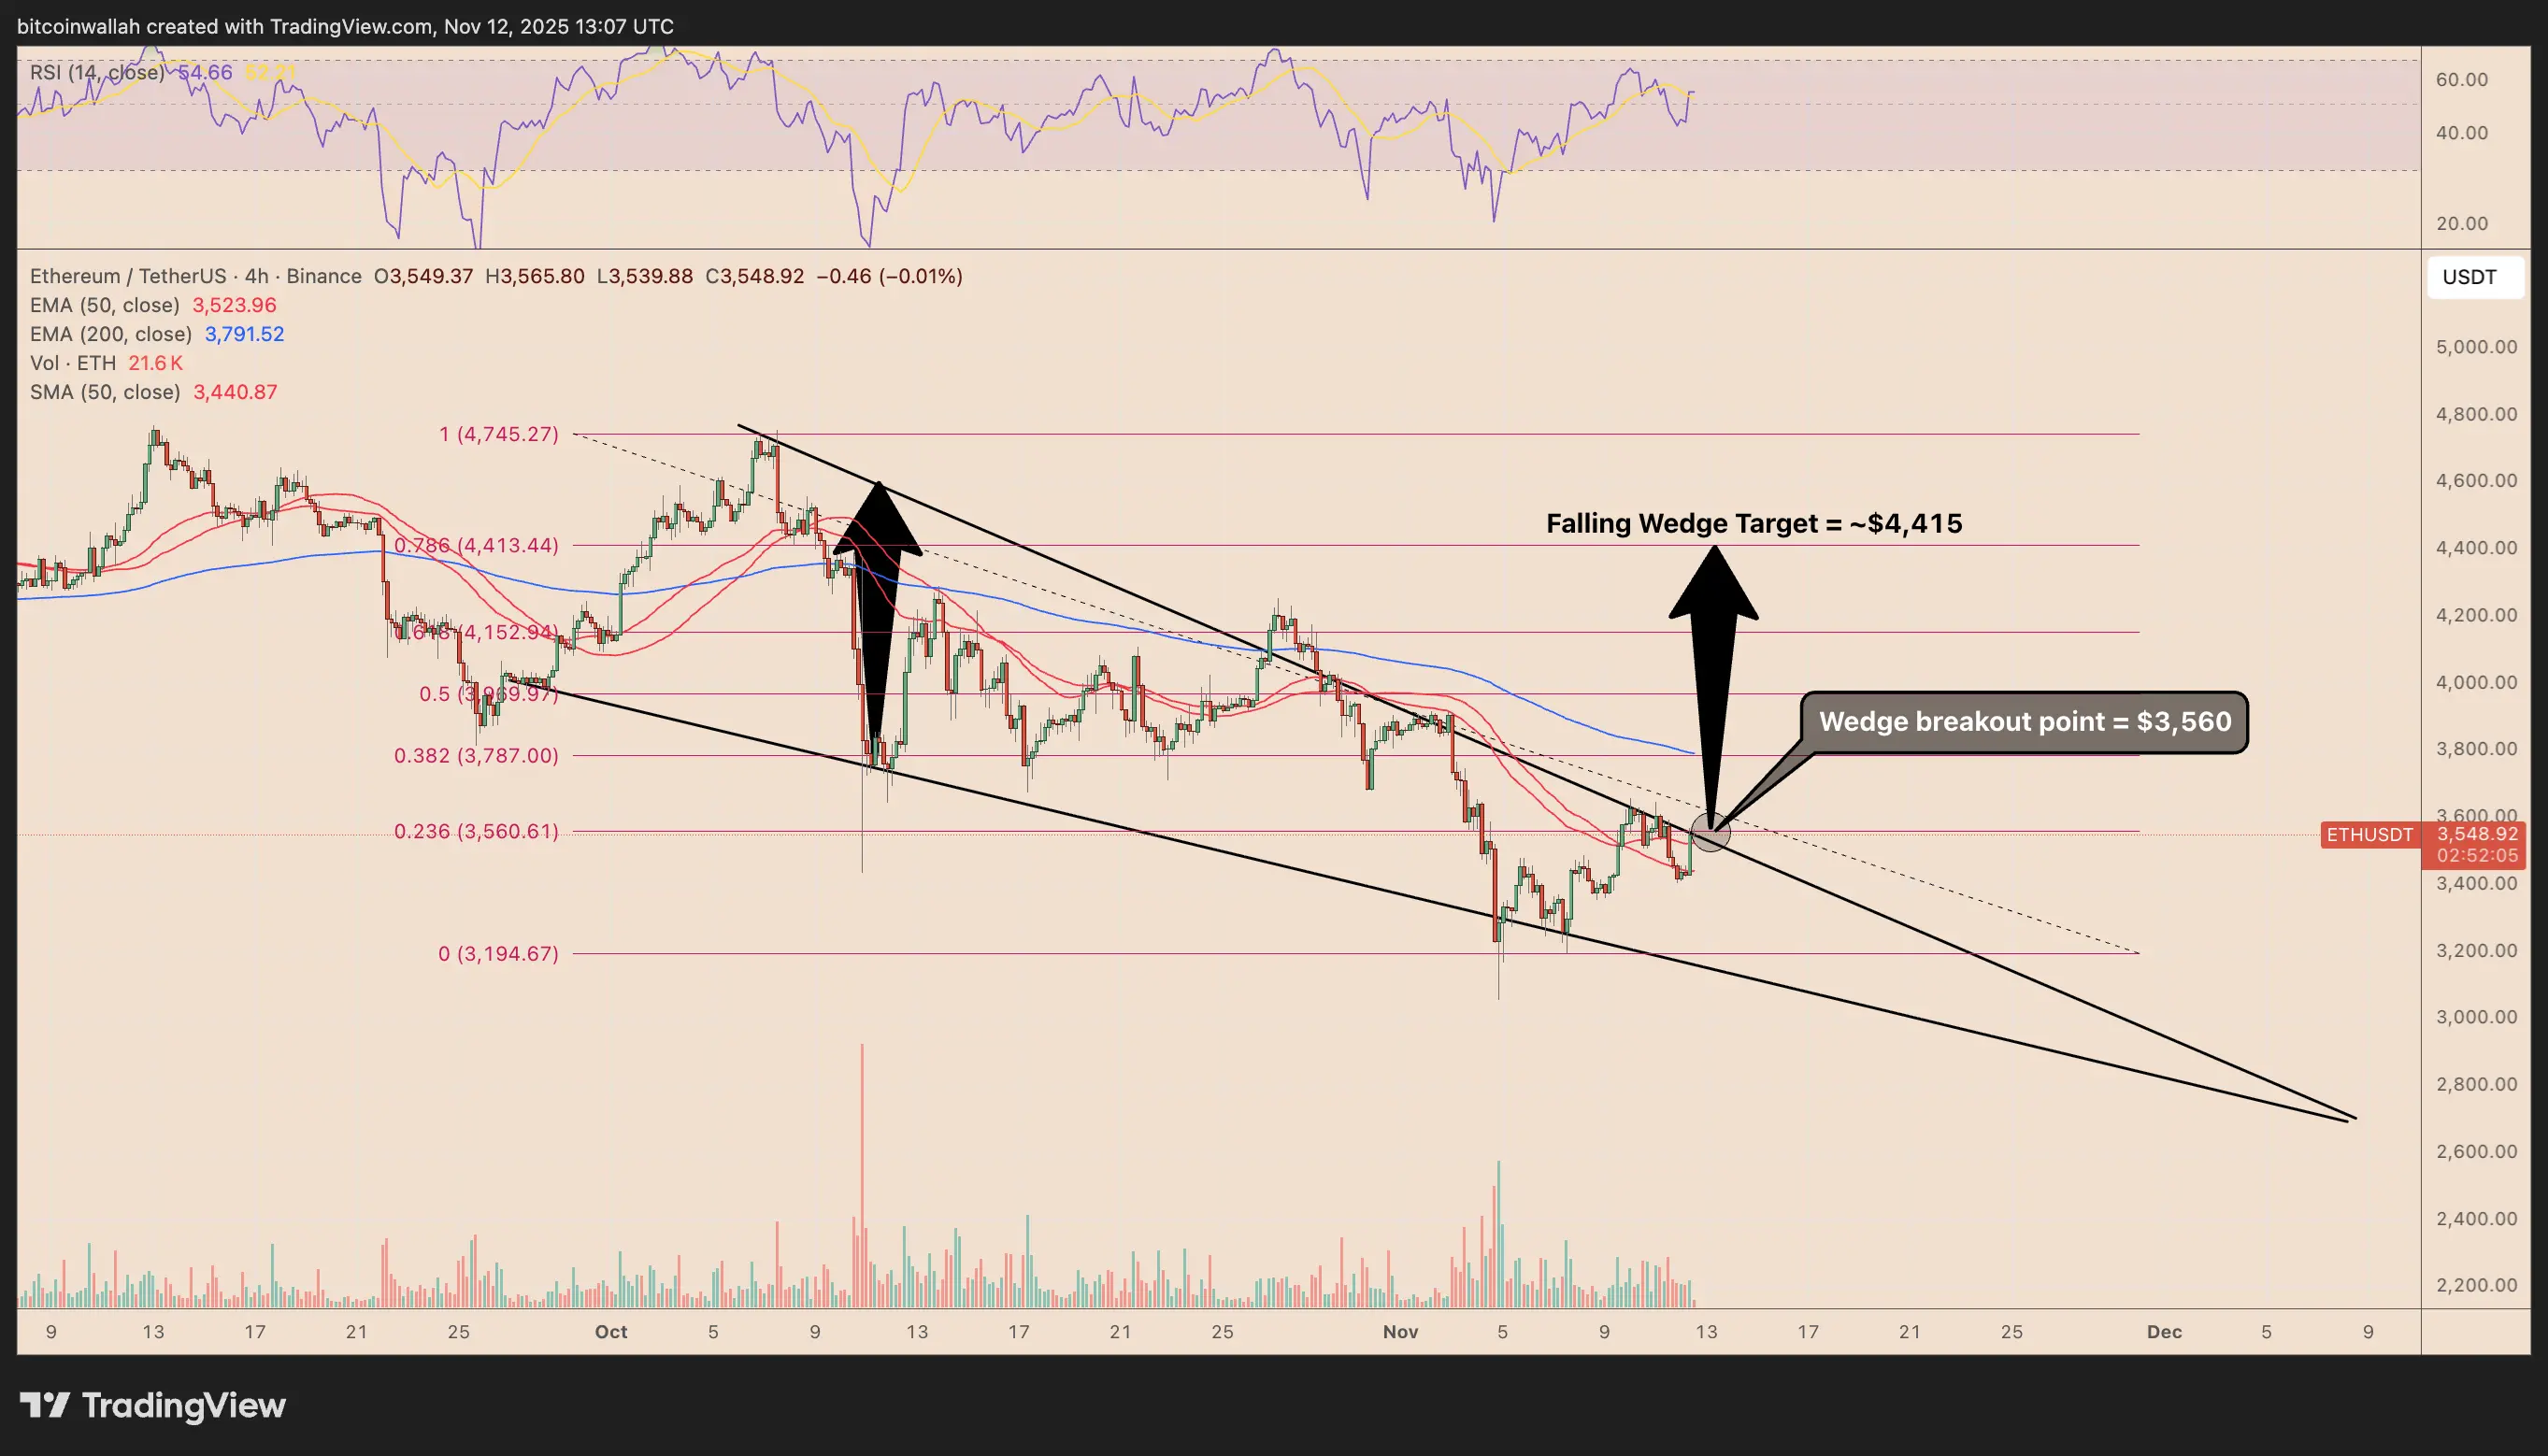 ETH/USDT four-hour chart. Source: TradingViewA decisive move above this resistance could confirm a breakout, setting the stage for a rally toward $4,415 by mid-December, which is roughly 25% higher than current levels.
The target corresponds to the 0.786 Fib level, which previously acted as a key resistance zone.
Adding weight to the bullish outlook, Asghar highlighted that Ethereum’s MACD, a momentum indicator, is “seconds away” from completing a bullish crossover.
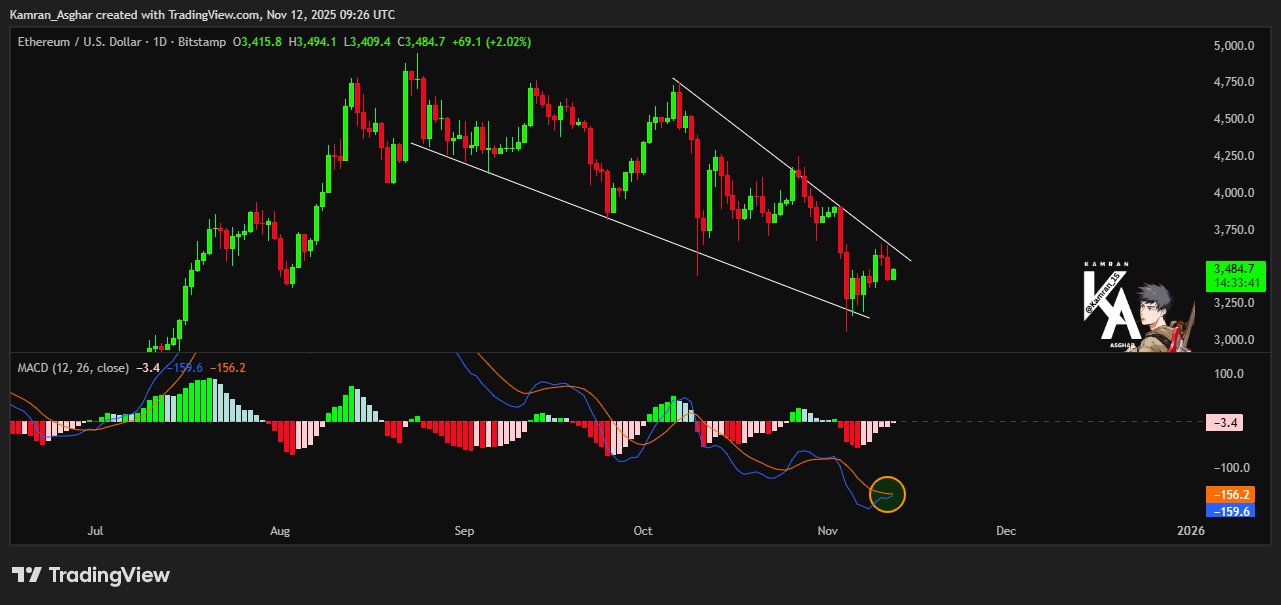 ETH/USD daily chart. Source: TradingView/Kamran AzgharThe MACD compares two moving averages to detect shifts in trend strength. When the faster blue line crosses above the slower orange line, it suggests that buying pressure is overtaking selling momentum.
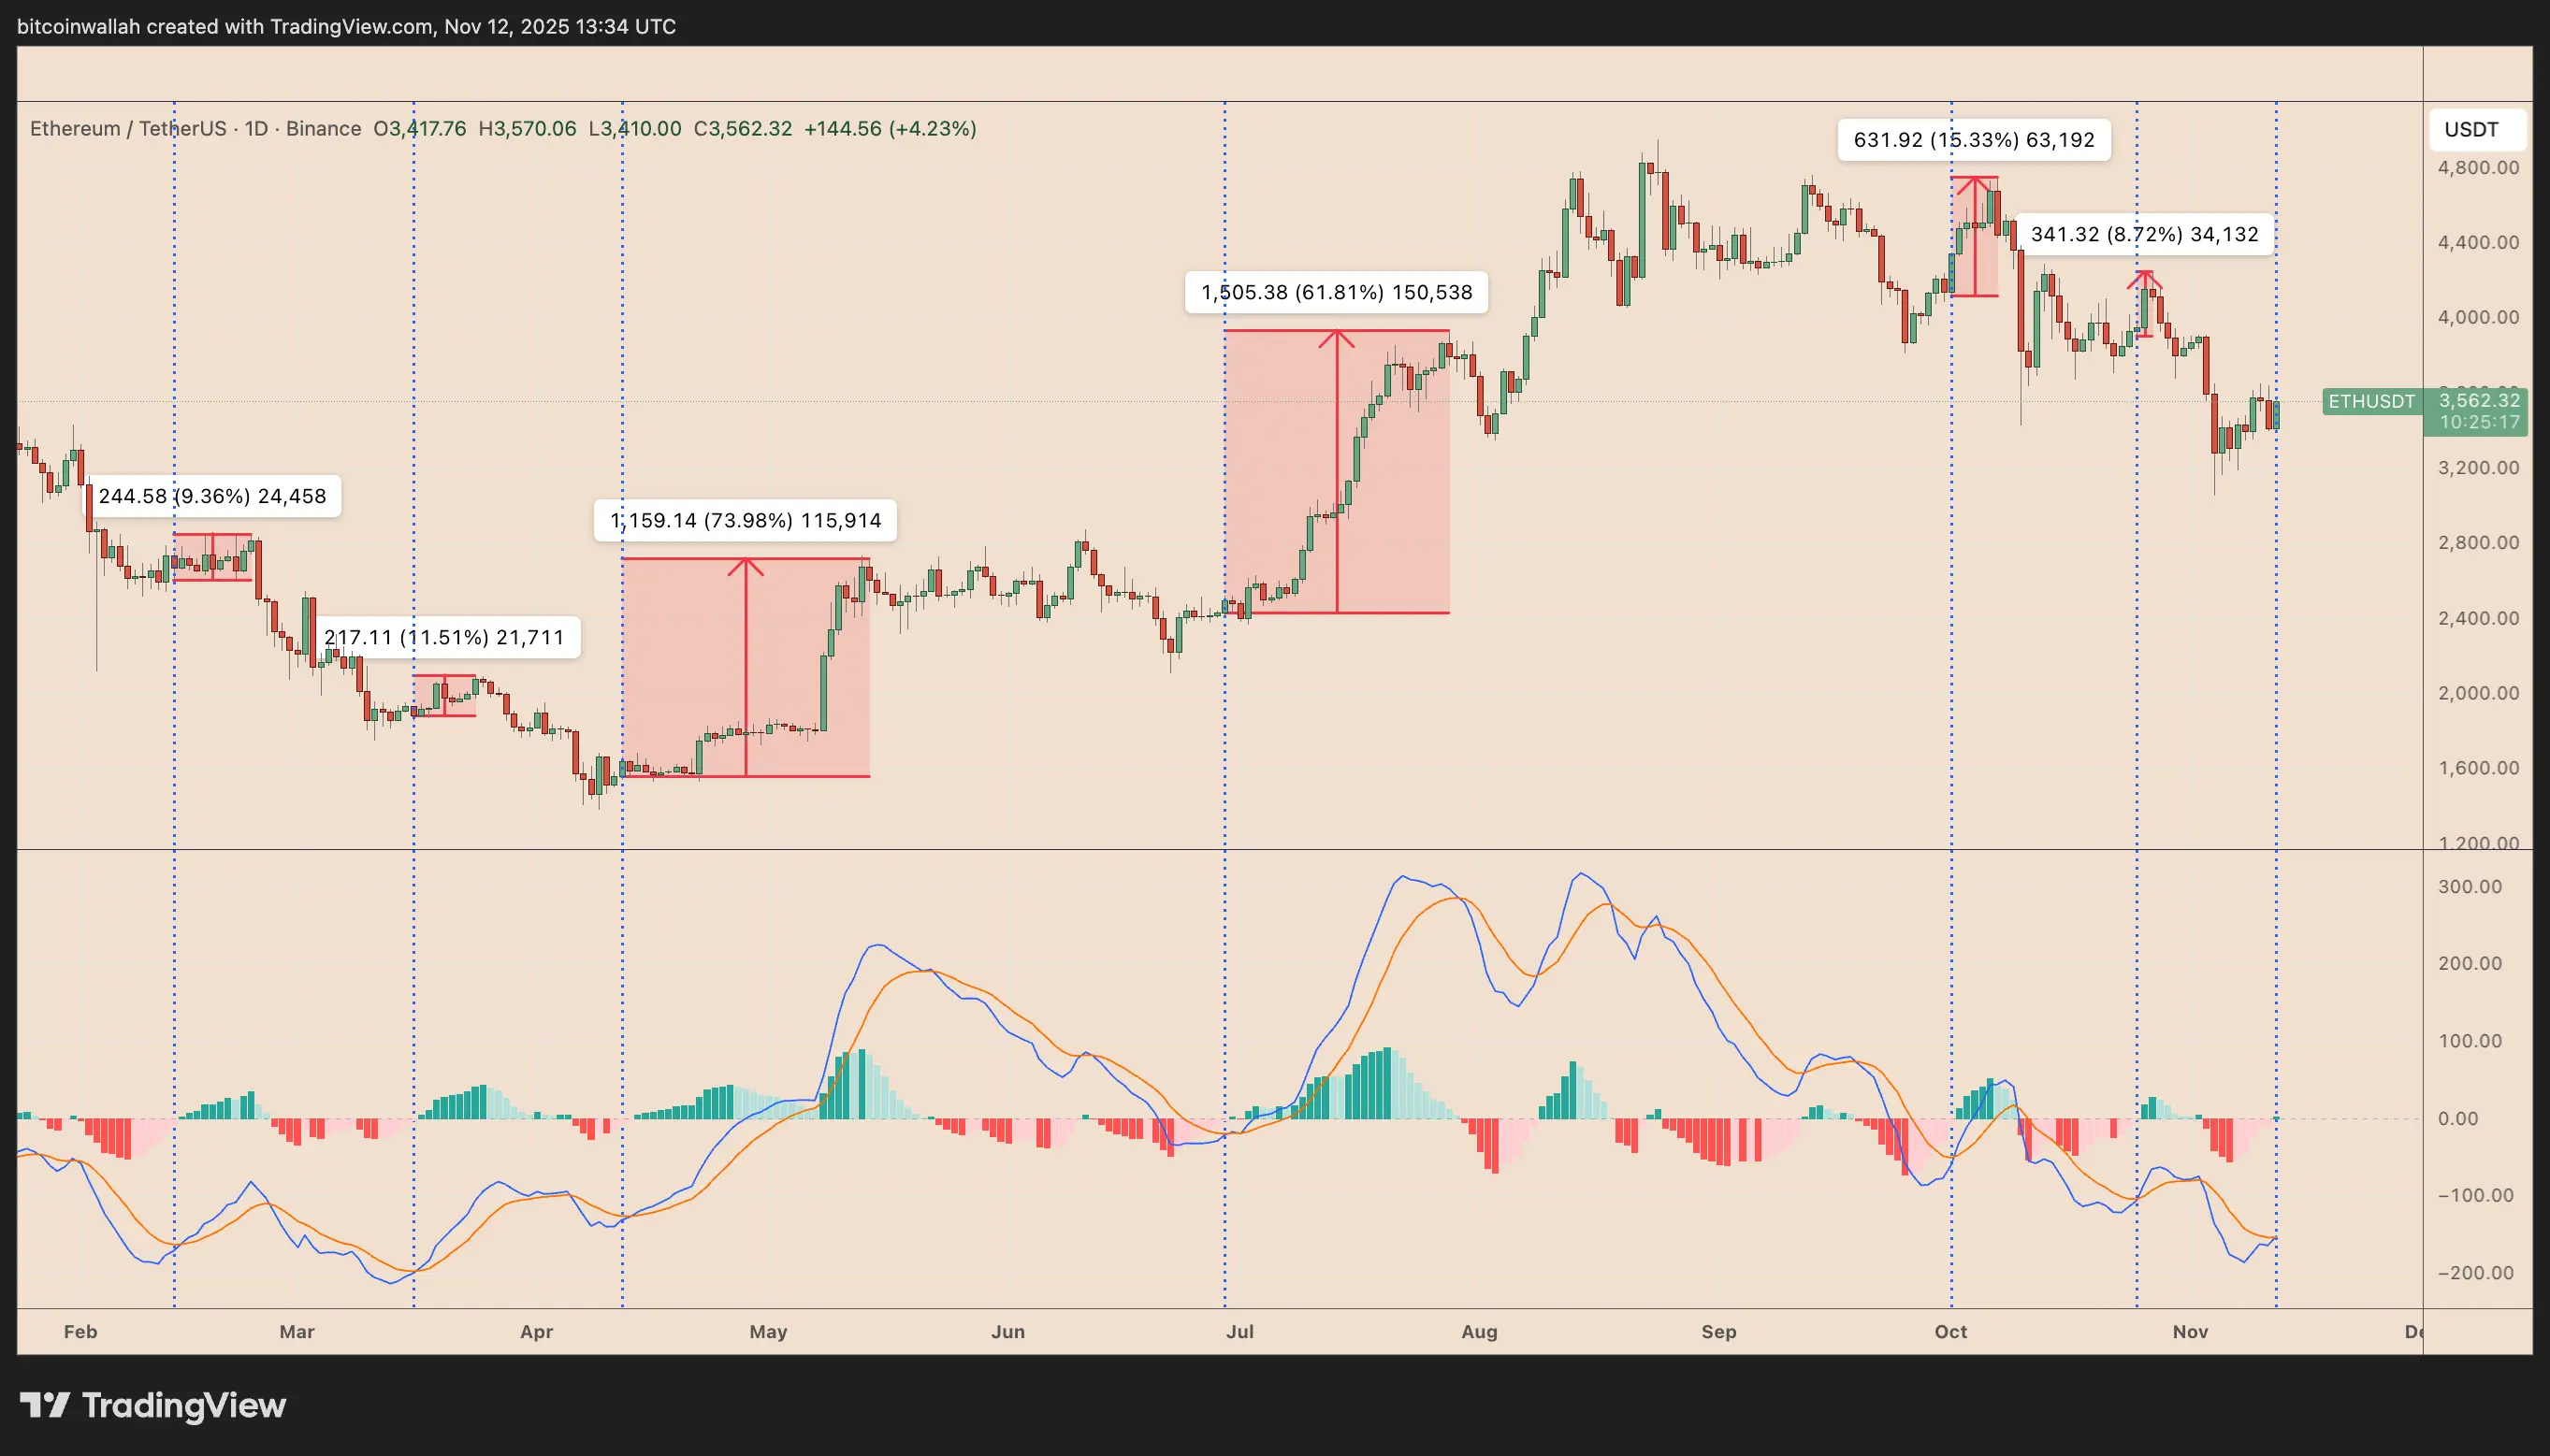
Historically, similar MACD flips during consolidation phases have preceded both short-term and long-term rallies for ETH.
 ETH/USD daily chart. Source: TradingView## What could change the bullish view?
A pullback from the wedge’s upper trendline, however, risks invalidating the breakout setup, instead pushing ETH’s price toward the lower trendline, which is around the $3,000-3,200 range.
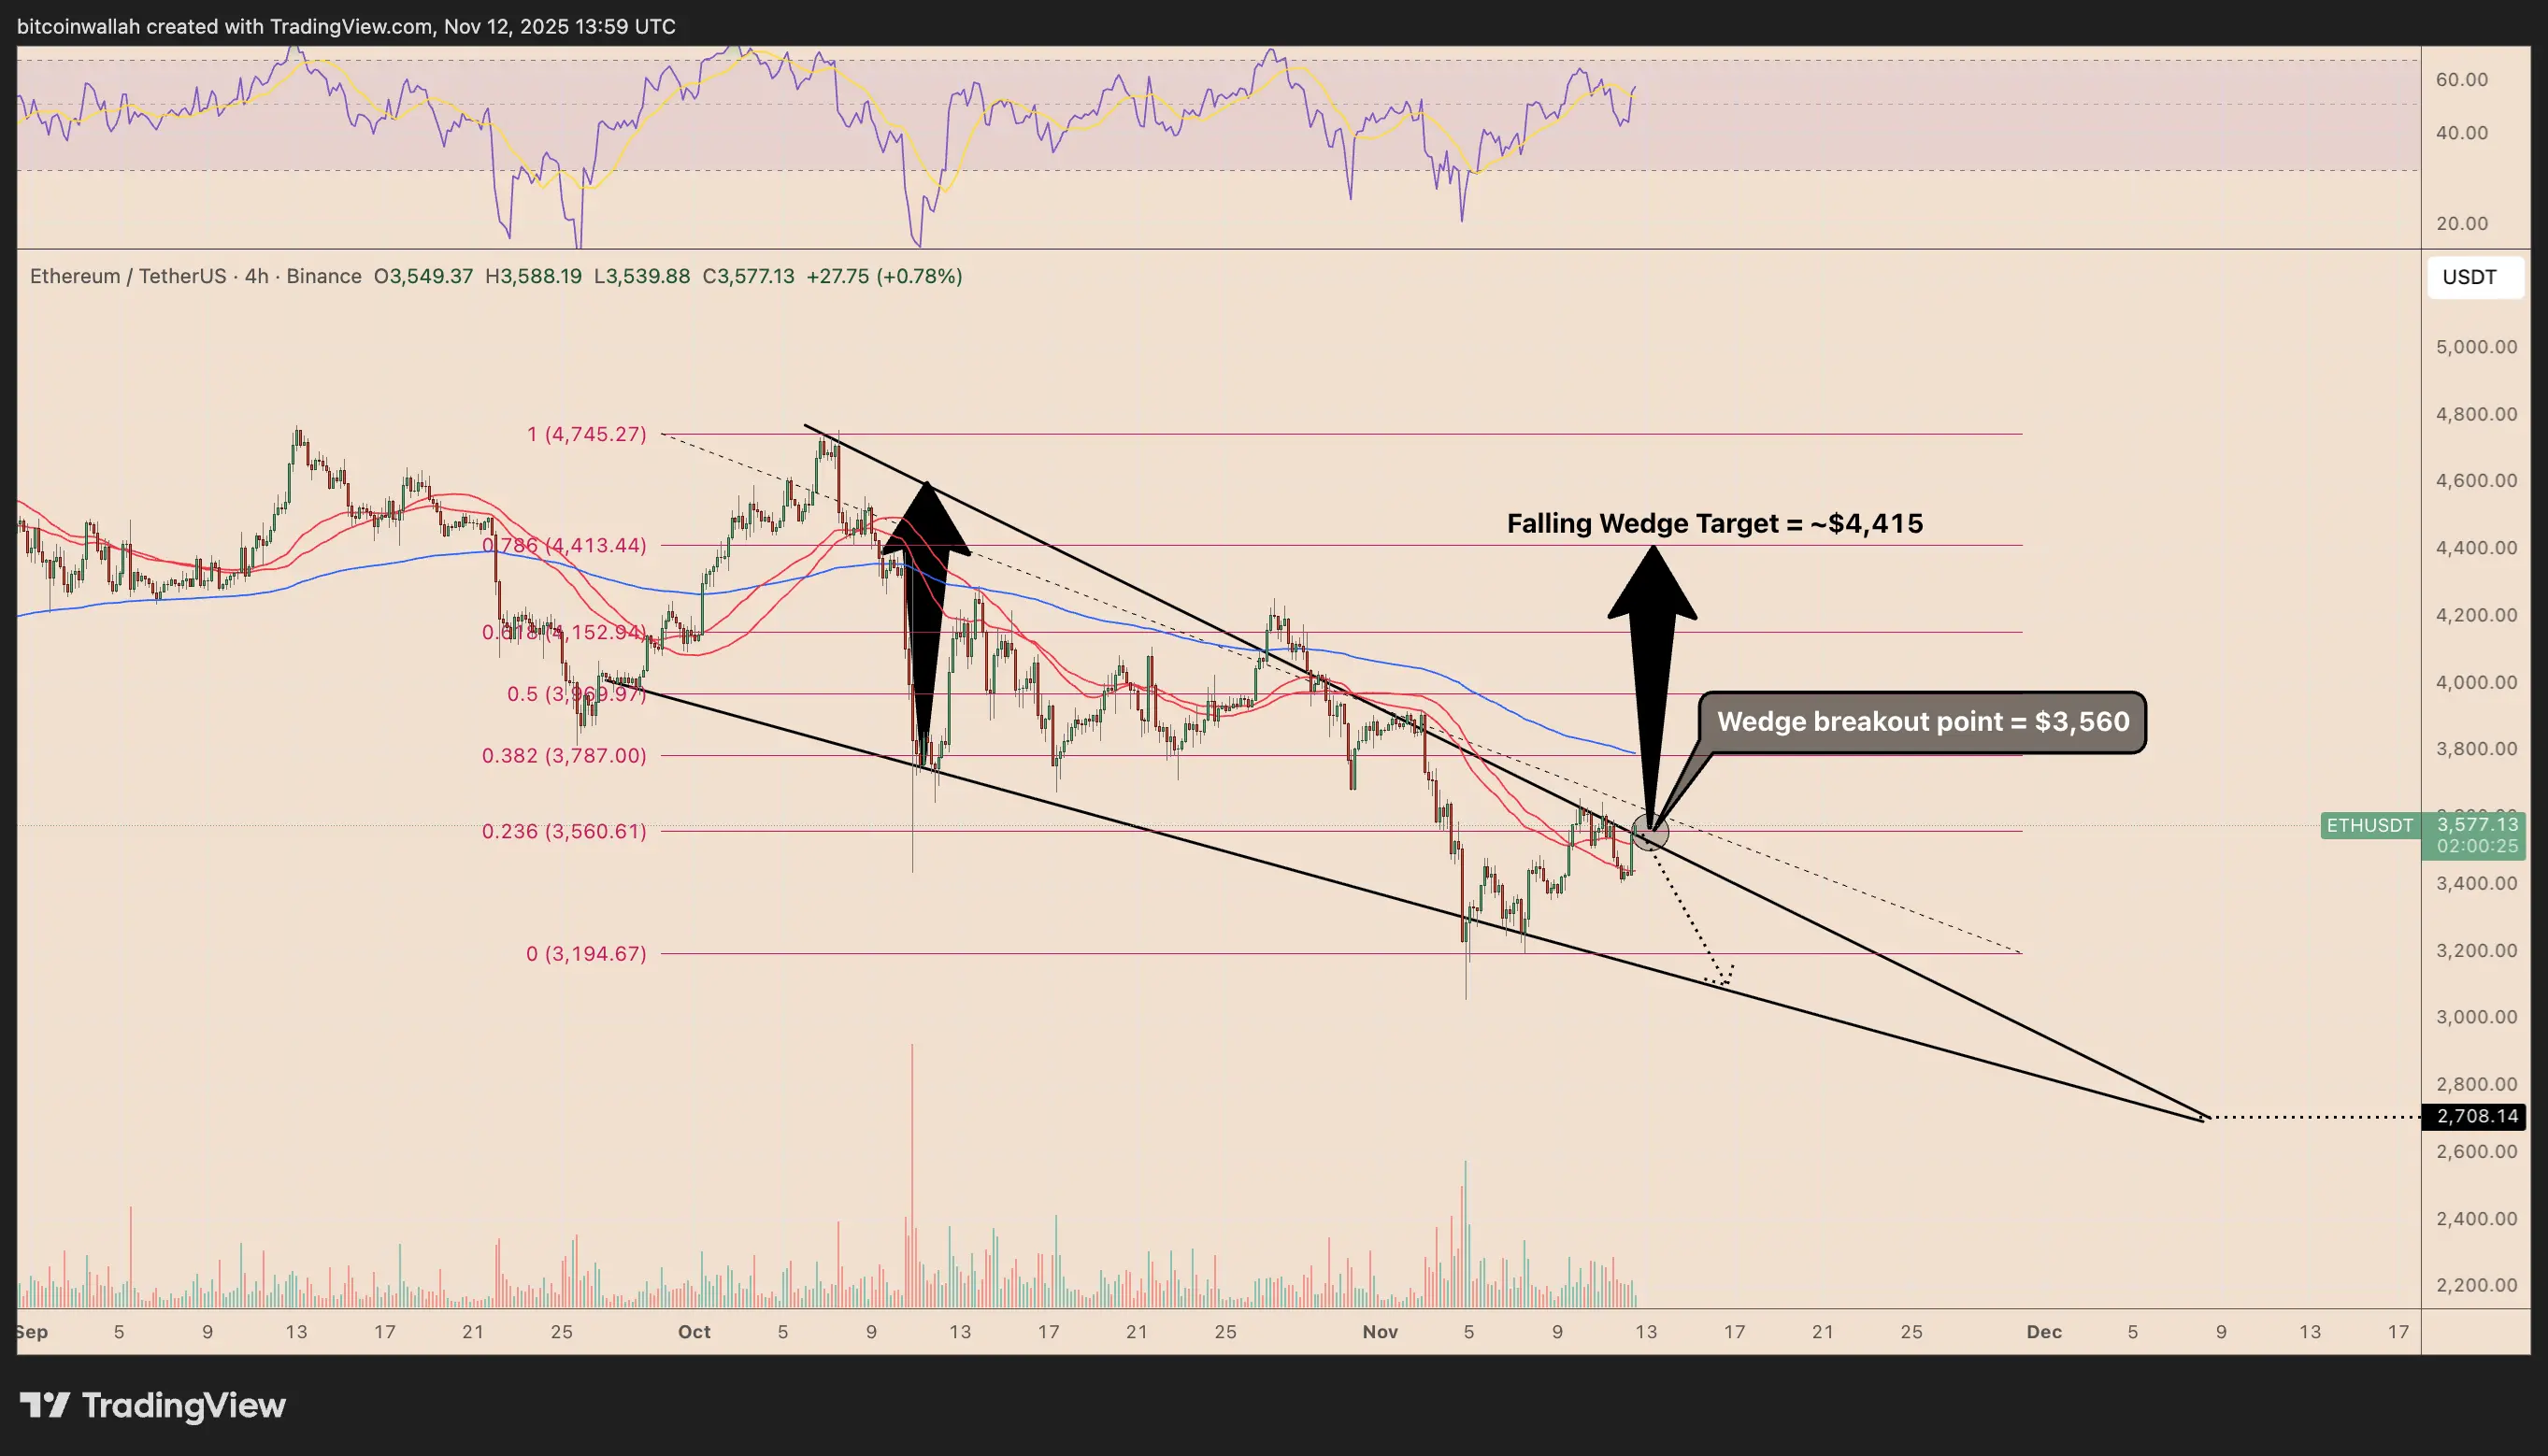 ETH/USD four-hour price chart. Source: TradingViewIn the worst-case scenario, the price may consolidate until it reaches the apex of the wedge, where its two trendlines converge, at around $2,710.
Ethereum’s MVRV Extreme Deviation Pricing Bands indicate a downside outlook, suggesting that ETH may slip toward its –0.5σ band (teal) at around $2,870 after closing below its mean valuation level.
 Ethereum MVRV extreme deviation pricing bands. Source: GlassnodeThroughout Ether’s history, similar breakdowns below the mean band have preceded extended sell-offs, often pushing ETH’s price to or below the teal– 0.5σ band before a recovery began.
This article does not contain investment advice or recommendations. Every investment and trading move involves risk, and readers should conduct their own research when making a decision.
- #Ethereum
- #Markets
- #Tech Analysis
- #Market Analysis
- #Ethereum Price
Add reaction
![]()
Disclaimer: The information on this page may come from third parties and does not represent the views or opinions of Gate. The content displayed on this page is for reference only and does not constitute any financial, investment, or legal advice. Gate does not guarantee the accuracy or completeness of the information and shall not be liable for any losses arising from the use of this information. Virtual asset investments carry high risks and are subject to significant price volatility. You may lose all of your invested principal. Please fully understand the relevant risks and make prudent decisions based on your own financial situation and risk tolerance. For details, please refer to
Disclaimer.
Related Articles
eth.limo DNS Under Attack, Vitalik Urges Users to Pause Access and Switch to IPFS
Vitalik Buterin warned on April 18 about an attack on the DNS registrar for eth.limo, urging users to avoid accessing vitalik.eth.limo and related pages. He recommended using IPFS as an alternative until the issue is resolved.
GateNews23m ago
Arthur Hayes Moves 3,000 ETH to Major CEX, Sparking Sell-Off Speculation
A wallet associated with Arthur Hayes transferred 3,000 ETH to exchanges, sparking speculation about potential selling pressure. While some interpret this as profit-taking, others suggest it may be for repositioning. The crypto community remains divided as traders monitor the situation closely.
GateNews1h ago
Ethereum Spot ETFs Record $127M Net Inflows, Fidelity FETH Leads with $84.13M
Ethereum spot ETFs saw $127 million in net inflows on April 17, with Fidelity's FETH leading at $84.13 million, followed by BlackRock's ETHA and other notable contributions from Grayscale and 21Shares.
GateNews3h ago
ETH breaks below 2400 USDT
Gate News bot message, Gate market data shows that ETH has broken below 2400 USDT, with the current price at 2399.93 USDT.
CryptoRadar4h ago
Ethereum Foundation Key Researcher Josh Stark Departs After Five Years
Josh Stark, a key researcher at the Ethereum Foundation, announced his departure after five years, expressing no future plans and emphasizing the Ethereum ecosystem's unexpected successes. His exit follows increased community scrutiny and recent leadership changes within the Foundation.
TheNewsCrypto6h ago
Aztec Network Completes Liquidation of Public Sale ETH, Transfers Over 15,000 ETH to Major CEX
Aztec Network has completed the liquidation of 19,388.4 ETH from its December public sale, transferring the final 5,020 ETH to a major CEX. The project raised around $59.13 million, with the AZTEC token price dropping nearly 50% post-auction.
GateNews6h ago
