BTC, known as digital gold, is still young, and the disappearance of the four-year cycle is an inevitable path.
Written by: Mr. Beg
Key Points
- The strong cyclicality of BTC is inevitably gradually disappearing.
- The two peaks of 2021: the complete defeat of the Kezhouqiujian faction
- A Historic First: The Major Change in URPD Chip Structure
- Analysis methods and coping strategies after periodic disappearance
Inevitably Disappearing Cycles
Most people in the cryptocurrency space are familiar with the strong cyclicality of BTC. Originating from the design of halving every four years, the price trend of BTC seems to correspond perfectly with it.
At the end of 2013, the end of 2017, and the end of 2021, they correspond precisely to three periodic peaks, following a pattern that occurs once every four years, which countless market participants regard as a criterion.
However, from a research perspective, simply carving a boat to find a sword clearly cannot lead to rigorous conclusions.
As the impact of halving diminishes over time and market capitalization grows, there is currently no viewpoint that can withstand scientific scrutiny and support the four-year cycle theory.
If future cycles disappear periodically, how should we, as traders, respond?
The Most Powerful Group: Market Participants with Holding Time Between 1 Year and 3 Years
Historically, there has been a group whose behavior perfectly corresponds to the bull and bear cycles of BTC, and this group consists of market participants whose holding period is between 1 year and 3 years.
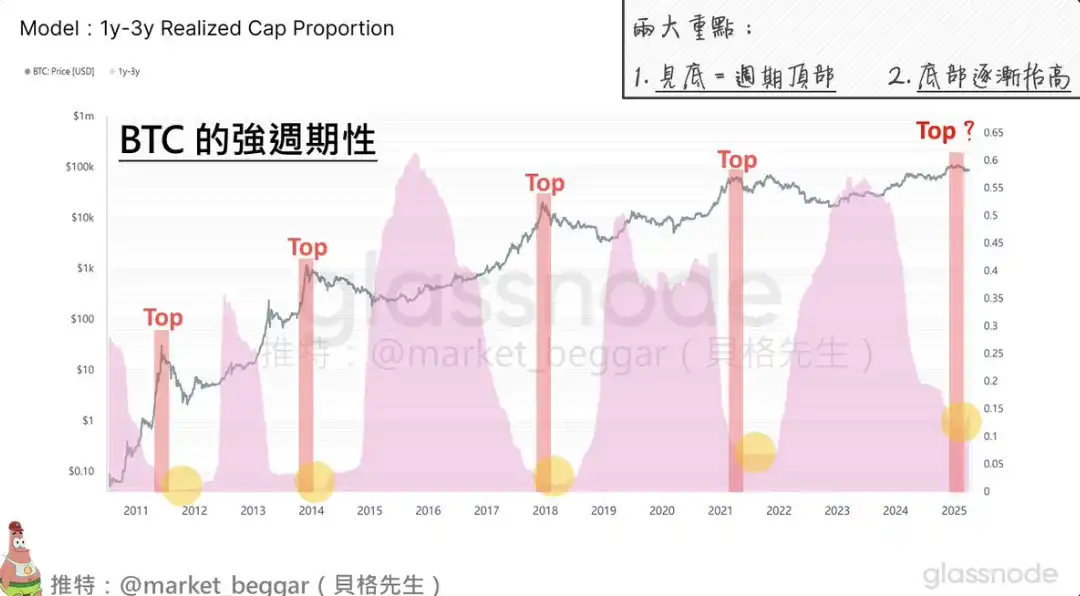
(Chart description: The proportion of market participants holding for 1-3 years)
We can clearly see that:
- Whenever this percentage hits the bottom, it always corresponds to the peak of the price cycle
- Whenever this proportion reaches its peak, it always corresponds to the cyclical bottom of the price
In plain language: whenever the BTC price peaks, they just happen to have sold everything; and whenever the BTC price bottoms, they just happen to have accumulated a large amount of chips.
It is currently impossible to determine what is the cause and what is the effect, but it is clear that the emergence of bull and bear cycles is closely related to them.
In this chart, there are three noteworthy points:
- With each cycle, the minimum value of this proportion is increasing year by year. The reason behind this is not difficult to infer: more and more participants are choosing to hold BTC for the long term.
- Currently, the proportion of this group is starting to shift to “increase,” which echoes my logic of being bearish on BTC since the end of last year.
(For detailed content, please refer to my previous post)
- It can be reasonably inferred that the bottom value of this proportion will only continue to grow larger in the future.
From obscurity to being listed on the US ETF and competing with gold, as BTC gradually comes into the spotlight, more people will be willing to hold BTC.
Two Tops of 2021: The Complete Defeat of the Ke Zhuo Qiu Jian School
Previously, I had written several articles specifically discussing the double top in 2021.
In the article “Revisiting the Double Top of 2021: What is ‘Future Data Leakage’?”, I clearly pointed out the uniqueness of the double top in 2021 and explained in detail why one cannot seek a sword by carving a boat.
In line with today’s theme, I will analyze from a different perspective:
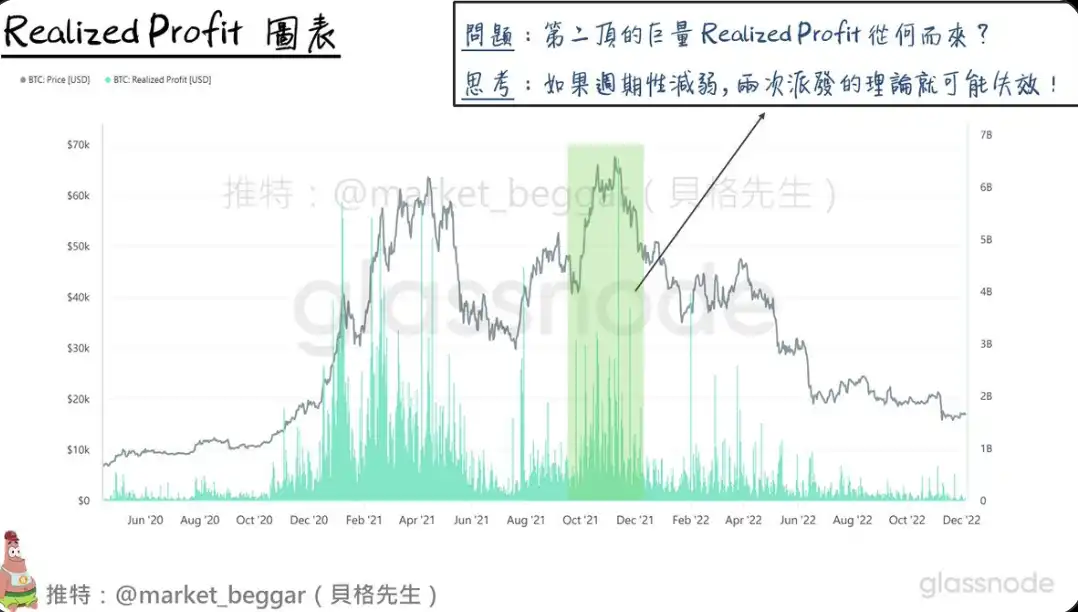
(Chart explanation: Realized Profit 已实现利润)
The so-called Realized Profit is based on the principle of UTXO accounting on the blockchain, which calculates how much profit is realized each day.
In my pinned post, I also mentioned: whenever centralized, massive Realized Profit occurs, it indicates that a large amount of low-cost chips are being sold off for realization, which is a major warning sign.
For a detailed analysis, please refer to this article: Top Signal Tracking: Huge Realized Profit Reappears
From the perspective of on-chain data, the cycle actually ended in April 2021 (the first peak); however, due to various factors, BTC reached a second peak in November 2021.
As shown in the figure above, at the time of the second peak, it is also accompanied by a huge amount of Realized Profit. So the question arises: “Where does this huge amount of Realized Profit come from”?
Looking at the first chart, the proportion of holders with a holding period of 1 to 3 years actually bottomed out in April 2021.
Therefore, the large Realized Profit that appears in the second peak can only come from the group that accumulated chips from May to July 2021.
This is the point worth considering:
If future cycles gradually disappear, will there be more situations like this “temporary bottom” before starting a new round of major upward trends?
As mentioned in my previous article, past peaks are often accompanied by two major distributions, and this cycle did indeed experience the second major distribution last December.
But if, as volatility decreases in the future, will it only take one time to complete the new bull and bear cycle belonging to BTC?
Worth pondering.
The First Time in History: A Major Change in the URPD Chip Structure
Next, let’s talk about this topic from the perspective of chip structure.
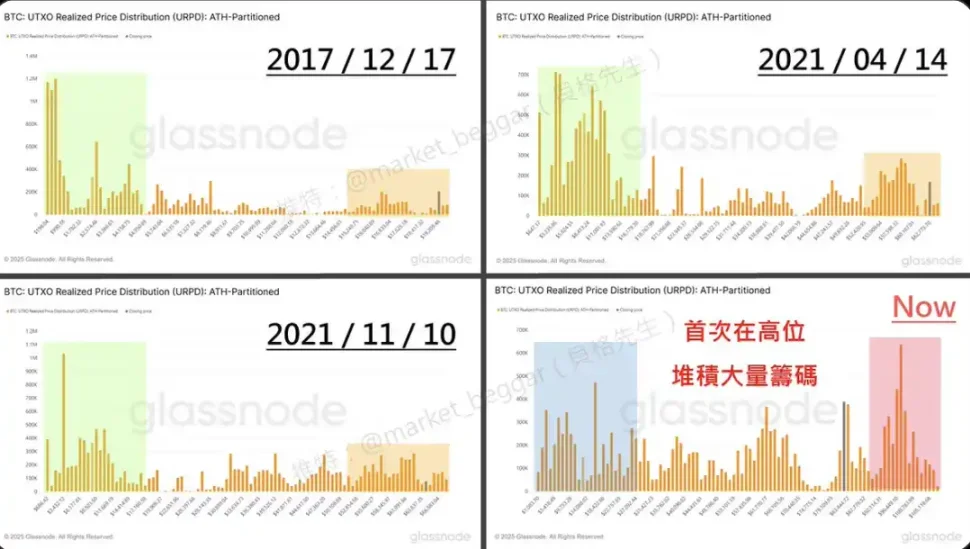
(Chart description: Comparison of the URPD chip structure at the tops of the past three cycles)
It can be seen that this round cycle is the most special one so far.
The reason for saying this is: This is the first time in history that, after the second large-scale distribution, there is a period of massive accumulation of chips in the top area.
Previously, I also wrote about this topic, and detailed views can be found in this article: BTC Chip Analysis: Discussing the Biggest Potential Chip Structure Risks on URPD.
Accordingly, we may have to admit that BTC is entering a whole new era.
Analysis Methods & Response Strategies After Periodic Disappearance
If future cycles indeed weaken as expected, how should we, as traders, examine the market?
First, the conclusion: Never seek the sword by carving the boat, analyze it using the logic of deduction.
In the young lifecycle of BTC, the sample size is severely insufficient, which has led to the countless theories of the boat carving school being debunked one after another.
Shanzhai season, prices must rise during the New Year, prices must rise n days after the halving … and so on, there are too many to list, not to mention all those various indicators that were knocked down in 2021.
Therefore, in order to overcome the problem of insufficient sample size, we must ensure the existence of logic as much as possible during the research process.
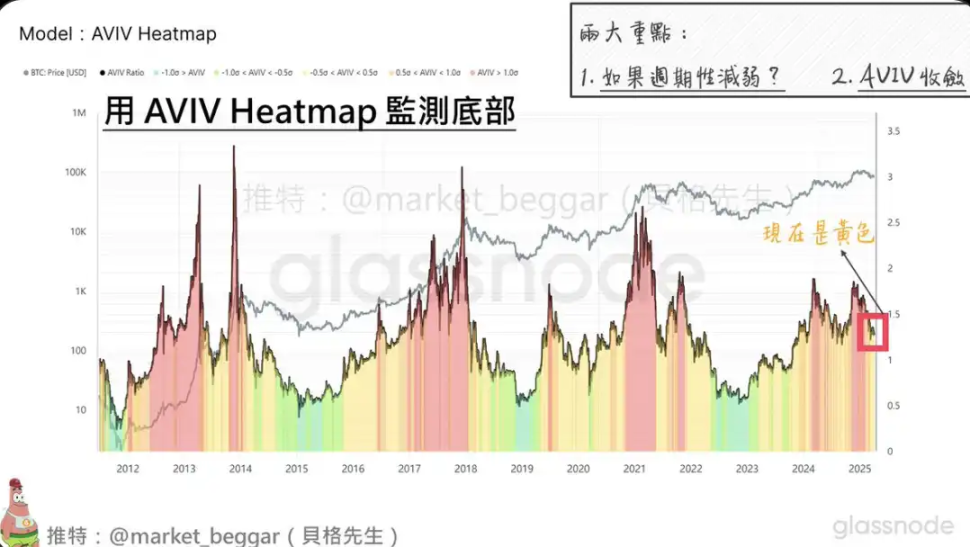
For example: AVIV Heatmap.
AVIV, seen as an optimized version of MVRV**, calculates based on active (rather than completely inactive) chips, while excluding the impact of miners.
The AVIV Heatmap is one of the models I personally designed, utilizing the mean reversion characteristic of AVIV and coloring based on its deviation.
The advantage of this analysis method is that the calculation of deviation takes into account the “standard deviation,” which is the indicator that directly reflects the volatility of BTC.
Therefore, as the volatility decreases, the criteria for defining extreme values in the AVIV Heatmap will also be relaxed.
Conclusion
Let’s make a simple summary:
-
With the maturation of the market, the disappearance of cycles is an inevitable path.
-
Chips held for 1 to 3 years have dominated the bull and bear cycles in the past.
-
The appearance of the double top in 2021 announced the failure of the “carving a boat to seek a sword” methodology.
-
The chip structure has undergone a huge change that has never happened before.
-
As a trader, it is essential to ensure logical consistency during the research process to guarantee the usability of the results.
“BTC is still young, making its way into the world’s spotlight at an unprecedented pace, and both you and I will be witnesses to this historical feast.”
