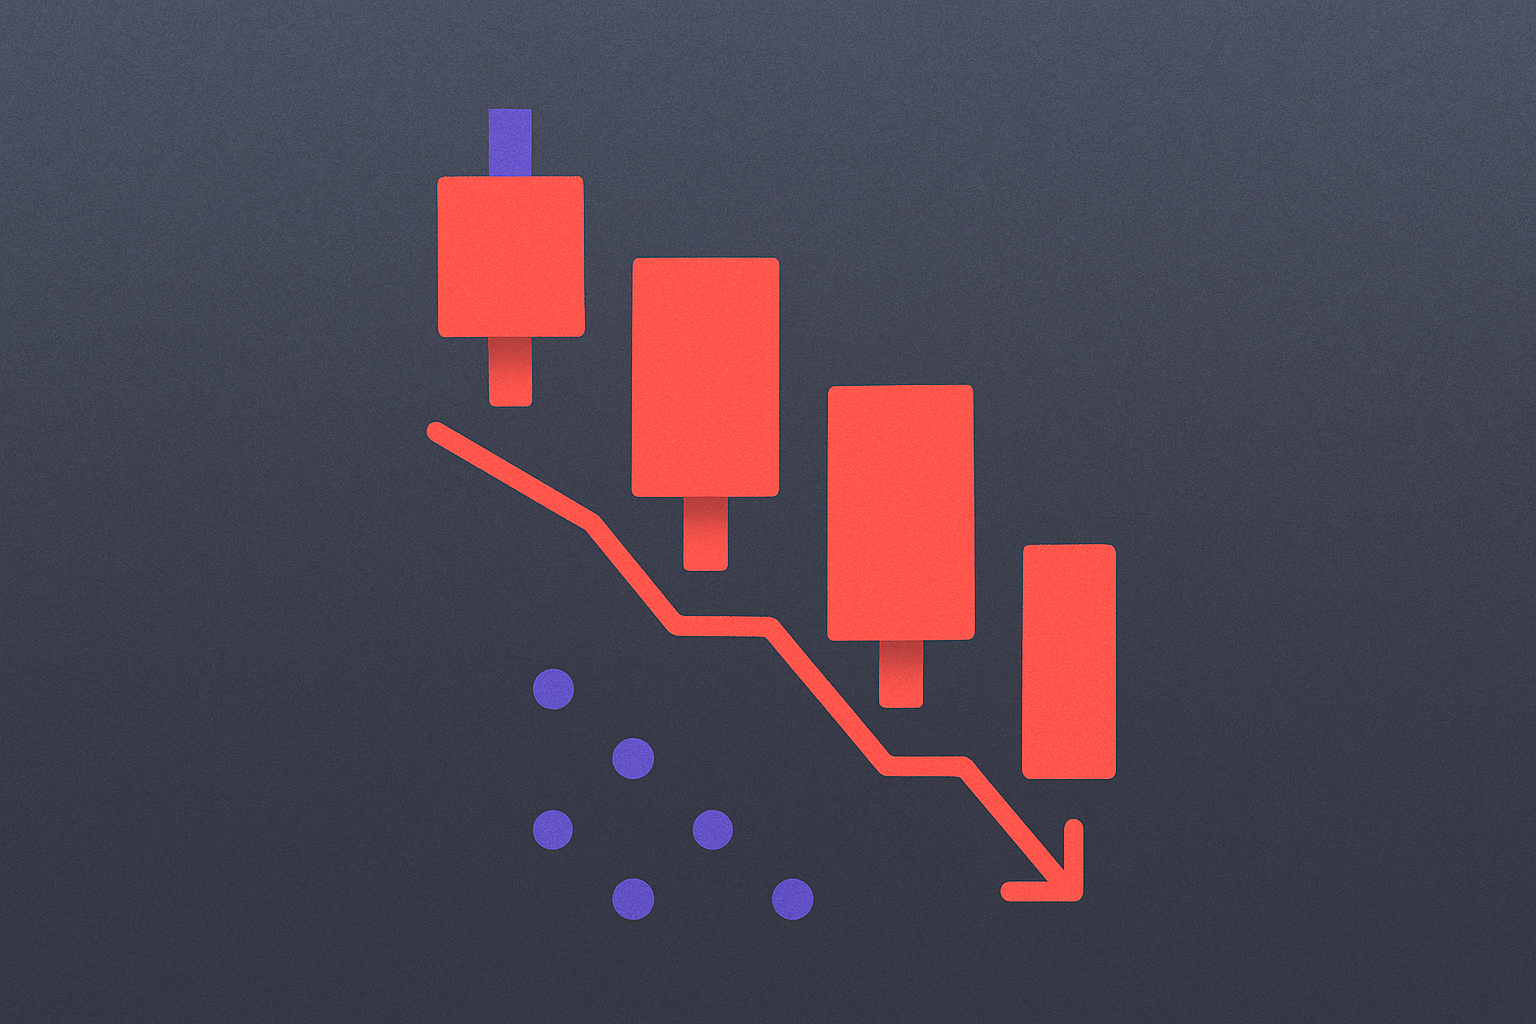
How to Use Technical Indicators (MACD, RSI, KDJ, Bollinger Bands) for Crypto Trading Signals?


MACD, RSI, and KDJ Indicators: How to Identify Bullish and Bearish Signals in Crypto Markets
MACD, RSI, and KDJ indicators serve as essential tools for traders analyzing cryptocurrency price movements and identifying potential entry and exit points. The MACD indicator, composed of two moving average lines and a histogram, generates bullish signals when the MACD line crosses above the signal line, suggesting upward momentum building in crypto markets. Conversely, bearish signals emerge when the MACD line crosses below the signal line, indicating weakening buying pressure. RSI measures momentum on a scale from 0 to 100, with readings above 70 typically signaling overbought conditions and potential bearish reversals, while readings below 30 suggest oversold conditions that may precede bullish movements. The KDJ indicator, similar to the Stochastic Oscillator, combines the highest high and lowest low over a specific period to identify turning points. When the KDJ lines cross above certain levels, they confirm bullish signals; when they cross below, they indicate bearish pressure. These indicators work most effectively when used in combination, as convergence between MACD crossovers, RSI extremes, and KDJ positioning strengthens signal reliability in crypto trading. For instance, observing a MACD bullish crossover alongside RSI rising from oversold territory and KDJ lines crossing upward creates a more convincing bullish scenario than relying on any single indicator alone, helping traders make more informed decisions across different market conditions.
Bollinger Bands Strategy: Using 20-Period Moving Average and Standard Deviation for Entry and Exit Points
The Bollinger Bands strategy combines a 20-period moving average with two standard deviation bands positioned above and below it, creating a dynamic channel that adapts to market volatility. This approach proves particularly effective for crypto trading because cryptocurrency markets experience rapid volatility changes that the bands naturally accommodate through their expanding and contracting nature.
When price reaches the upper band during an uptrend, it often signals potential resistance or overbought conditions, providing an opportunity to exit long positions or initiate shorts. Conversely, when price touches the lower band during downtrends, it frequently indicates oversold conditions and potential support levels, making these zones attractive entry points for long positions. The 20-period moving average serves as the centerline, helping traders identify the intermediate trend direction.
The width of the bands themselves communicates important information—wider bands indicate increased volatility and potential trend strength, while narrowing bands suggest consolidation phases where breakouts become imminent. Traders often initiate entry points when price bounces off the bands with confirmation from other technical indicators, while exit points are typically placed near the opposite band or when price reverses from extreme band touches. This entry and exit methodology allows traders to capture moves from support to resistance levels systematically.
For effective crypto trading implementation, combine this Bollinger Bands strategy with volume analysis and price action patterns to confirm signals before executing trades. The 20-period moving average timeframe works well for shorter-term trading while remaining responsive to significant market moves.
Golden Cross and Death Cross: Leveraging Moving Average Intersections to Confirm Trend Reversals
Moving average crossovers serve as powerful confirmation tools for identifying when cryptocurrency trends shift direction. A golden cross occurs when a shorter-term moving average crosses above a longer-term moving average, typically signaling bullish momentum and potential upward trend reversal. Conversely, a death cross happens when the shorter-term average drops below the longer-term average, indicating bearish pressure and possible downward trend reversal.
These moving average intersections work effectively because they smooth out price volatility and reveal underlying directional momentum. When traders observe these crossovers on their charts, they gain objective confirmation that market sentiment has genuinely shifted rather than reacting to temporary price spikes. The intersection point itself often acts as a support or resistance level, providing traders with strategic entry and exit opportunities.
In practical crypto trading, many experienced traders combine moving average crossovers with additional technical indicators like RSI or MACD to validate their signals. For instance, a golden cross paired with rising trading volume and favorable RSI readings strengthens the bullish case. On platforms like gate, you can easily apply multiple moving averages simultaneously to identify these intersection patterns across different timeframes, from hourly to daily charts, helping you confirm trend reversals before committing capital to your positions.
Volume-Price Divergence Analysis: Detecting Weak Trends When Trading Volume Fails to Confirm Price Movements
When price movements occur without corresponding volume increases, traders face a critical warning signal about trend strength. This volume-price divergence represents a fundamental validation principle in technical analysis that complements standard indicators. When a cryptocurrency experiences upward price movement but trading volume remains flat or declines, the rally lacks conviction from market participants, suggesting the trend may reverse or consolidate soon.
This divergence analysis proves particularly valuable on platforms like gate when combined with other technical indicators. A price reaching new highs on declining volume indicates weak buying interest, potentially preceding a pullback. Conversely, prices falling with minimal volume suggest selling pressure isn't genuine, often preceding rebounds. Professional traders recognize these weak trend patterns as opportunities to avoid unfavorable entries or prepare exit strategies.
Applying volume-price divergence requires observing three key scenarios: high-volume confirmation validates genuine price movements; low-volume price changes suggest temporary or artificial moves; and increasing divergence between price direction and volume trend signals deteriorating conviction. Recognizing these patterns enhances decision-making beyond basic technical indicators alone, helping traders distinguish between sustainable trends and potentially deceptive price action that lacks underlying market participation support.
FAQ
What is the best technical indicator for crypto?
No single indicator is universally best. MACD excels at trend identification, RSI detects overbought/oversold conditions, KDJ offers quick signals, and Bollinger Bands show volatility. Combining multiple indicators provides stronger trading signals than relying on one alone.
How to use Bollinger Bands for crypto trading?
Bollinger Bands consist of three lines: a middle moving average and upper/lower bands. When price touches the lower band, it signals a potential buy; upper band indicates a sell signal. Use band width to gauge volatility—narrow bands suggest low volatility before breakouts. Combine with other indicators for confirmation.
How to use MACD for crypto trading?
MACD identifies trend direction by comparing two moving averages. Buy when MACD crosses above signal line; sell when it crosses below. Combine with RSI to confirm momentum strength and avoid false signals in sideways markets.
How to use RSI indicator in crypto trading?
RSI measures momentum on a 0-100 scale. Values below 30 indicate oversold conditions (potential buy signals), while above 70 suggest overbought conditions (potential sell signals). Combine RSI with other indicators for stronger trading signals and better entry/exit points in crypto markets.
FAQ
What is ta in crypto?
TA in crypto refers to Technical Analysis, a method of evaluating cryptocurrencies by analyzing price charts, trading volume, and market trends to predict future price movements and identify optimal trading opportunities.
What is a ta token?
TA token is a cryptocurrency asset designed for the web3 ecosystem, enabling community participation and governance. It facilitates transactions, staking rewards, and ecosystem utility within the TA network infrastructure.
How do I buy TA coin?
You can purchase TA coin through major cryptocurrency exchanges. Visit any supported platform, create an account, complete verification, deposit funds, and search for TA coin to place your buy order. Ensure you use secure wallets for storage after purchase.
What is the purpose and use case of TA coin?
TA coin serves as a utility token for decentralized finance operations, enabling users to participate in liquidity mining, governance voting, and staking rewards within the Web3 ecosystem. It facilitates seamless transactions and incentivizes community participation in protocol development.
Is TA coin safe and what are the risks?
TA coin operates on secure blockchain technology with transparent smart contracts. Like all cryptocurrencies, it carries market volatility risk. Always conduct thorough research and only invest what you can afford to lose.
What is the current price and market cap of TA coin?
TA coin's real-time price and market cap fluctuate based on market conditions. For the most current data, check major crypto tracking platforms. Market cap reflects total value determined by price multiplied by circulating supply.
Share
Content
MACD, RSI, and KDJ Indicators: How to Identify Bullish and Bearish Signals in Crypto Markets
Bollinger Bands Strategy: Using 20-Period Moving Average and Standard Deviation for Entry and Exit Points
Golden Cross and Death Cross: Leveraging Moving Average Intersections to Confirm Trend Reversals
Volume-Price Divergence Analysis: Detecting Weak Trends When Trading Volume Fails to Confirm Price Movements
FAQ
FAQ
How to Buy Cryptocurrency


Trending Cryptocurrencies


How to Use MACD, RSI, KDJ and Bollinger Bands for Cryptocurrency Technical Analysis in 2025

How to Use MACD, RSI, and KDJ Technical Indicators for Crypto Trading Signals

How to Use MACD, RSI, and KDJ Technical Indicators for Cryptocurrency Trading in 2026

How to Use MACD, RSI, and KDJ Indicators for Crypto Trading: A Complete Guide

How to Use MACD, RSI, and KDJ Technical Indicators for Crypto Trading Success in 2025?

Understanding Bollinger Bands

How to Buy Bitcoin ETFs: A Comprehensive Guide for 2026

What is spot trading?

BTC Dominance at 59%: The $2 Trillion Rotation That Could Ignite Alt Season

Top Ethereum ETFs to Consider
Bearish candlestick patterns