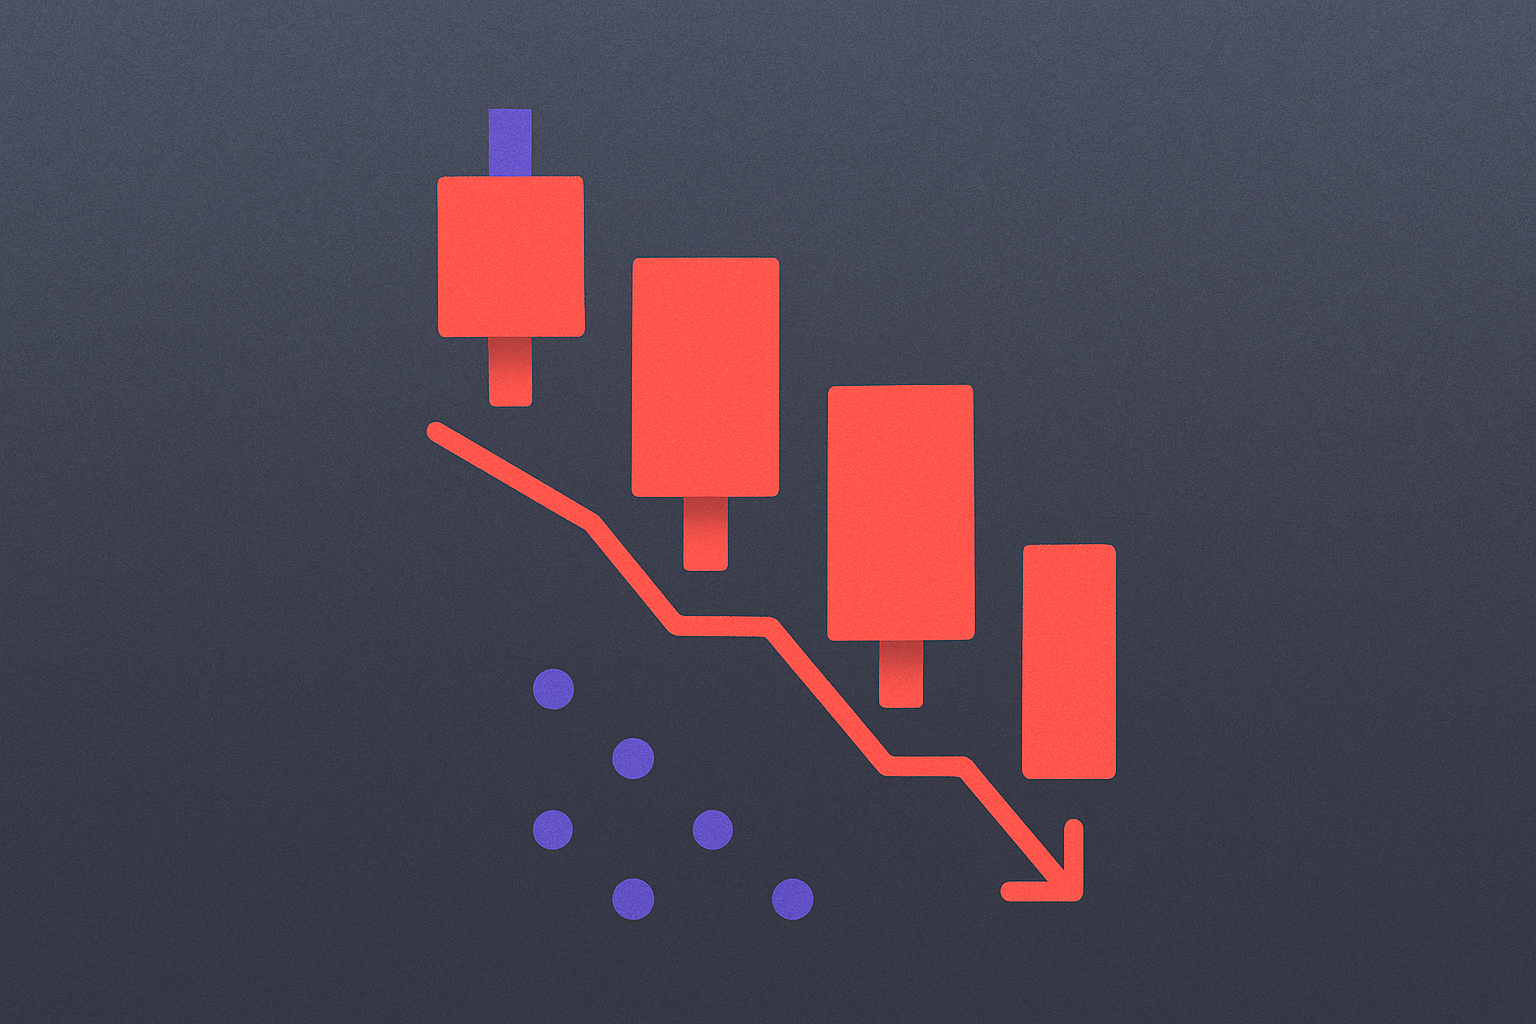
Bearish candlestick patterns
Introduction to Bearish Candlestick Patterns
Bearish candlestick patterns are the inverse of bullish patterns and typically emerge after an uptrend. These patterns are essential in technical analysis for financial markets, helping traders and investors pinpoint potential price reversal points. When bearish candlestick patterns appear, they may indicate a shift from an upward to a downward trend, signaling a possible change in market sentiment.
Traders should evaluate bearish candlestick patterns alongside market context, trading volume, and other technical indicators. Note that on both cryptocurrency and traditional candlestick charts, green generally represents a price increase (bullish candles), while red indicates a price decrease (bearish candles).
Main Types of Bearish Candlestick Patterns
Common bearish candlestick patterns include:
- Hanging Man Pattern
- Shooting Star Pattern
- Bearish Engulfing Pattern
- Evening Star Pattern
- Three Black Crows Pattern
Each pattern has unique characteristics and varying levels of reliability as a trend reversal indicator.
Hanging Man Pattern
The Hanging Man is one of the most recognizable bearish candlestick patterns. It forms when, after a price rally, a candle appears at the top with a long lower shadow and a small body. This candle may be either bearish or bullish, but its structure defines the pattern.
The Hanging Man serves as a strong bearish reversal signal. The candle following the Hanging Man is typically bearish—the longer this bearish candle, the higher the probability of a downtrend starting. Traders often use this pattern to signal entry into short positions.
Shooting Star Pattern
The Shooting Star pattern usually emerges at the peak of an uptrend and is a clear indicator of a possible reversal. It’s characterized by a short body and a much longer upper shadow. This candle can be a small bullish or bearish candle.
The Shooting Star shows that buyers attempted to drive the price higher, but sellers forced it back to or below the opening price. This price action often precedes a reversal from an uptrend to a downtrend.
Bearish Engulfing Pattern
The Bearish Engulfing pattern typically appears at the end of an uptrend and consists of two candles. The first is a small bullish candle, followed by a large bearish candle that completely engulfs the smaller one. This is known as an engulfing pattern and is a strong signal that the trend may reverse.
A Bearish Engulfing pattern suggests heightened price volatility and a shift in the balance between buyers and sellers. The market is likely to turn bearish. The larger the body of the second bearish candle, the stronger and more reliable the potential downtrend signal.
Evening Star Pattern
The Evening Star pattern forms during an uptrend and reliably signals that the market may have reached a top. This three-candle formation is considered one of the most trustworthy reversal indicators.
The Evening Star consists of three candles and is the opposite of the Morning Star pattern. The first candle is bullish, the second can be bearish, bullish, or a doji (a candle where the opening and closing prices are nearly equal). The third candle is bearish, and its low falls below the low of the first candle, confirming the trend reversal.
Three Black Crows Pattern
The Three Black Crows pattern features three consecutive bearish candles with little or no shadows. Each session opens near the previous session’s close, and as selling pressure intensifies, the closing price falls further each day.
This pattern typically signals the start of a downtrend and consistent selling pressure. It shows steady price weakening and is often accompanied by rising trading volume, confirming the strength of the bearish trend.
FAQ
What are bearish candlestick patterns? What are the most common types of bearish candlestick chart patterns?
Bearish candlestick patterns are chart formations that develop during downtrends. The most common types are the bearish flag, descending triangle, head and shoulders (top), and double top. These patterns point to a continuation or strengthening of the price decline.
How do you identify and trade bearish candlestick patterns (such as Shooting Star, Cloud Cover, Engulfing)?
To identify bearish patterns: The Shooting Star forms after a rally and has a long lower wick; Cloud Cover is made up of two red candles; Engulfing occurs when a small green candle is engulfed by a large red one. Trade the downward reversal in combination with support and resistance levels. These signals work best in downtrends.
When using bearish candlestick patterns in trading, how should you manage risk and set stop-loss orders?
Set your stop-loss above the upper boundary of the pattern to manage risk effectively. The size of your stop-loss should reflect your risk tolerance. Trade only during strong downtrends to maximize the probability of success.
How accurate are bearish candlestick patterns? Can you rely on them alone for trading decisions?
Bearish candlestick patterns have an average accuracy of about 60–70%. They are most effective when combined with other technical indicators and volume analysis. You should not rely solely on these patterns for trading decisions.
How do you use bearish candlestick patterns with other technical analysis tools (such as support and resistance levels, moving averages)?
Combine bearish patterns with support and resistance levels to identify sell points. Moving average crossovers reinforce these signals. Oscillators used alongside these tools improve trend prediction accuracy and increase signal reliability.
What are the differences between bearish candlestick patterns across different timeframes (daily, weekly, monthly)?
Bearish patterns on different timeframes reflect different levels of analysis: daily patterns show short-term moves and more detail, weekly patterns reveal medium-term trends, and monthly patterns indicate long-term direction. The same pattern can mean different things depending on the timeframe. Monthly patterns are generally more reliable as signals.
Share
Content
How to Buy Cryptocurrency


Trending Cryptocurrencies


How to Withdraw Money from Crypto Exchanges in 2025: A Beginner's Guide

Hedera Hashgraph (HBAR): Founders, Technology, and Price Outlook to 2030

Jasmy Coin: A Japanese Crypto Tale of Ambition, Hype, and Hope

IOTA (MIOTA) – From Tangle Origins to 2025 Price Outlook

Bitcoin Price in 2025: Analysis and Market Trends

How to Trade Bitcoin in 2025: A Beginner's Guide

Gate Ventures Weekly Crypto Recap (March 2, 2026)
Gate Ventures Weekly Crypto Recap (February 23, 2026)

Gate Ventures Weekly Crypto Recap (February 9, 2026)

What is AIX9: A Comprehensive Guide to the Next Generation of Enterprise Computing Solutions

What is KLINK: A Comprehensive Guide to Understanding the Revolutionary Communication Platform