2025 OVR Price Prediction: Expert Analysis and Market Forecast for the Virtual Reality Token

Introduction: Market Position and Investment Value of OVR
OVR (OVR) is a decentralized network platform designed to unite the real world and the virtual world through augmented reality (AR) technology. Since its inception in 2021, OVR has established itself as a unique spatial computing asset within the Web3 ecosystem. As of December 2025, OVR's market capitalization has reached approximately $2.64 million, with a circulating supply of around 51.27 million tokens, currently trading at $0.05141. This innovative "spatial domain name" asset is playing an increasingly important role in the emerging metaverse and AR application landscape.
This article will provide a comprehensive analysis of OVR's price trends and market dynamics through 2030, combining historical performance patterns, market supply and demand fundamentals, ecosystem development, and macroeconomic conditions to deliver professional price forecasts and practical investment strategies for crypto investors.
OVR Market Analysis Report
I. OVR Price History Review and Current Market Status
OVR Historical Price Evolution
- 2021: OVR reached its all-time high of $3.33 on December 2, 2021, marking the peak of the project's initial market enthusiasm phase.
- 2021: OVR hit its all-time low of $0.02546331 on January 12, 2021, during the early stages of the project's launch.
- 2021-2025: The token experienced a severe long-term decline, with a one-year price decrease of 83.17%, demonstrating significant downward pressure over the extended period.
OVR Current Market Status
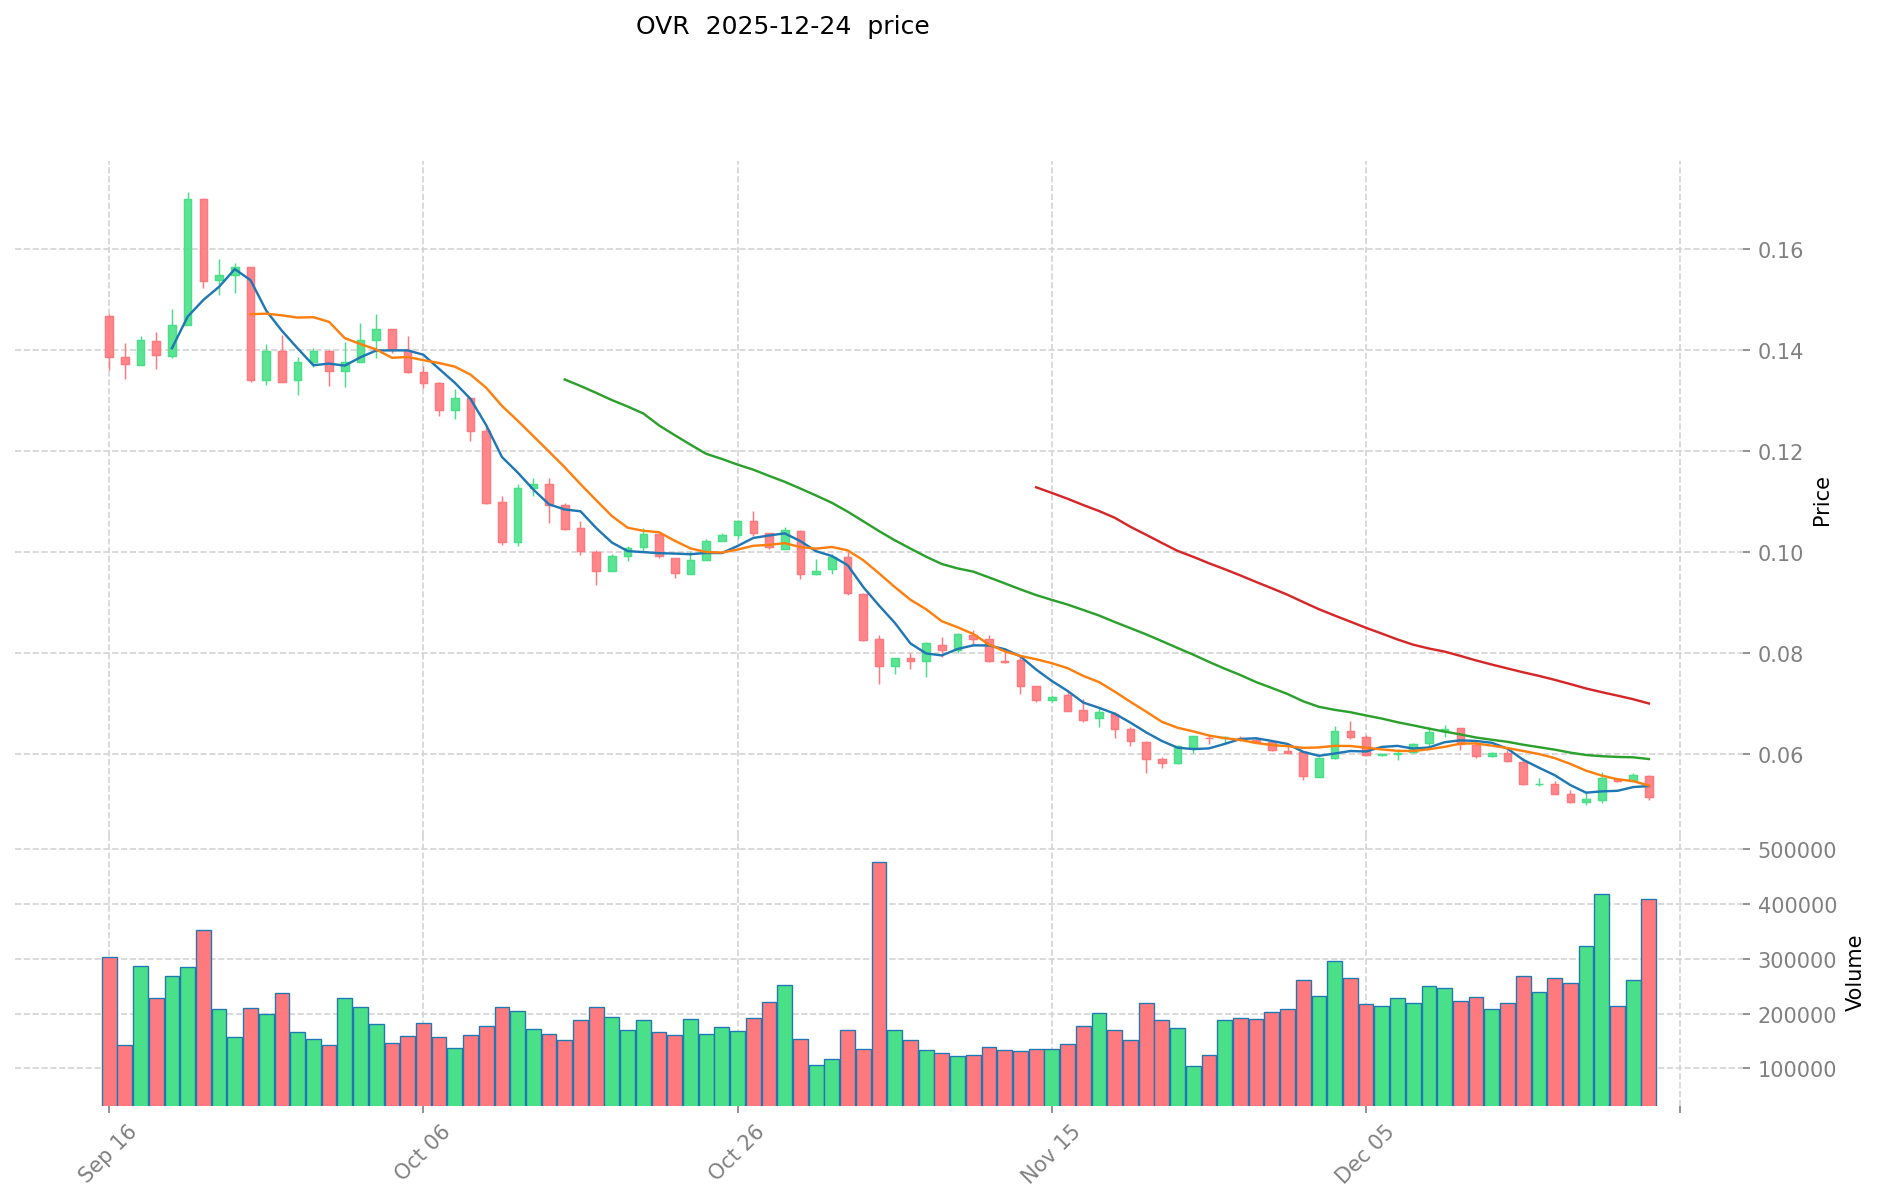
As of December 25, 2025, OVR is trading at $0.05141 per token. The token shows mixed short-term momentum with a 1-hour gain of 0.44% and a 24-hour increase of 0.19%, indicating slight upward pressure in the immediate timeframe. However, the broader trend remains negative, with a 7-day decline of 1.34% and a 30-day loss of 17.82%, reflecting continued weakness in the medium term.
OVR's circulating supply stands at 51,265,344 tokens out of a total supply of 87,793,866 tokens, representing a circulation ratio of 57.03%. The token's current market capitalization is approximately $2,635,551.33, with a fully diluted valuation of $4,513,482.65. The 24-hour trading volume totals $12,125.81, indicating modest liquidity. OVR maintains a market dominance of 0.00014%, placing it at rank 1959 in the broader cryptocurrency market.
Currently, OVR is tradeable on 4 exchanges with 16,841 token holders. The current market sentiment exhibits "Extreme Fear" (VIX: 24), reflecting heightened bearish sentiment in the broader crypto market environment.
Click to view current OVR market price
OVR Market Sentiment Index
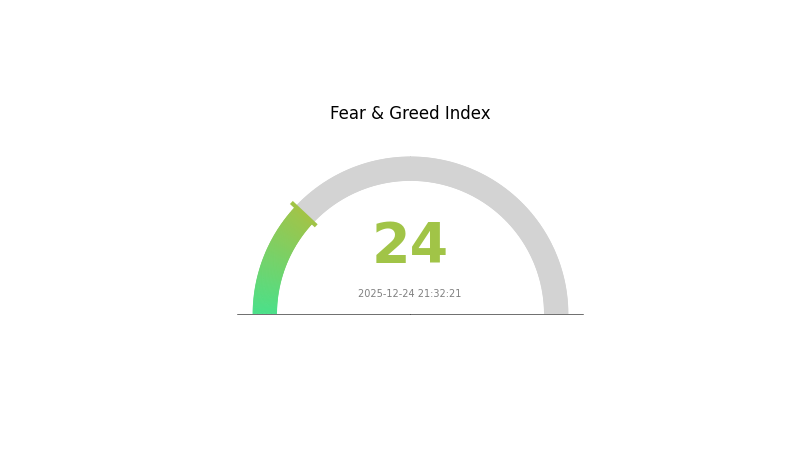
2025-12-24 Fear and Greed Index: 24 (Extreme Fear)
Click to view the current Fear & Greed Index
The crypto market is currently experiencing extreme fear, with the index at 24. This represents significant market anxiety and pessimistic sentiment among investors. Such extreme fear conditions historically present contrarian opportunities for long-term investors. When fear reaches these levels, market valuations often become disconnected from fundamental value. However, caution is advised as further downside is possible. Monitor key support levels and consider dollar-cost averaging if you have a long-term investment horizon. Visit Gate.com to track real-time market sentiment and make informed trading decisions.
OVR Holdings Distribution
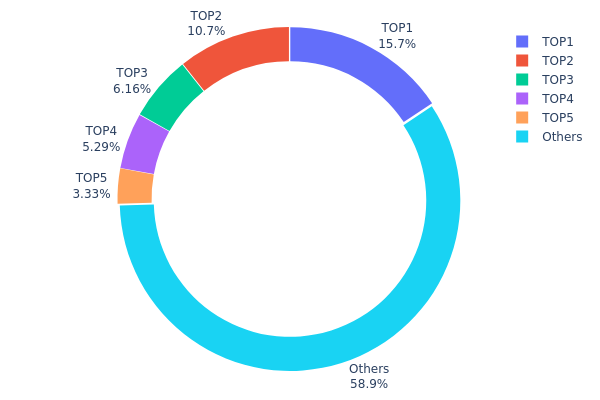
The address holdings distribution map illustrates the concentration of token ownership across the top holders and the broader holder base. This metric serves as a critical indicator for assessing the degree of decentralization, potential market manipulation risk, and the overall health of a token's distribution structure. By examining how OVR tokens are allocated among addresses, we can evaluate whether the network maintains a healthy dispersal of ownership or faces concentration risks that could impact price stability and market dynamics.
OVR demonstrates a moderately concentrated holdings structure, with the top five addresses collectively controlling approximately 41.08% of the total token supply. The leading address (0x3154...0f2c35) alone holds 15.65%, followed by the second address at 10.68%, indicating a notable concentration among major stakeholders. However, the remaining 58.92% distribution among other addresses suggests that the majority of tokens are held across a more dispersed wallet base, which partially offsets the concentration risk observed in the top tier. This bifurcated distribution pattern reflects a structure typical of maturing blockchain projects where early investors or protocol-related addresses maintain significant positions while the community gradually expands.
The current distribution presents a balanced but cautiously concentrated profile. While the top five holders represent a meaningful portion of supply, the substantial "Others" category indicates that OVR has achieved a reasonable degree of holder diversification. This distribution suggests moderate vulnerability to potential price manipulation through coordinated large holder actions, yet the presence of the diffuse holder base provides a counterbalance. For sustained market health, ongoing monitoring of these concentration metrics is advisable to track whether decentralization improves over time as the project matures and token distribution broadens.
Click to view current OVR Holdings Distribution
| Top | Address | Holding Qty | Holding (%) |
|---|---|---|---|
| 1 | 0x3154...0f2c35 | 14076.77K | 15.65% |
| 2 | 0xe372...d26d73 | 9604.20K | 10.68% |
| 3 | 0xc3f6...94c0b0 | 5533.89K | 6.15% |
| 4 | 0x0965...4ce600 | 4755.25K | 5.28% |
| 5 | 0x23e7...7fd2b1 | 2990.62K | 3.32% |
| - | Others | 52933.03K | 58.92% |
II. Core Factors Influencing OVR's Future Price
Supply Mechanism
-
Total Supply and Circulation: OVR has a total issuance of 89,893,756 tokens, with approximately 51,265,344 tokens in circulation as of October 2025, directly impacting price and investment value.
-
Historical Price Patterns: Since its launch in 2020, OVR reached an all-time high of $3.33 on December 2, 2021, demonstrating significant early investor returns. The token subsequently touched an all-time low of $0.02546331 on January 12, 2021, reflecting extreme price volatility. As of October 2025, the current price stands at approximately $0.10706, indicating substantial depreciation from its historical peak.
Institutional and Whale Dynamics
- Enterprise Adoption: OVR operates as a decentralized Augmented Reality (AR) platform that combines AR technology with blockchain, enabling users to overlay interactive digital content onto the real world. This positioning in the AR and metaverse sectors establishes OVR as a focus for investor attention within the decentralized AR platform space.
Macroeconomic Environment
-
Monetary Policy Impact: The global economic environment faces headwinds including insufficient world economic growth momentum, increased trade barriers, and divergent economic performance across major economies. Cryptocurrency markets remain sensitive to macroeconomic conditions and monetary policy adjustments by central banks.
-
Market Volatility Factors: Cryptocurrency prices are subject to multiple influences including market sentiment, macroeconomic conditions, news events, and regulatory dynamics. Even projects with strong fundamentals can experience significant price volatility.
Technology Development and Ecosystem Building
-
AR Technology Integration: OVR strengthens network performance through enhanced Augmented Reality integration, which enhances investment appeal by positioning the platform at the intersection of blockchain and AR technology.
-
Ecosystem Applications: OVR's decentralized AR platform architecture enables mainstream applications and user adoption across virtual world fusion scenarios, with long-term value dependent on technological progress, mainstream adoption, and market conditions.
III. 2025-2030 OVR Price Forecast
2025 Outlook
- Conservative Forecast: $0.0469-$0.0515
- Neutral Forecast: $0.0515-$0.0652
- Optimistic Forecast: $0.0652-$0.0768 (requires sustained platform adoption and ecosystem expansion)
2026-2028 Mid-term Outlook
- Market Stage Expectation: Gradual recovery phase with increasing institutional interest in metaverse-related assets
- Price Range Forecast:
- 2026: $0.0385-$0.0898 (24% upside potential)
- 2027: $0.0531-$0.0816 (49% upside potential)
- 2028: $0.0428-$0.1070 (54% upside potential)
- Key Catalysts: Enhanced virtual reality infrastructure development, strategic partnerships with major platforms, increased user engagement metrics, and mainstream adoption of immersive technologies
2029-2030 Long-term Outlook
- Base Case: $0.0475-$0.1220 (81% upside by 2029, driven by sustained ecosystem growth)
- Optimistic Case: $0.0560-$0.1323 (109% upside by 2030, assuming accelerated VR/AR mainstream penetration)
- Transformative Case: $0.1323+ (extraordinary conditions including breakthrough metaverse standardization, enterprise-level adoption across major industries, and integration with emerging Web3 infrastructure)
- 2030-12-25: OVR reaches $0.13234 (consolidation at mid-to-high range with 109% cumulative appreciation from baseline)
| 年份 | 预测最高价 | 预测平均价格 | 预测最低价 | 涨跌幅 |
|---|---|---|---|---|
| 2025 | 0.07676 | 0.05152 | 0.04688 | 0 |
| 2026 | 0.0898 | 0.06414 | 0.03849 | 24 |
| 2027 | 0.08159 | 0.07697 | 0.05311 | 49 |
| 2028 | 0.10703 | 0.07928 | 0.04281 | 54 |
| 2029 | 0.12203 | 0.09315 | 0.04751 | 81 |
| 2030 | 0.13234 | 0.10759 | 0.05595 | 109 |
OVR Investment Strategy and Risk Management Report
I. OVR Overview
Basic Information
OVR is a decentralized network platform designed to unite the real world and the virtual world through augmented reality (AR) technology. The platform comprises 1.6 trillion unique hexagons called OVR Land, which can be auctioned, traded, or leased in a decentralized manner. Each OVR Land is a spatial domain name (NFT) of type ERC-721, purchasable using the OVR token.
Current Market Status (as of December 25, 2025):
- Current Price: $0.05141
- 24H Change: +0.19%
- 7D Change: -1.34%
- 30D Change: -17.82%
- 1Y Change: -83.17%
- Market Cap: $2,635,551.33
- Fully Diluted Valuation: $4,513,482.65
- Circulating Supply: 51,265,344 OVR
- Total Supply: 87,793,866 OVR
- Max Supply: 89,893,756 OVR
- Market Rank: #1959
- 24H Trading Volume: $12,125.81
- Token Holders: 16,841
Project Network
- Official Website: https://www.ovr.ai/
- Blockchain: Ethereum (ETH)
- Contract Address: 0x21bfbda47a0b4b5b1248c767ee49f7caa9b23697
- Community: Twitter, Reddit, Facebook, YouTube, GitHub
II. OVR Technical Architecture and Token Mechanics
Core Technology Framework
OVR operates on the Ethereum blockchain as an ERC-721 compliant token, ensuring compatibility and security within the decentralized ecosystem. The platform's AR-based spatial mapping creates digital real estate opportunities through hexagon-based land divisions.
Token Economics
- Token Standard: ERC-721
- Circulating Supply Ratio: 57.03% of total supply
- Distribution Status: Active circulation among 16,841 token holders
III. Market Performance Analysis
Price Trajectory
| Timeframe | Change Percentage | Change Amount |
|---|---|---|
| 1H | +0.44% | +$0.000225 |
| 24H | +0.19% | +$0.000097 |
| 7D | -1.34% | -$0.000698 |
| 30D | -17.82% | -$0.011148 |
| 1Y | -83.17% | -$0.254056 |
Historical Price Levels
- All-Time High: $3.33 (December 2, 2021)
- All-Time Low: $0.02546331 (January 12, 2021)
- 24H High: $0.05173
- 24H Low: $0.05088
IV. OVR Professional Investment Strategy and Risk Management
OVR Investment Methodology
(1) Long-Term Holding Strategy
-
Target Investors: Technology-focused investors with high risk tolerance, believers in AR/VR metaverse adoption, and investors seeking exposure to spatial computing platforms.
-
Operational Guidelines:
- Accumulate OVR tokens during market downturns, particularly when prices show significant weekly or monthly declines.
- Hold for minimum 12-24 months to benefit from potential AR ecosystem expansion and adoption growth.
- Reinvest any transaction rewards or distributions back into the position to compound returns.
- Monitor quarterly updates on OVR Land usage metrics and AR platform adoption rates.
-
Storage Solutions:
- For long-term holdings, utilize Gate.com's Web3 wallet for secure custody of ERC-721 NFT assets.
- Enable two-factor authentication and withdrawal whitelisting for enhanced account security.
- Consider hardware wallet backups for positions exceeding $10,000 equivalent value.
(2) Active Trading Strategy
-
Technical Analysis Tools:
- Moving Averages (MA): Utilize 20-day and 50-day MAs to identify trend reversals; trading signals emerge when short-term MA crosses long-term MA.
- Relative Strength Index (RSI): Monitor RSI levels; values below 30 indicate oversold conditions (potential buy signal), while levels above 70 suggest overbought conditions (potential sell signal).
- MACD (Moving Average Convergence Divergence): Track histogram divergence from the signal line to confirm momentum shifts and entry/exit opportunities.
-
Wave Trading Key Points:
- Execute buy orders during 20-30% downward corrections from recent highs, capturing mean reversion opportunities.
- Set profit-taking levels at 15-25% gains from entry points to secure gains in volatile market conditions.
- Maintain stop-loss orders at 8-10% below entry prices to limit downside exposure and preserve capital.
- Trade during high-volume periods (typically 16:00-20:00 UTC) when liquidity on Gate.com is highest.
OVR Risk Management Framework
(1) Asset Allocation Principles
- Conservative Investors: 1-2% of total portfolio allocation to OVR tokens, focusing on dollar-cost averaging over 6-12 months.
- Aggressive Investors: 3-7% of portfolio exposure, allowing for tactical increases during market corrections below $0.04.
- Professional Investors: 5-15% specialized allocation within emerging technology subsectors, with hedging strategies against overall crypto market volatility.
(2) Risk Mitigation Strategies
- Portfolio Diversification: Balance OVR holdings with established Layer-1 cryptocurrencies and stablecoins; maintain 60% defensive positions (BTC, ETH, stablecoins) alongside 40% growth-oriented altcoin exposure.
- Dollar-Cost Averaging (DCA): Execute fixed-amount purchases monthly or quarterly regardless of price volatility, reducing timing risk and accumulating at average prices.
(3) Secure Storage Solutions
- Custodial Wallet Option: Gate.com Web3 wallet provides institutional-grade security for active trading with convenient interface and rapid transaction settlement; ideal for positions requiring frequent liquidity.
- Non-Custodial Storage: For long-term holdings exceeding one year, consider transferring to self-custody solutions with hardware backup for complete asset control and elimination of counterparty risk.
- Security Safeguards: Never share private keys or seed phrases; enable all available security features including IP whitelisting, email verification, and withdrawal address whitelisting on Gate.com; maintain offline backups of critical account recovery information.
V. OVR Potential Risks and Challenges
Market Risks
- Extreme Volatility: OVR exhibits significant price swings, evidenced by 83% annual decline and 17.82% monthly decrease; low market liquidity ($12,125 daily volume) amplifies price impact of large trades.
- Limited Market Adoption: With only 16,841 token holders and relatively low trading volume, OVR faces challenges in achieving mainstream adoption; the project's success depends heavily on AR technology breakthrough and user acquisition.
- Competitive Pressure: AR/VR metaverse space features well-funded competitors with larger user bases and more developer ecosystems; OVR must differentiate through unique utility or superior user experience to capture market share.
Regulatory Risks
- Classification Uncertainty: Ongoing global regulatory ambiguity regarding NFT and metaverse asset classification creates potential for adverse legal determinations affecting token valuation and transferability.
- Jurisdiction-Specific Restrictions: Various countries implement stricter controls on cryptocurrency and digital asset transactions; regulatory changes could limit OVR's geographic market access or operational capabilities.
- Tax Compliance Complexity: NFT and AR platform revenue streams present complex tax implications requiring expert guidance; regulatory authorities may impose retroactive compliance requirements.
Technology Risks
- Smart Contract Vulnerabilities: ERC-721 implementation relies on Ethereum network security; potential smart contract bugs or exploits could compromise OVR Land NFT integrity or token transfer mechanisms.
- AR Technology Integration: Platform success depends on seamless AR implementation; technical barriers to mainstream AR adoption or incompatibility with emerging AR standards could limit user adoption.
- Scalability Constraints: Ethereum network congestion periods result in elevated transaction fees and reduced accessibility for smaller OVR Land transactions, limiting platform utility.
VI. Conclusion and Action Recommendations
OVR Investment Value Assessment
OVR represents a speculative investment thesis centered on augmented reality technology adoption and spatial computing's future role in digital ecosystems. The platform's innovative hexagon-based spatial domain model offers unique value proposition, yet faces significant execution risks. Current valuation reflects market skepticism, evidenced by 83% annual decline from peak prices. Long-term viability depends on demonstrating substantial user adoption, meaningful OVR Land transaction volume, and sustainable ecosystem development. Near-term price discovery likely continues amid limited liquidity and broader crypto market sentiment shifts.
OVR Investment Recommendations
✅ Beginners: Allocate only 0.5-1% portfolio exposure through Gate.com spot trading; use dollar-cost averaging strategy with $50-100 monthly purchases; focus on learning AR ecosystem fundamentals before increasing position size.
✅ Experienced Investors: Consider 3-5% tactical allocation with selective entry during -15% to -20% weekly declines; implement 8-10% stop-loss orders and 15-25% profit-taking targets; monitor quarterly OVR Land sales metrics and ecosystem development announcements.
✅ Institutional Investors: Structure 5-15% specialized allocation within emerging technology funds; establish direct relationships with OVR protocol development team to gain insight into technology roadmap; combine with complementary AR/VR ecosystem investments for concentrated sector exposure.
OVR Trading Participation Methods
- Spot Trading on Gate.com: Execute direct OVR/USDT or OVR/ETH trades with flexible entry/exit timing; suitable for investors wanting simple exposure without leverage complications.
- Limit Orders: Place buy limit orders at 10-15% below current market price to accumulate positions during consolidation periods; use sell limit orders at 20-25% above entry for systematic profit-taking.
- Portfolio Rebalancing: Periodically review OVR allocation against target percentages; trim positions after 30% appreciation phases and reinvest into underweight assets to maintain risk-adjusted allocation.
Cryptocurrency investment carries extreme risk. This report does not constitute investment advice. Investors must make decisions aligned with personal risk tolerance and financial circumstances. Consultation with professional financial advisors is strongly recommended. Never invest capital you cannot afford to lose completely.
FAQ
What is OVR crypto?
OVR is the decentralized infrastructure token for an AR metaverse platform. It merges physical and virtual worlds through augmented reality technology, enabling users to create, share, and monetize immersive AR experiences on a blockchain-based ecosystem.
What factors could influence OVR price in the future?
OVR price is influenced by market sentiment, trading volume, technological developments, metaverse adoption rates, platform upgrades, and broader cryptocurrency market trends. Growing user engagement and ecosystem expansion will likely drive positive price momentum.
How does OVR compare to other metaverse and VR-related cryptocurrencies?
OVR distinguishes itself through geolocalized AR and VR experiences built on Ethereum blockchain, emphasizing real-world location integration. Unlike other metaverse tokens, OVR focuses on immersive, location-aware interactions, creating unique value in the VR-related cryptocurrency ecosystem.
What is the historical price performance of OVR token?
OVR token has demonstrated dynamic market movement. Currently priced at $0.0510, it shows an 8.48% increase in recent performance, ranking 1488 in overall market cap. Historical data reveals OVR's volatility and growth potential within the metaverse sector.
What are the risks associated with OVR price prediction?
OVR price prediction involves market volatility, liquidity risks, and technical analysis limitations. Factors like regulatory changes, market sentiment shifts, and trading volume fluctuations can significantly impact prediction accuracy and actual price movements.
Share
Content
Introduction: Market Position and Investment Value of OVR
I. OVR Price History Review and Current Market Status
II. Core Factors Influencing OVR's Future Price
III. 2025-2030 OVR Price Forecast
I. OVR Overview
II. OVR Technical Architecture and Token Mechanics
III. Market Performance Analysis
IV. OVR Professional Investment Strategy and Risk Management
V. OVR Potential Risks and Challenges
VI. Conclusion and Action Recommendations
FAQ
How to Buy Cryptocurrency


Trending Cryptocurrencies


BZZ vs MANA: Comparing Decentralized Digital Assets for Web3 Ecosystem Growth

2025 APE Price Prediction: Bullish Outlook as NFT Market Matures and Metaverse Adoption Grows
2025 NFT Price Prediction: The Evolution of Digital Asset Valuations in a Maturing Ecosystem

Is Adventure Gold (AGLD) a Good Investment?: Analyzing the Long-Term Potential of this Gaming Token in the NFT Ecosystem
Is Ultiverse (ULTI) a good investment?: Analyzing the potential and risks of this metaverse token

2025 RARE Price Prediction: Analysis of Growth Potential and Market Factors Impacting Token Value

How to Stake Chainlink: A Step-by-Step Guide to LINK Staking

AlphaArena Model Launch: How AI is Redefining Crypto Trading with Real-World Benchmarks

How to Participate in Chainlink Airdrop

SpaceX Transfers $105 Million in Bitcoin to Unmarked Wallets

Why Do We Celebrate Bitcoin Pizza Day?