2025 NFT Price Prediction: The Evolution of Digital Asset Valuations in a Maturing Ecosystem
Introduction: NFT's Market Position and Investment Value
APENFT (NFT), as a foundation dedicated to NFT and blockchain-based art, has made significant strides since its inception in 2021. As of 2025, APENFT's market capitalization has reached $435,448,479, with a circulating supply of approximately 990,105,682,877,398 tokens, and a price hovering around $0.0000004398. This asset, often referred to as a "bridge between art and blockchain," is playing an increasingly crucial role in the digitization and tokenization of top-tier artworks.
This article will provide a comprehensive analysis of APENFT's price trends from 2025 to 2030, considering historical patterns, market supply and demand, ecosystem development, and macroeconomic factors, offering professional price predictions and practical investment strategies for investors.
I. NFT Price History Review and Current Market Status
NFT Historical Price Evolution
- 2021: APENFT Foundation officially established, price reached all-time high of $0.00000753
- 2023: Market downturn, price dropped to all-time low of $0.000000298737
- 2025: Market recovery, price stabilized around $0.0000004398
NFT Current Market Situation
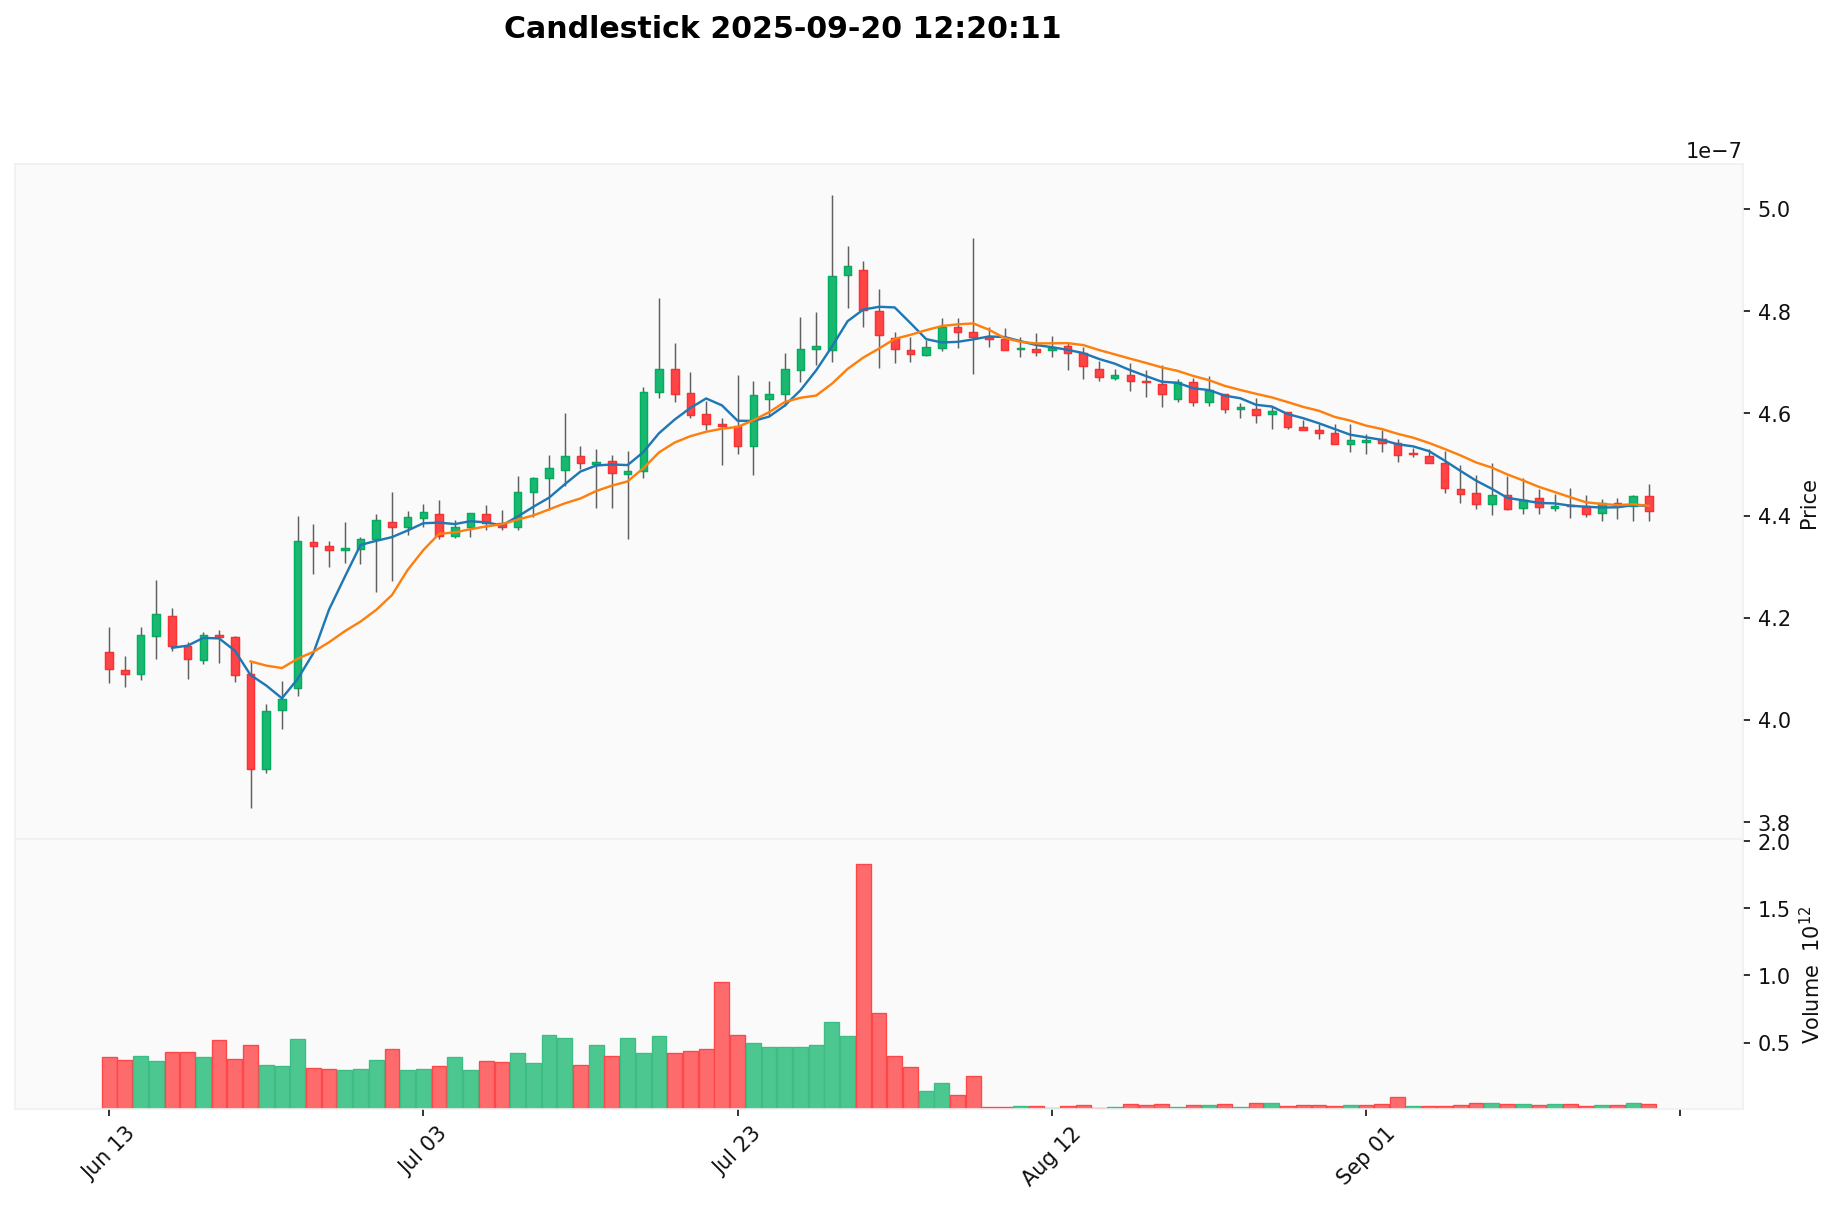
As of September 20, 2025, APENFT (NFT) is trading at $0.0000004398. The token has shown mixed performance across different timeframes. In the past 24 hours, NFT has experienced a slight decline of 0.24%. The 7-day and 30-day trends also indicate downward movements of 0.52% and 5.050% respectively. However, the 1-year performance shows a positive growth of 6.43%, suggesting a long-term upward trajectory.
The current market capitalization of APENFT stands at $435,448,479, ranking it 191st in the global cryptocurrency market. With a circulating supply of 990,105,682,877,398 NFT tokens and a total supply of 999,990,000,000,000, the project has a circulation ratio of 99.01%.
Trading volume in the last 24 hours reached $18,569, indicating moderate market activity. The token's price is currently far from its all-time high of $0.00000753, recorded on September 5, 2021, but has shown significant recovery from its all-time low of $0.000000298737 on June 10, 2023.
Click to view the current NFT market price
NFT Market Sentiment Indicator
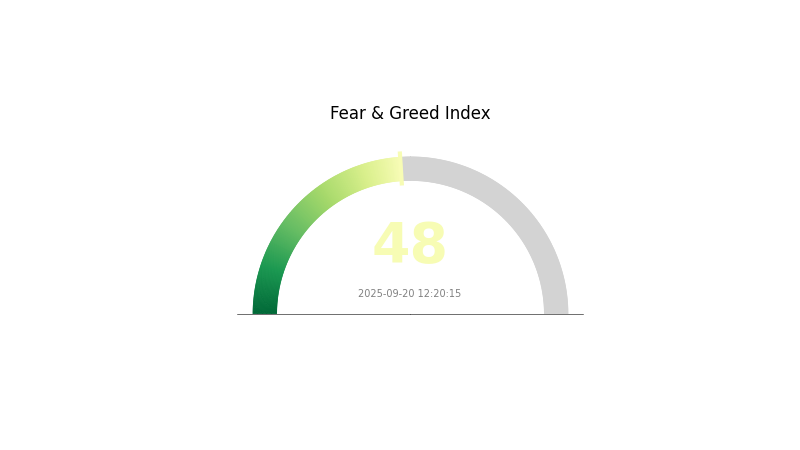
2025-09-20 Fear and Greed Index: 48 (Neutral)
Click to view the current Fear & Greed Index
The NFT market sentiment remains balanced as the Fear and Greed Index hovers at 48, indicating a neutral stance. This equilibrium suggests investors are neither overly fearful nor excessively greedy. While caution persists, there's also optimism in the air. Traders should stay vigilant, as this neutral zone often precedes significant market movements. Keep an eye on emerging trends and project fundamentals to make informed decisions in this dynamic NFT landscape.
NFT Holdings Distribution
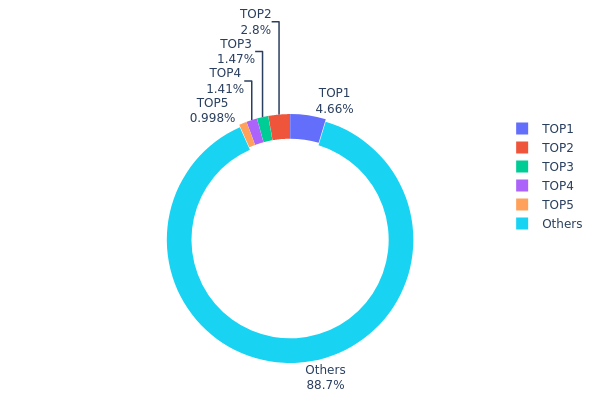
The address holdings distribution data provides insight into the concentration of NFT ownership within the market. Based on the provided data, we observe a relatively decentralized distribution pattern. The top address holds 4.65% of the total supply, followed by 2.80% for the second-largest holder. The top 5 addresses collectively account for approximately 11.31% of the total NFT supply, while the remaining 88.69% is distributed among other addresses.
This distribution suggests a moderate level of decentralization, with no single address holding a dominant position. The absence of excessive concentration among top holders indicates a reduced risk of market manipulation by individual large stakeholders. However, the presence of several addresses holding over 1% each still warrants attention, as coordinated actions by these larger holders could potentially influence market dynamics.
Overall, the current address distribution reflects a relatively healthy market structure with a good balance between larger stakeholders and a wide base of smaller holders. This distribution pattern contributes to market stability and reduces the likelihood of severe price volatility caused by the actions of a few dominant players.
Click to view the current NFT Holdings Distribution
| Top | Address | Holding Qty | Holding (%) |
|---|---|---|---|
| 1 | TPyjyZ...kgNan5 | 46598986588.07K | 4.65% |
| 2 | TAA7Uj...RfK8QA | 28036478575.09K | 2.80% |
| 3 | TP1V18...gHtWHZ | 14725839828.61K | 1.47% |
| 4 | TM3sTV...rKDt7b | 14086222012.69K | 1.40% |
| 5 | TUjx6w...3WmJTZ | 9975516375.70K | 0.99% |
| - | Others | 886566956619.84K | 88.69% |
II. Key Factors Influencing Future NFT Prices
Supply Mechanism
- Token Distribution: APENFT has a total supply of 999,990,000,000,000 tokens, with the entire supply currently in circulation.
- Historical Patterns: The large supply has historically led to low individual token prices, with the current price at $0.00000044 USD.
- Current Impact: The fully diluted supply may continue to exert downward pressure on the token price, unless demand increases significantly.
Institutional and Whale Dynamics
- Corporate Adoption: APENFT has partnerships in the art and collectibles space, which could influence future demand.
- National Policies: Regulatory approaches to NFTs and digital assets vary by country, potentially impacting APENFT's global adoption.
Macroeconomic Environment
- Inflation Hedging Properties: As a digital asset, APENFT may be viewed as an alternative investment during inflationary periods.
- Geopolitical Factors: Global economic uncertainties and shifts in digital asset regulations can affect APENFT's market performance.
Technical Development and Ecosystem Building
- Multichain Presence: APENFT operates on multiple blockchains including Ethereum, BNB Smart Chain, HECO, and TRON, enhancing its accessibility.
- NFT Market Integration: APENFT's focus on art and collectibles aligns with the growing NFT market, potentially driving future ecosystem growth.
III. NFT Price Predictions for 2025-2030
2025 Outlook
- Conservative prediction: $1,000 - $1,500
- Neutral prediction: $1,500 - $2,000
- Optimistic prediction: $2,000 - $2,500 (requires widespread adoption in mainstream industries)
2027-2028 Outlook
- Market stage expectation: Consolidation and maturation phase
- Price range forecast:
- 2027: $2,500 - $3,500
- 2028: $3,500 - $4,500
- Key catalysts: Integration with virtual reality, expanded use in gaming and digital identity
2030 Long-term Outlook
- Base scenario: $5,000 - $7,000 (assuming steady growth in adoption and use cases)
- Optimistic scenario: $7,000 - $9,000 (assuming breakthrough applications in real estate and intellectual property)
- Transformative scenario: $9,000 - $12,000 (assuming NFTs become standard for digital ownership across multiple industries)
- 2030-12-31: NFT Index $10,000 (reflecting a 45% increase from 2025 levels)
| 年份 | 预测最高价 | 预测平均价格 | 预测最低价 | 涨跌幅 |
|---|---|---|---|---|
| 2025 | 0 | 0 | 0 | 0 |
| 2026 | 0 | 0 | 0 | 5 |
| 2027 | 0 | 0 | 0 | 14 |
| 2028 | 0 | 0 | 0 | 20 |
| 2029 | 0 | 0 | 0 | 25 |
| 2030 | 0 | 0 | 0 | 45 |
IV. Professional NFT Investment Strategies and Risk Management
NFT Investment Methodology
(1) Long-term Holding Strategy
- Suitable for: Long-term value investors
- Operation suggestions:
- Identify high-quality NFT projects with strong fundamentals
- Focus on blue-chip NFTs with proven track records
- Use secure cold storage solutions for long-term holdings
(2) Active Trading Strategy
- Technical analysis tools:
- Volume indicators: Monitor trading activity and liquidity
- Price charts: Identify trends and support/resistance levels
- Key points for swing trading:
- Set clear entry and exit points
- Use stop-loss orders to manage risk
NFT Risk Management Framework
(1) Asset Allocation Principles
- Conservative investors: 5-10%
- Aggressive investors: 15-25%
- Professional investors: 30-40%
(2) Risk Hedging Solutions
- Diversification: Spread investments across different NFT categories
- Dollar-cost averaging: Regularly invest fixed amounts to reduce timing risk
(3) Secure Storage Solutions
- Hot wallet recommendation: Gate Web3 Wallet
- Cold storage solution: Hardware wallets for large holdings
- Security precautions: Use multi-factor authentication and backup private keys
V. Potential Risks and Challenges of NFTs
NFT Market Risks
- High volatility: Prices can fluctuate dramatically
- Liquidity risk: Some NFTs may be difficult to sell quickly
- Market saturation: Oversupply of NFTs may dilute value
NFT Regulatory Risks
- Uncertain legal status: Regulations vary by jurisdiction
- Tax implications: Unclear tax treatment in many countries
- Copyright issues: Potential for intellectual property disputes
NFT Technical Risks
- Smart contract vulnerabilities: Potential for hacks or exploits
- Blockchain scalability: Network congestion can lead to high fees
- Interoperability challenges: Limited cross-chain functionality
VI. Conclusion and Action Recommendations
NFT Investment Value Assessment
NFTs offer long-term potential for digital asset ownership and creative monetization, but short-term risks include market volatility and regulatory uncertainty.
NFT Investment Recommendations
✅ Beginners: Start with small investments in established NFT projects ✅ Experienced investors: Diversify across different NFT categories and platforms ✅ Institutional investors: Focus on blue-chip NFTs and consider fractionalized ownership
NFT Participation Methods
- Direct purchases: Buy NFTs on reputable marketplaces
- NFT-backed tokens: Invest in tokens representing fractionalized NFT ownership
- NFT-focused investment funds: Gain exposure through professionally managed portfolios
Cryptocurrency investments carry extremely high risk. This article does not constitute investment advice. Investors should make decisions based on their own risk tolerance and are advised to consult professional financial advisors. Never invest more than you can afford to lose.
FAQ
How much is NFT worth in 2025?
In 2025, the NFT market is projected to be worth $44.1 billion, driven by growth in gaming and utility-focused projects.
What will be the value of NFT in 2030?
The NFT market is projected to reach $232 billion by 2030, growing from $15.70 billion in 2021 at a CAGR of over 50%.
What is the future prediction of NFT?
NFTs are expected to evolve, with increased utility and integration in virtual worlds. Market growth is likely, driven by digital art, gaming, and metaverse applications. However, specific price predictions remain uncertain.
Will NFTs boom again?
Yes, NFTs are likely to boom again. Market trends and technological advancements suggest a significant revival by 2025, with renewed interest and high-profile sales indicating strong potential for growth in the NFT space.
Share
Content
Introduction: NFT's Market Position and Investment Value
I. NFT Price History Review and Current Market Status
II. Key Factors Influencing Future NFT Prices
III. NFT Price Predictions for 2025-2030
IV. Professional NFT Investment Strategies and Risk Management
V. Potential Risks and Challenges of NFTs
VI. Conclusion and Action Recommendations
FAQ

