Trade
Basic
Futures
Futures
Hundreds of contracts settled in USDT or BTC
Options
HOT
Trade European-style vanilla options
Unified Account
Maximize your capital efficiency
Demo Trading
Futures Kickoff
Get prepared for your futures trading
Futures Events
Participate in events to win generous rewards
Demo Trading
Use virtual funds to experience risk-free trading
Earn
Launch
CandyDrop
Collect candies to earn airdrops
Launchpool
Quick staking, earn potential new tokens
HODLer Airdrop
Hold GT and get massive airdrops for free
Launchpad
Be early to the next big token project
Alpha Points
NEW
Trade on-chain assets and enjoy airdrop rewards!
Futures Points
NEW
Earn futures points and claim airdrop rewards
Investment
Simple Earn
Earn interests with idle tokens
Auto-Invest
Auto-invest on a regular basis
Dual Investment
Buy low and sell high to take profits from price fluctuations
Soft Staking
Earn rewards with flexible staking
Crypto Loan
0 Fees
Pledge one crypto to borrow another
Lending Center
One-stop lending hub
VIP Wealth Hub
Customized wealth management empowers your assets growth
Private Wealth Management
Customized asset management to grow your digital assets
Quant Fund
Top asset management team helps you profit without hassle
Staking
Stake cryptos to earn in PoS products
Smart Leverage
NEW
No forced liquidation before maturity, worry-free leveraged gains
GUSD Minting
Use USDT/USDC to mint GUSD for treasury-level yields
More
MaxFINEancial
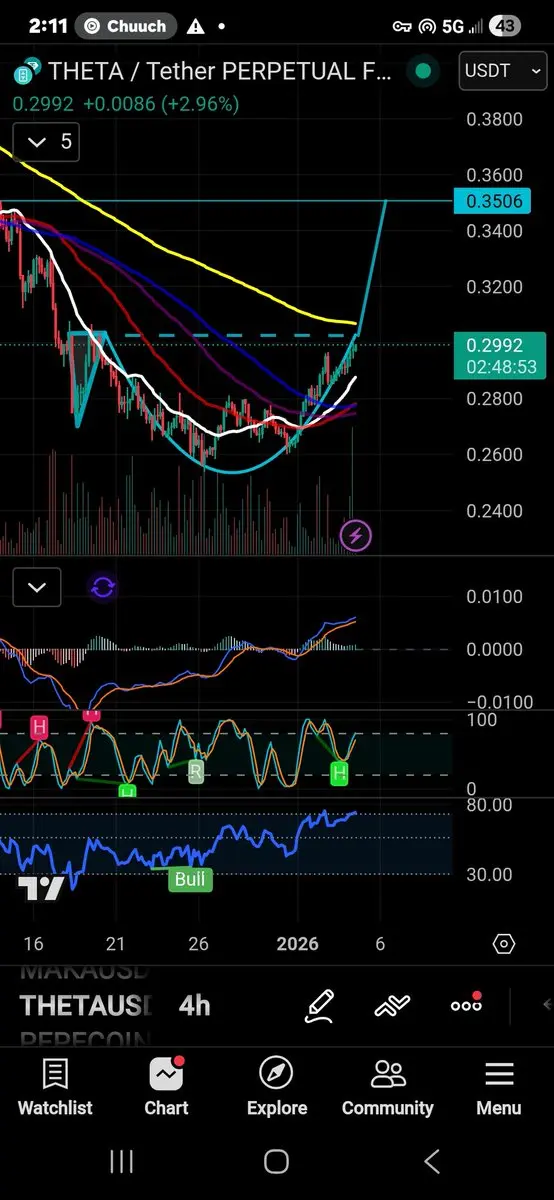
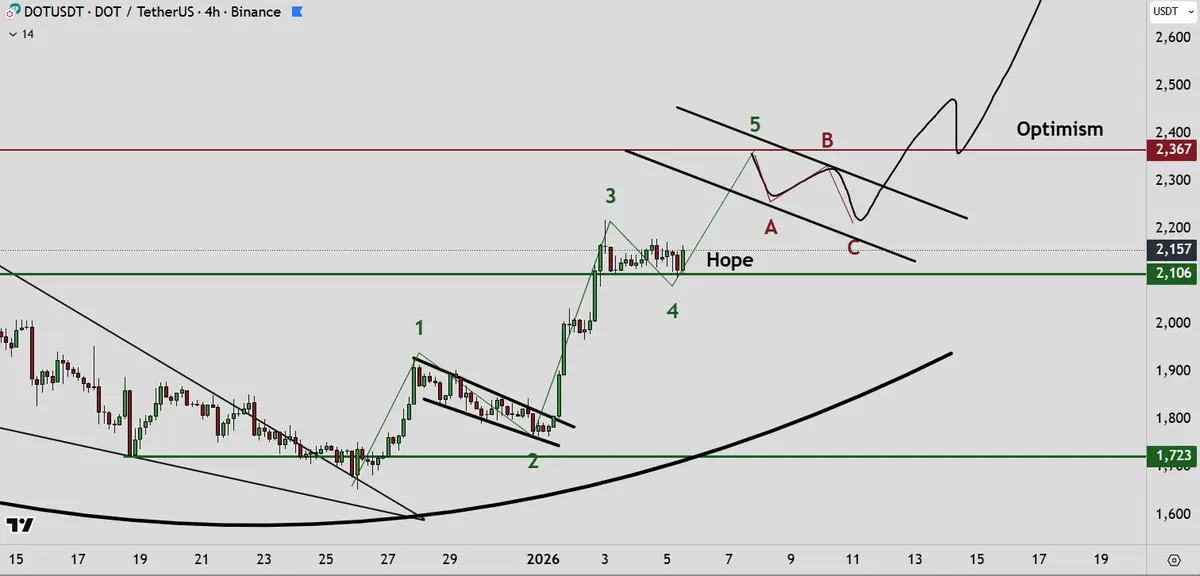
$THETA Preparing For Breakout!?
Adam and Eve Double Bottom Reversal Formation!?
Price action just below 4hr 200MA. Seeing this same formation in the MA'S.
This volume candle is the largest green volume cande in the entire pattern.
Right near the breakout!?
$THETA Targets
1) 0.3506 or +(16.86%)
Price action gets bullish over that hashed blue line. Thats the trigger line of the Adam and Eve double bottom.
MACD is bullish pointing upwards in the bullish area of the indicator showing an increase of buying pressure.
Hidden bullish divergence on the stochastic RSI. About to get in the overbought r
THETA7,51%
- Reward
- like
- Comment
- Repost
- Share
#GateNewTokenWatch
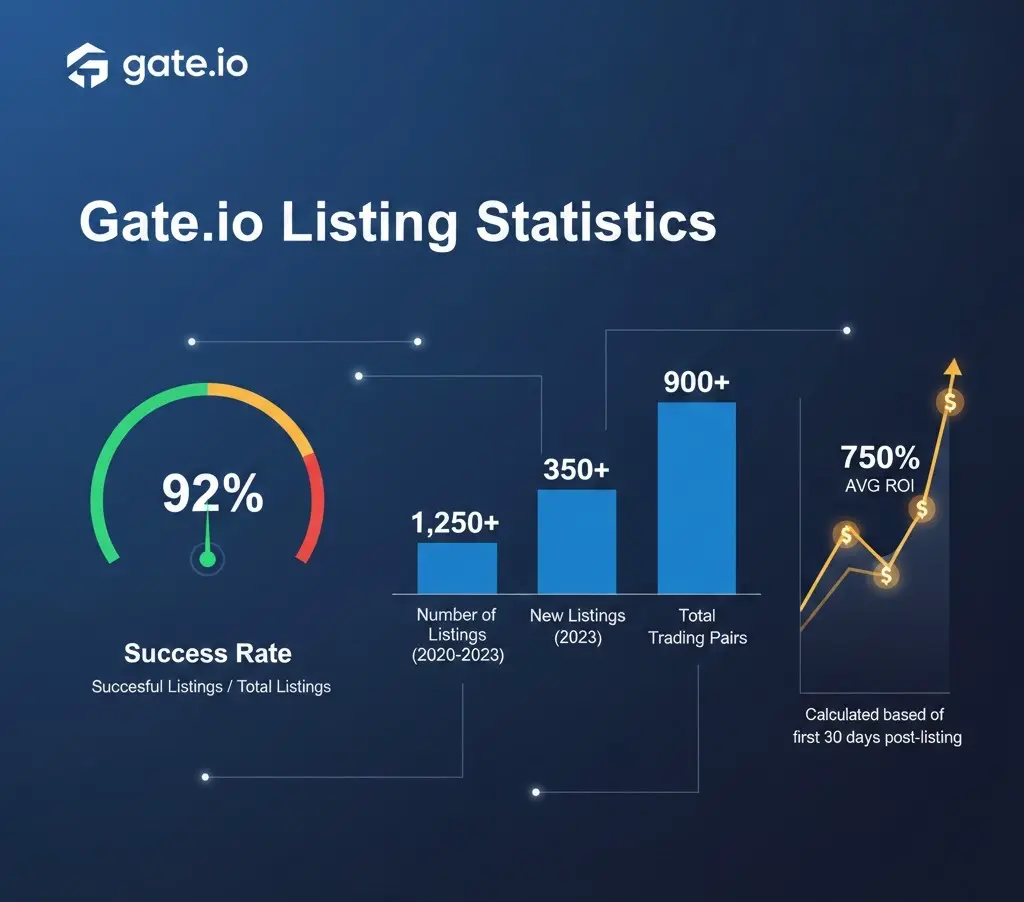
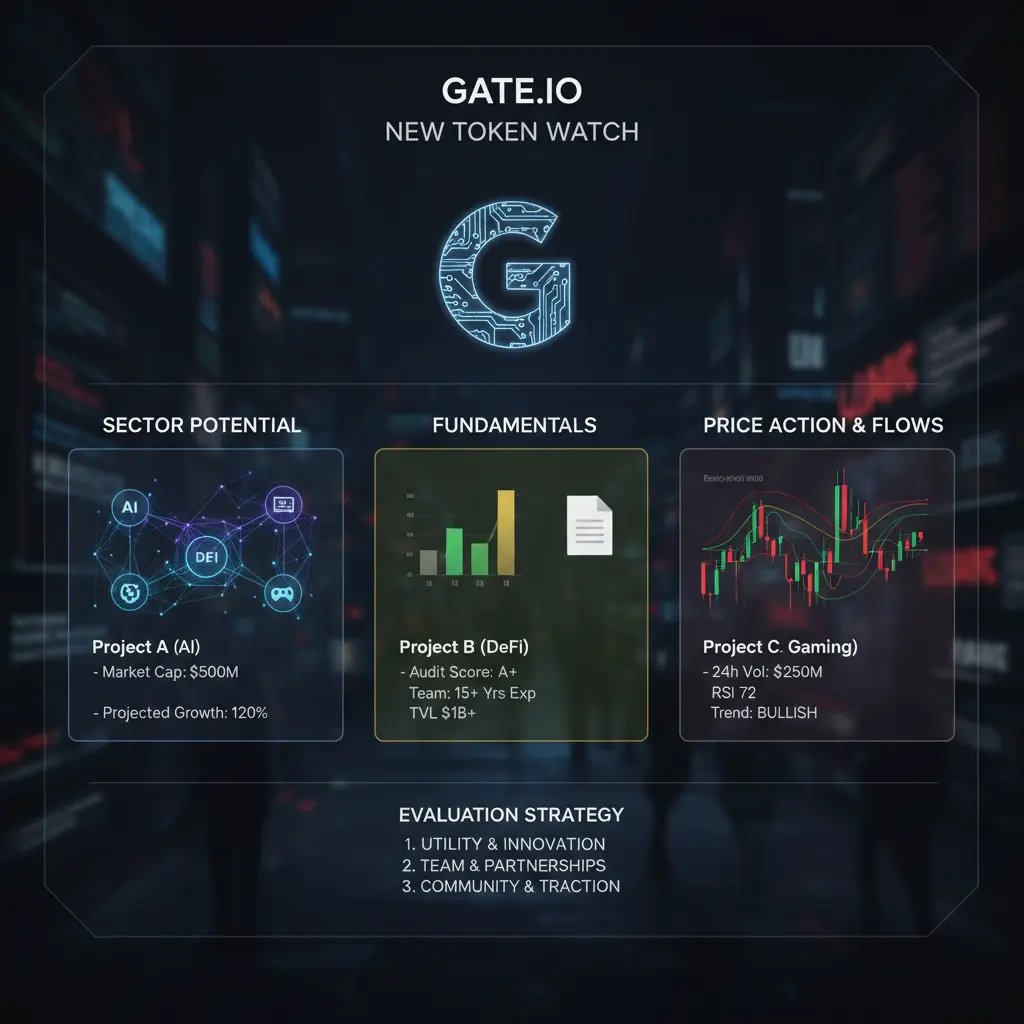
Gate io is widely known for its strategy of being the first major CEX to list cryptocurrencies with low market cap, meme coins, and experimental infrastructures. By early 2026, the strategy for these listings has shifted towards high-utility narratives and AI agent ecosystems.
Here's a summary of the projects I'm currently following and how I'm evaluating the new listings:
1. Projects on the Radar (January 2026) Based on recent listing activity and "Gate Startup" (IEO) trends, the areas attracting high interest are:
AI Agent Ecosystems: Projects like Virtuals Protocol (VIRT

- Reward
- 29
- 19
- Repost
- Share
YamahaBlue:
Happy New Year! 🤑View More


- Reward
- 1
- 1
- Repost
- Share
LuuDanhVu:
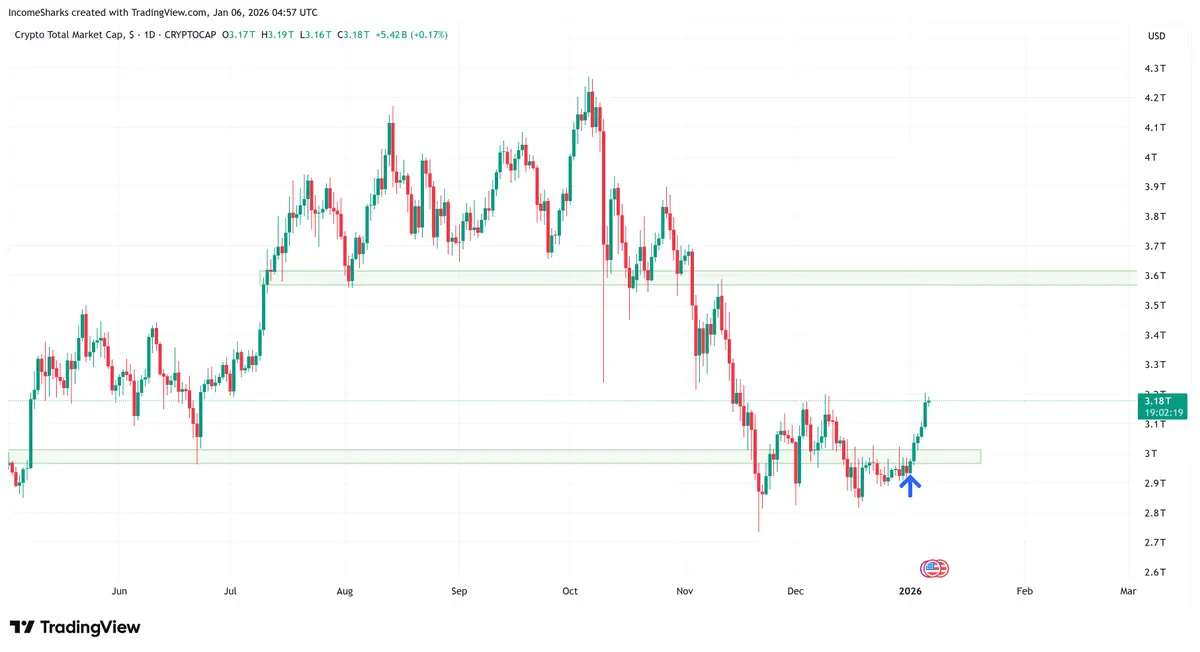
Happy New Year! 🤑250 billion dollars added to Crypto since January 1st.
- Reward
- like
- Comment
- Repost
- Share
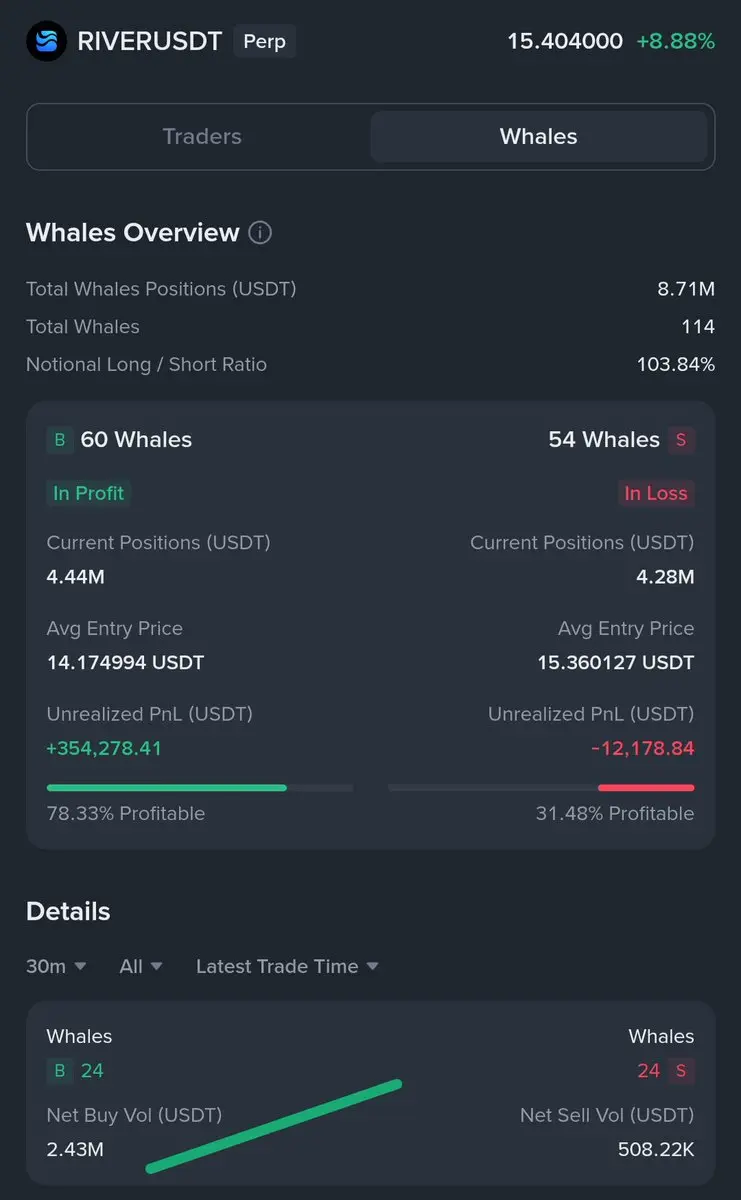
JUST IN: $RIVER Update guy📢📢
In the last 30 minutes, a big whale has🐋 entered and has now taken over a 50%+ position.
Everyone, stay alert and trade carefully ⚠️🐳
In the last 30 minutes, a big whale has🐋 entered and has now taken over a 50%+ position.
Everyone, stay alert and trade carefully ⚠️🐳
- Reward
- like
- Comment
- Repost
- Share
Gate Live Streamer Growth Path https://www.gate.com/campaigns/3643?ref=VVNHBAXDBQ&ref_type=132

- Reward
- 12
- 13
- Repost
- Share
MissCrypto:
Watching Closely 🔍️View More
#2025GateYearEndSummary Bitcoin and Ethereum continue to act as the core pillars of the crypto market, and current signals suggest a phase of strategic positioning rather than impulsive expansion. For Bitcoin, price structure remains dominant, holding above key long-term moving averages that historically separate bull markets from corrective cycles. Momentum indicators show consolidation after prior volatility, often interpreted as smart money accumulation. Volume behavior hints that sellers are weakening, while buyers are stepping in gradually, building a base for the next directional move.
F
F
- Reward
- 1
- 2
- Repost
- Share
LisaCrypto:
2026 GOGOGO 👊View More
SOL technical outlook ,Solana continues to attract strong attention as one of the leading Layer-1 networks in the market. From a technical perspective, SOL is currently trading in a zone where trend strength, consolidation, and potential expansion all intersect. This makes it an important asset to watch closely.
Market Structure
On higher timeframes, SOL maintains a constructive structure as long as it holds above its major demand zones. Price action suggests the market is digesting previous moves rather than entering a distribution phase. This often happens before the next directional push.
H
Market Structure
On higher timeframes, SOL maintains a constructive structure as long as it holds above its major demand zones. Price action suggests the market is digesting previous moves rather than entering a distribution phase. This often happens before the next directional push.
H
SOL1,57%

- Reward
- 8
- 12
- Repost
- Share
TRK41 :
:
Happy New Year! 🤑View More
- Reward
- 10
- 10
- Repost
- Share
RebalanceCapital :
:
Sure, brother.View More
- Reward
- 1
- Comment
- Repost
- Share
⚠️ #TrumpLaunchesStrikesOnVenezuela
Rising news and claims about possible U.S. military action involving Venezuela have pushed geopolitics back into the global spotlight. Whether it’s confirmed action or strong political signaling, such developments remind us how fast global dynamics can shift.
🌍 Why it matters • Venezuela is key to energy markets, sanctions, and regional politics
• Any escalation can impact oil prices, emerging markets, and risk sentiment
• Even headlines alone can move markets before real action happens
📊 Bigger picture Geopolitical events often trigger short-term volatili
- Reward
- 6
- 3
- Repost
- Share
LittleGodOfWealthPlutus :
:
2026 Prosperity Prosperity😘View More
$BTC
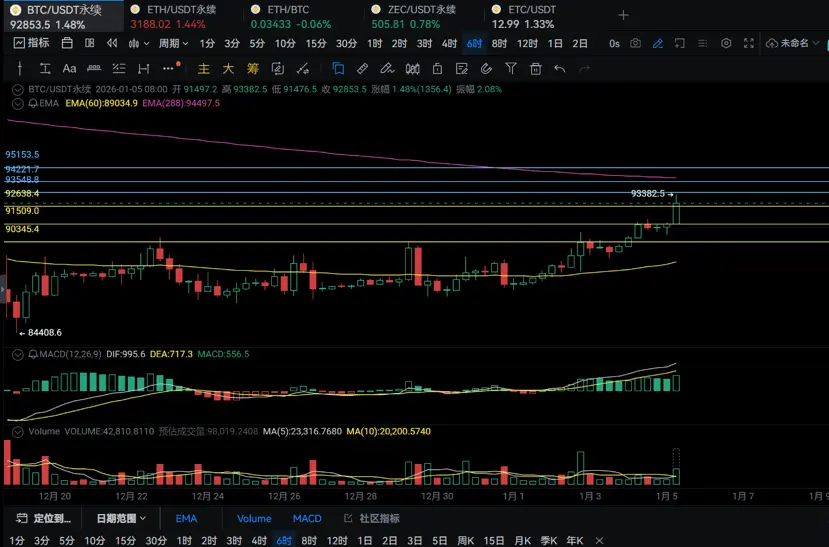
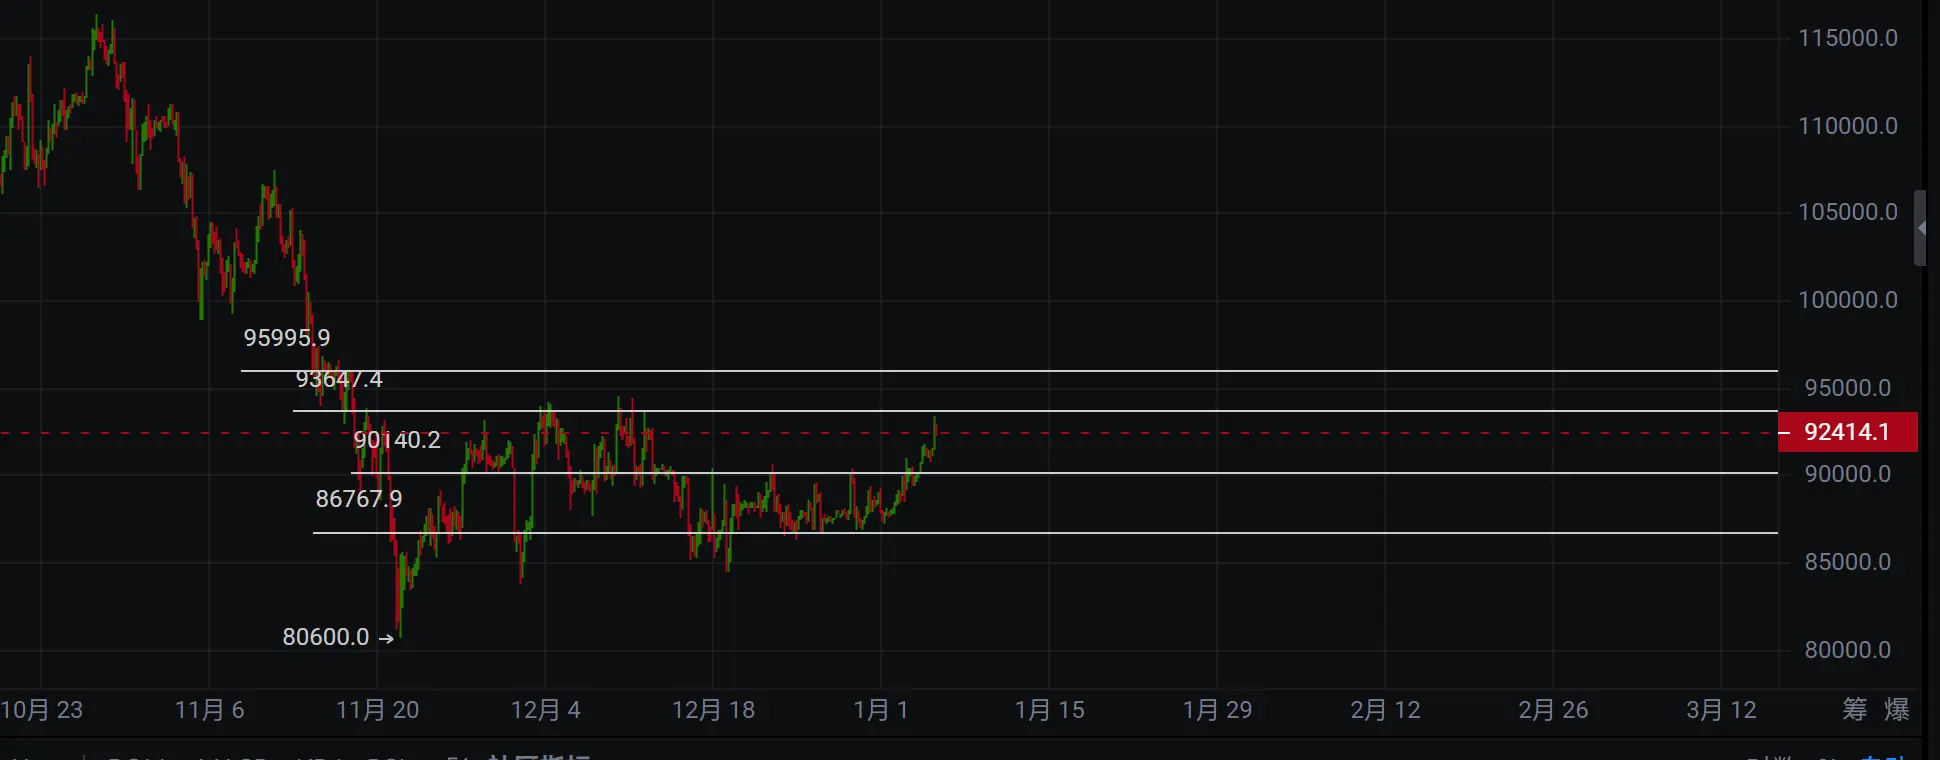
BTC Market Overview for the 1.5th: After a weekend sideways adjustment, the weekly chart opened high.
On the 3rd, 2nd, and daily timeframes, the effective time levels should be monitored to see if the daily EMA can break above.
12/8-hour charts show pillar formations; 2, 3, 4-hour levels are showing volume.
30-minute level shows a rebound from the zero axis; currently, the market is strong.
Resistance above: 93548, 94221, 95153, 95576
Support below: 92638, 91509, 90800, 90345
BTC Bull-Bear Ratio: 1.32; Fear Index: 42
No pattern, no action; do not place orders without stop-loss.
(The abov
BTC0,72%
- Reward
- 1
- 1
- Repost
- Share
GateUser-c5543907:
Bull run 🐂
💰 $BROCCOLI714 /USDT
🔽SHORT
✳️ ENTRY (Use DCA STRATEGY) : 3210 - 3340
🎯 TARGETS - 3150 , 3100 , 3030 , 2947 , 2860 , 2710 , 2500
🀄️ LEVERAGE - cross 10x
🔴 STOPLOSS - 3420
🔽SHORT
✳️ ENTRY (Use DCA STRATEGY) : 3210 - 3340
🎯 TARGETS - 3150 , 3100 , 3030 , 2947 , 2860 , 2710 , 2500
🀄️ LEVERAGE - cross 10x
🔴 STOPLOSS - 3420
- Reward
- 1
- Comment
- 1
- Share
July 5th BTC and ETH geopolitical tensions are tight, is it a trap to lure longs?
On January 3rd, Dapao launched a military raid on the capital of Venezuela, kidnapping the sitting president Maduro and his wife directly, taking them to Dapao for trial. It is also said that they are expected to appear in a New York court on January 5th.
Currently, Bitcoin is in an upward trend, with technical indicators showing the price above both short-term and long-term moving averages. The MA bullish alignment and recent golden cross form a strong bullish resonance. However, trading volume is extremely thin
View OriginalOn January 3rd, Dapao launched a military raid on the capital of Venezuela, kidnapping the sitting president Maduro and his wife directly, taking them to Dapao for trial. It is also said that they are expected to appear in a New York court on January 5th.
Currently, Bitcoin is in an upward trend, with technical indicators showing the price above both short-term and long-term moving averages. The MA bullish alignment and recent golden cross form a strong bullish resonance. However, trading volume is extremely thin
- Reward
- like
- Comment
- Repost
- Share
Relive a year in crypto—riding the market highs and taking bold leaps. Every moment counts. Check your #2025GateYearEndSummary now, recap your 2025 crypto adventure with Gate, and get 20 USDT through sharing. https://www.gate.com/competition/your-year-in-review-2025?ref=VLNGAVEKBW&ref_type=126&shareUid=VlhEU1lWBgQO0O0O

- Reward
- 1
- Comment
- Repost
- Share
Load More
Join 40M users in our growing community
⚡️ Join 40M users in the crypto craze discussion
💬 Engage with your favorite top creators
👍 See what interests you
Trending Topics
View More13.72K Popularity
86 Popularity
70 Popularity
54 Popularity
82.43K Popularity
News
View MoreBiyaPay Analyst: The true main trend of the crypto market will emerge in 2026, with halving taking a backseat
5 m
Closed AAVE and PEPE short positions on a new address, losing $24,000
7 m
Central Bank: Strengthen supervision and management of the interbank bond market, money market, foreign exchange market, bill market, gold market, and related derivatives
13 m
Tria will hold its first 2026 Premium Cardholder offline event in Seoul on January 14.
14 m
Quack AI and Imperial College Blockchain Society hosted the AI + Blockchain Autumn Camp, supported by BNB Chain, successfully concluded.
15 m
Pin