Why does Bitcoin only rise when the US government opens its doors?
The U.S. government shutdown has reached a record-breaking 36 days.
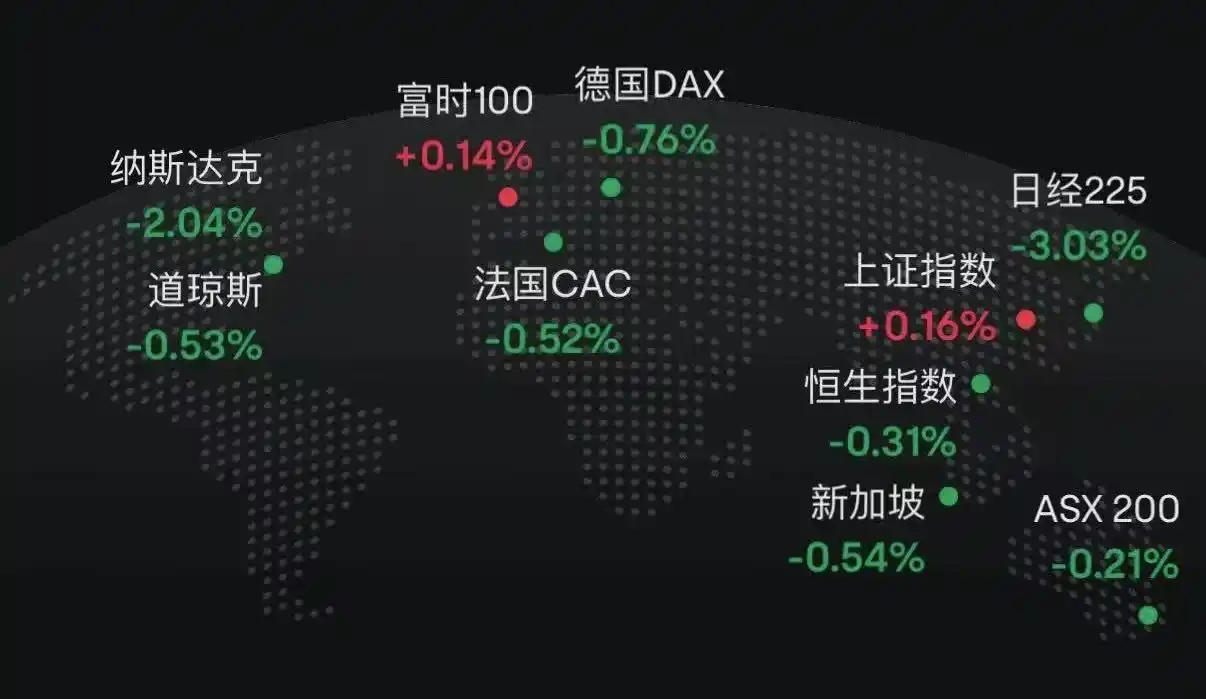
In the past two days, global financial markets have plunged. The Nasdaq, Bitcoin, tech stocks, the Nikkei Index—even safe-haven assets like U.S. Treasuries and gold—have taken a hit.
Market panic is spreading as Washington politicians remain locked in budget disputes. Is there a link between the government shutdown and the global market downturn? The answer is coming into focus.
This isn’t a typical market pullback; it’s a liquidity crisis triggered by the shutdown. With fiscal spending frozen and hundreds of billions trapped in Treasury accounts, unable to circulate into the market, the financial system’s lifeblood is being cut off.
The Treasury’s Black Hole
The Treasury General Account (TGA) functions as the central checking account the U.S. government holds at the Federal Reserve. All federal revenue—from taxes to bond issuances—flows into this account.
All government payments, from federal salaries to defense spending, are issued from the TGA.
Normally, the TGA acts as a transit hub, maintaining a dynamic flow. The Treasury collects and quickly spends, channeling funds into the private financial system, boosting bank reserves, and supplying market liquidity.
The shutdown breaks this flow. The Treasury keeps collecting money via taxes and bonds, and the TGA balance keeps rising. But without a congressional-approved budget, most agencies are closed and the Treasury can’t spend as planned. The TGA turns into a financial black hole—money goes in, but doesn’t come out.
Since the shutdown began on October 10, 2025, the TGA balance ballooned from $800 billion to more than $1 trillion by October 30. In just 20 days, over $200 billion was pulled out of the market and locked away at the Fed.
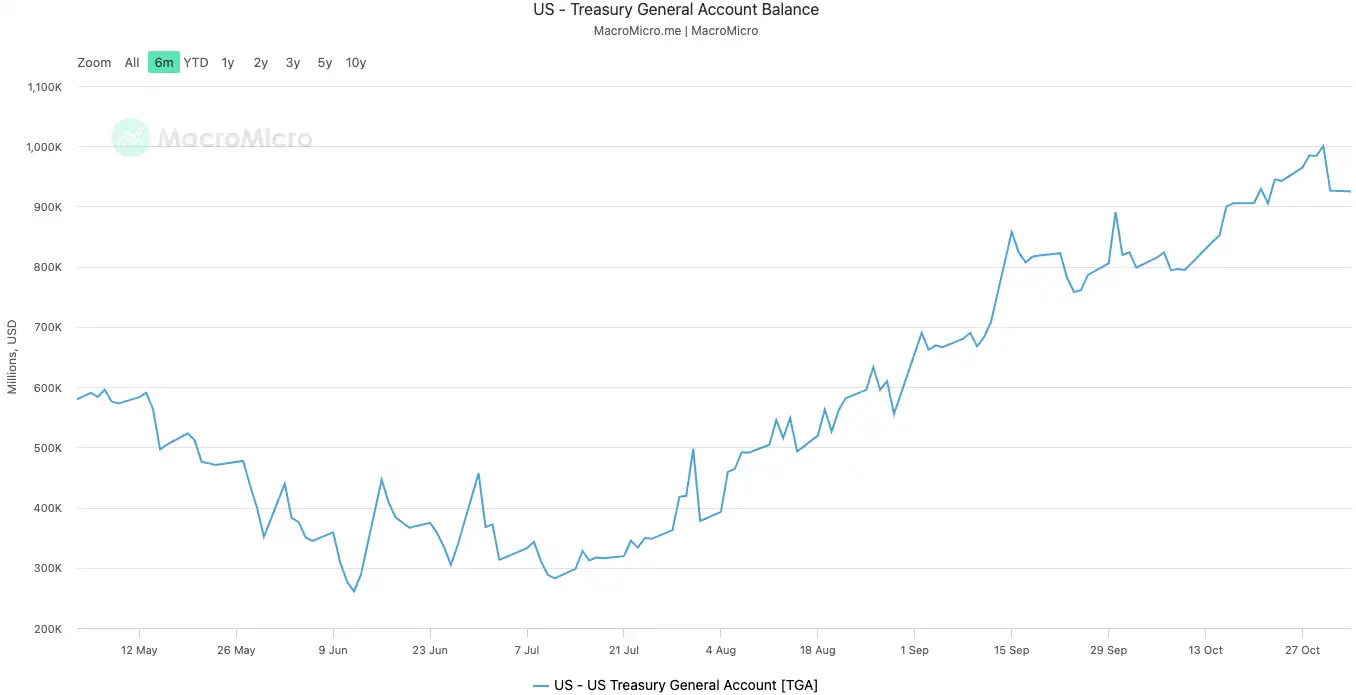
TGA balance | Source: MicroMacro
Analysts note that nearly $700 billion in market liquidity was withdrawn in a month—an impact comparable to multiple Fed rate hikes or accelerated quantitative tightening.
As the TGA siphons off bank reserves, banks’ capacity and willingness to lend plummet, sending funding costs soaring.
Assets most sensitive to liquidity are always first to be hit. On October 11, the second day of the shutdown, the crypto market crashed with nearly $20 billion in liquidations. This week, tech stocks tumbled—the Nasdaq fell 1.7% on Tuesday, while Meta and Microsoft dropped after earnings.
The sell-off in global financial markets is the most visible sign of this silent tightening.
The System Is Running a Fever
The TGA is the “illness” triggering the liquidity crisis, and surging overnight lending rates are the clearest “fever” symptom in the financial system.
The overnight lending market—where banks trade short-term funds—is the system’s capillary network. Its interest rate is the most accurate gauge of tightness between banks. When liquidity is ample, borrowing is easy and rates are steady. When liquidity dries up, banks scramble for cash and pay more to borrow overnight.
Banks Short on Cash
Two key indicators reveal the severity:
First is SOFR (Secured Overnight Financing Rate). On October 31, SOFR jumped to 4.22%, the biggest single-day spike in a year.
This exceeds the Fed’s 4.00% upper limit for the federal funds rate and is 32 basis points above the effective rate—its highest since the March 2020 crisis. Actual interbank borrowing costs have spun out of control, far above the Fed’s policy rate.
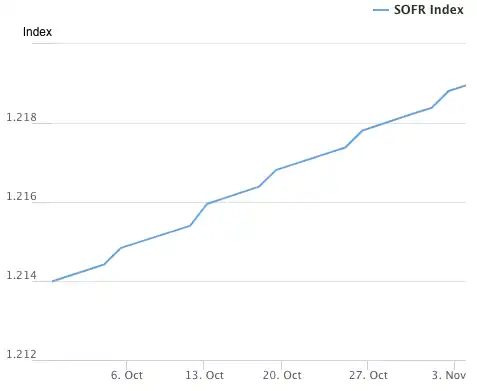
SOFR Index | Source: Federal Reserve Bank of New York
The second, even more striking indicator is the Fed’s Standing Repo Facility (SRF) usage. The SRF is the Fed’s emergency liquidity window—banks can pledge high-grade bonds to the Fed for cash when market borrowing dries up.
On October 31, SRF usage surged to $50.35 billion, a record since the pandemic crisis in March 2020. The banking system is in a severe dollar drought, forced to seek the Fed’s last-resort support.
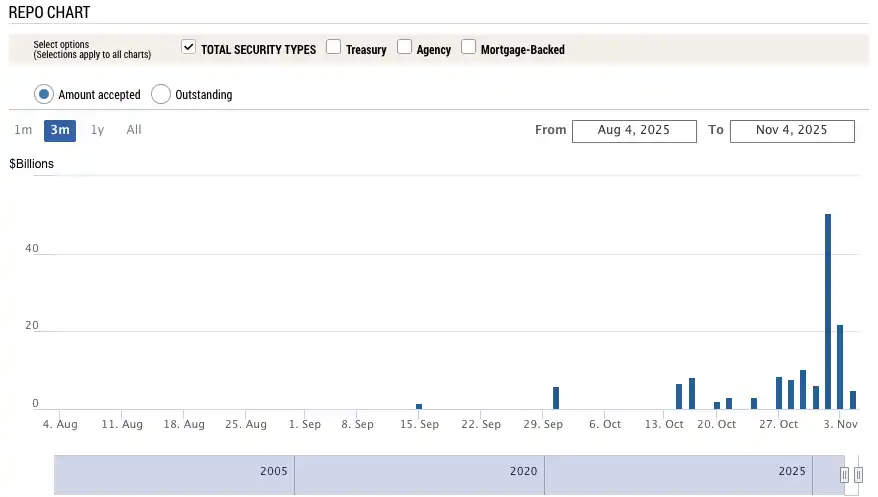
SRF Usage | Source: Federal Reserve Bank of New York
Debt Defaults
The financial system’s fever is passing stress onto the real economy’s weakest links, detonating long-hidden debt bombs. Currently, commercial real estate and auto loans are among the most vulnerable sectors.
According to Trepp, the default rate for U.S. office CMBS (Commercial Mortgage-Backed Securities) hit 11.8% in October 2025—a new high, surpassing the 10.3% peak of the 2008 crisis. In just three years, the rate surged from 1.8%—nearly tenfold.
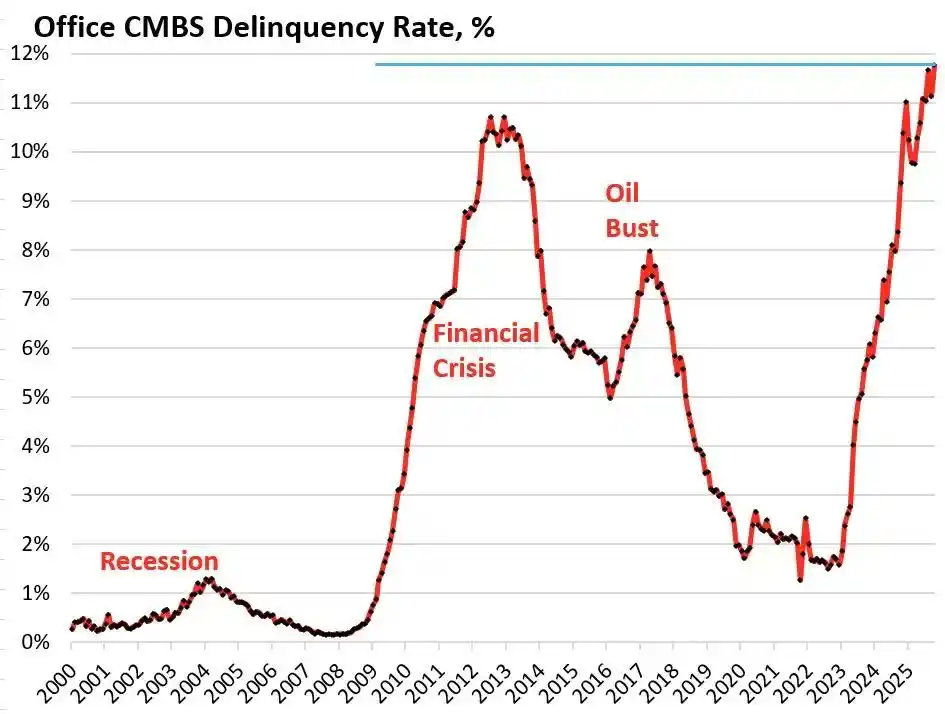
U.S. office CMBS default rate | Source: Wolf Street
Bravern Office Commons in Bellevue, WA is a textbook case. Once fully leased by Microsoft and valued at $605 million in 2020, its value has plunged 56% to $268 million after Microsoft’s exit and is now in default.
This most severe commercial real estate crisis since 2008 is spreading systemic risk throughout the financial system via regional banks, REITs, and pension funds.
On the consumer side, auto loan defaults are sounding alarms. New car prices have soared past $50,000 on average, subprime borrowers face interest rates of 18–20%, and defaults are surging. As of September 2025, subprime auto loan defaults neared 10%, and overall auto loan delinquencies have jumped over 50% in 15 years.
Electricity Bills Surge
At the same time, skyrocketing energy prices are straining many households. Amid high inflation, rising electricity bills are especially punishing. Since early 2025, average U.S. household electricity bills have climbed more than 11%.
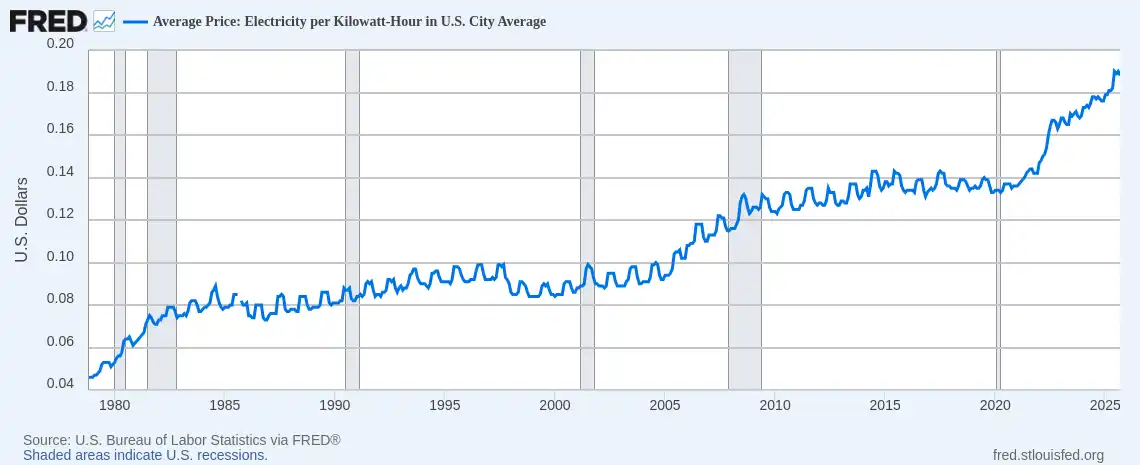
Average U.S. electricity price (USD/kWh) | Source: Federal Reserve Bank of St. Louis (FRED)
In Florida, 63-year-old wheelchair user Al Salvi now faces monthly bills near $500. “We have to choose between paying our electric bill and buying medicine,” he told NPR in October.
This energy crisis—driven by aging grids and surging AI-related power demand—is compounding with interest rate and debt problems, placing significant financial strain on households.
From the TGA’s hidden tightening, to system-wide interest rate stress, to disorder in commercial real estate, auto loans, and household energy bills, a clear chain of crisis transmission is emerging.
Washington’s political deadlock has exposed deep structural weaknesses in the U.S. economy.
Job Market Deterioration
A deeper crisis is brewing in the labor market. The shutdown has not only drained market liquidity—it’s stripped the Fed of its most critical policy guide: economic data.
Until the impasse ends, key official indicators—including monthly jobs and CPI inflation data—are paused. This means, at a pivotal moment, the Fed is flying blind, missing its most authoritative guide.
With the data vacuum, markets are forced to rely on private-sector alternatives. The September ADP jobs report (“mini nonfarm payrolls”) released October 1 showed U.S. private employment fell by 32,000—the first back-to-back drop since the pandemic.
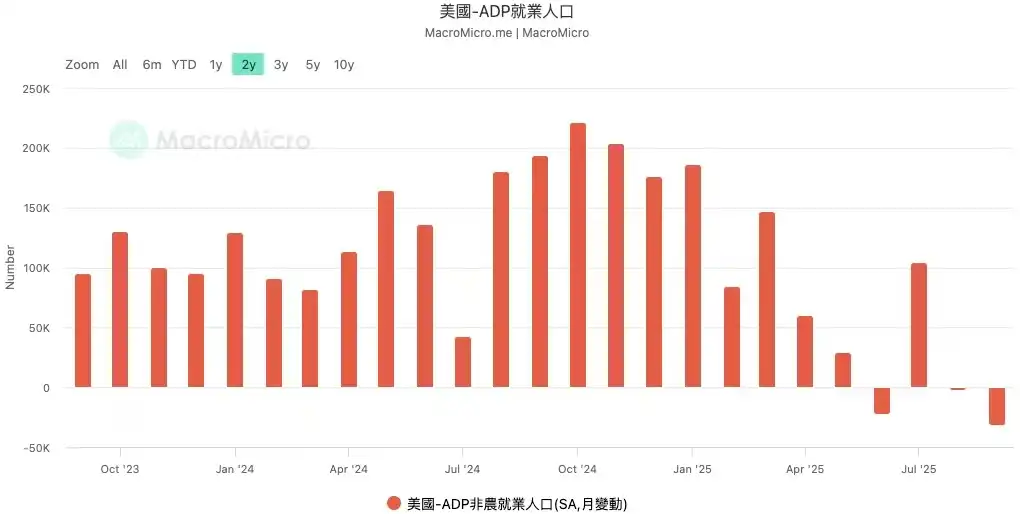
U.S. ADP Nonfarm Employment, Oct 2023–Sep 2025 | Source: MicroMacro
In the last official jobs report before the shutdown, only 22,000 new jobs were added in August, and historical data was revised down by 911,000 jobs.
Post-pandemic, U.S. monthly job growth typically ranged between 200,000 and 300,000. Now it’s crashed to 20,000, even negative—signaling stagnation or contraction. Worse yet, the steep downward revision means the job market was much weaker than official reports suggested.
At its October 31 meeting, the Fed cut rates by 25 basis points as expected, but shifted in its statement from “robust labor market” to “downside risks to employment are rising.” Atlanta Fed President Bostic warned after the meeting that job risks have climbed since August.
These comments highlight the Fed’s mounting concern—and reality backs it up. Amazon announced thousands of layoffs, UPS cut management roles, and the previously stable job market is now experiencing layoffs. After mass tech layoffs in 2023–2024, hiring in 2025 has nearly frozen. Retail, logistics, and financial services are also cutting jobs.
History shows rising unemployment is a classic recession warning. As the job market turns from boom to bust, layoffs spread, consumer confidence collapses, and recession often follows. If job deterioration continues, the U.S. could face systemic risks more severe than a liquidity crunch—an outright recession.
How Are Traders Positioning?
How long will the liquidity crunch last? Traders are split. Most acknowledge the squeeze, but differ on the next six months’ macro outlook.
Pessimists, like Mott Capital Management, warn of a shock on par with late 2018. Bank reserves are at dangerous lows, echoing the 2018 Fed balance sheet reduction. As long as the shutdown continues and the TGA drains liquidity, pain won’t end. The only hope: the Treasury quarterly refunding announcement (QRA) on November 2. If the Treasury cuts the TGA target, over $150 billion in liquidity could hit markets. If not, the winter drags on.
Optimists, led by macro analyst Raoul Pal, pitch a short-term liquidity stress period theory. He sees today’s crunch as a prelude to a liquidity surge. Over the next 12 months, the U.S. must roll over as much as $10 trillion in debt, forcing stability and liquidity measures.
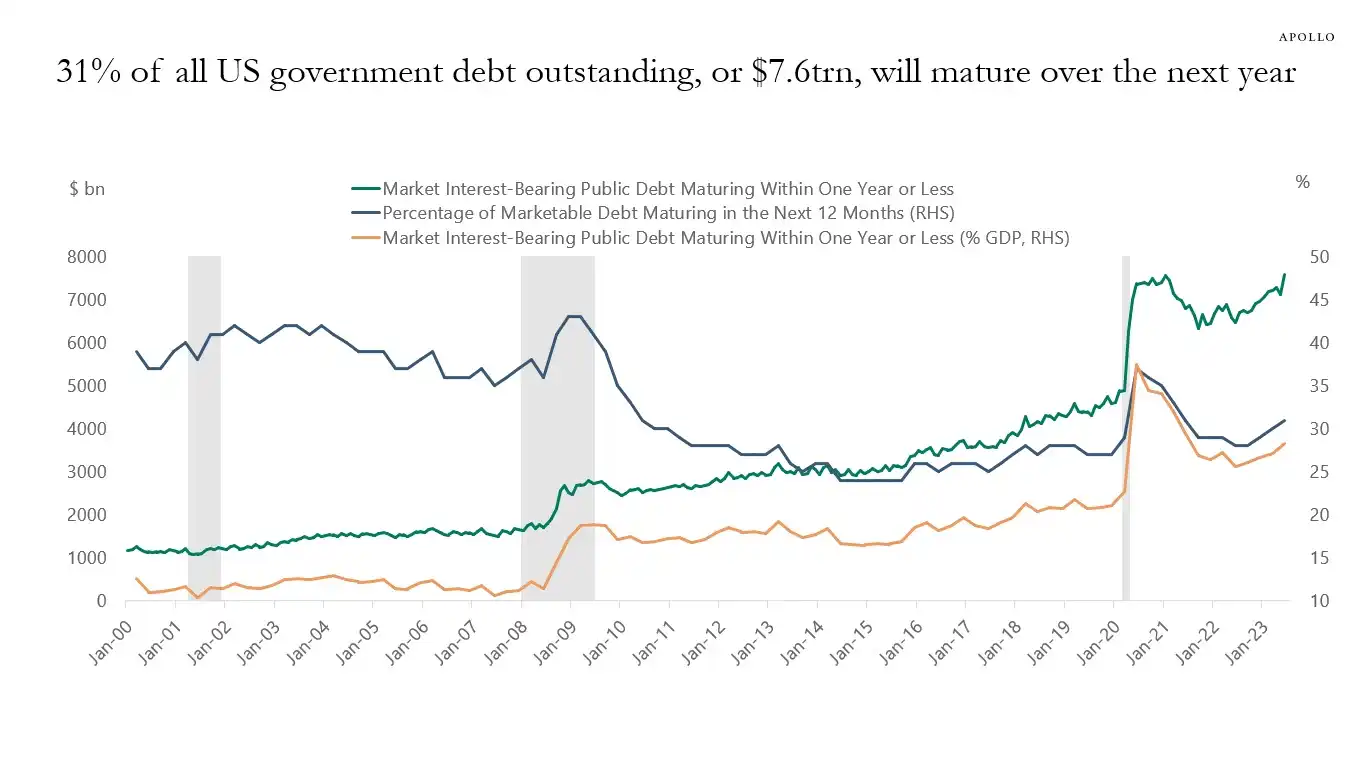
31% of U.S. government debt (about $7 trillion) matures in the next year—plus new issuance, total could reach $10 trillion | Source: Apollo Academy
Once the shutdown ends, suppressed fiscal spending will flood the market, and Fed quantitative tightening (QT) will technically end—or even reverse.
To prepare for the 2026 midterms, the government will pull out all stops—rate cuts, looser bank rules, crypto legislation, and more. With China and Japan also ramping up liquidity, a new wave of global easing is likely. The current pullback is just a market correction; the real strategy is to buy during the downturn.
Major financial institutions like Goldman Sachs and Citi take a more neutral stance. Most expect the shutdown to end in one or two weeks. Once resolved, the TGA’s locked cash will be rapidly released, relieving liquidity stress. But long-term direction depends on Treasury’s QRA and Fed policy.
Historical trends indicate that whether it’s the 2018 balance sheet scare or the September 2019 repo crisis, both ended with the Fed injecting fresh liquidity. Now, with political deadlock and economic risk, policymakers find themselves back at a familiar crossroads.
Short term, the market’s fate hinges on Washington. Long term, the global economy seems stuck in a cycle of debt, stimulus, and bubbles.
The shutdown-induced crisis may precede a larger liquidity event.
Disclosure:
- This article is republished from [BlockBeats], with copyright retained by the original author [EeeVee]. For any concerns about republication, please contact the Gate Learn team for prompt resolution.
- Disclaimer: The views and opinions expressed are those of the author alone and do not constitute investment advice.
- Other language versions of this article are translated by the Gate Learn team. No copying, distributing, or plagiarizing of translated articles is permitted without reference to Gate.
Share
Content


Related Articles

In-depth Explanation of Yala: Building a Modular DeFi Yield Aggregator with $YU Stablecoin as a Medium

BTC and Projects in The BRC-20 Ecosystem

What Is a Cold Wallet?

Blockchain Profitability & Issuance - Does It Matter?

Notcoin & UXLINK: On-chain Data Comparison
