Gate Research: Crypto Market Consolidates as AI and Mid-Cap Sectors Diverge Structurally
Crypto Market Overview
According to CoinGecko data, from November 11 to November 24, 2025, global risk assets weakened under macro pressures including concerns over an AI-sector “bubble,” stronger-than-expected employment data, and sharply revised-down expectations for rate cuts. The crypto market came under corresponding pressure. After a sustained decline, BTC and ETH staged a low-level rebound on November 19–20, recovering to around USD 86,600 and the USD 2,780–2,820 range, respectively, though the broader structure remains in a bottom-building consolidation phase. Several tokens outperformed against the trend and delivered notable gains.【1】
On the ecosystem and news front, Arbitrum continued to attract incremental inflows, while ecosystems like Solana and Base—previously in repair mode—also rebounded. By contrast, Ethereum mainnet and Hyperliquid experienced significant outflows, pushing on-chain capital structures into a “redistribution phase.” Meanwhile, the tokenization of stocks and ETFs on-chain has approached USD 10 million in value, with Robinhood positioning this segment as core infrastructure—further accelerating Arbitrum’s transition from an active DeFi chain toward an institutional-grade settlement hub. On Ethereum, Vitalik introduced the Kohaku privacy framework, elevating privacy to a first-class property of the protocol. NVIDIA reiterated that the AI revolution has not yet peaked, providing long-term support to the AI + on-chain narrative.
On the other hand, the DAT sector experienced meaningful valuation compression during the market pullback, with total market cap falling below USD 1 trillion. Premiums of leading companies declined or flipped into discounts, suggesting that the sector has entered an adjustment period featuring a mix of active and passive deleveraging.
From a macro perspective, the market’s key turning point came from Friday’s comments by Federal Reserve Vice Chair Williams—a close ally of Chair Powell—who explicitly signaled support for rate cuts. As a result, market expectations for a December rate cut surged overnight from 30% to 70%, improving overall risk appetite.
Overall, the combination of global macro pressures and evolving on-chain capital rotations places the market in a phase of “risk repricing + technical recovery.” Sensitivity to policy signals and liquidity conditions has increased significantly. Despite short-term headwinds, medium- to long-term drivers such as accelerating institutional entry, the rise of tokenized equities, recovery across major ecosystems, and the expansion of cross-chain settlement use cases remain intact, positioning the market within a broader restructuring cycle where risks and opportunities coexist.
1. Overview of Price Performance
This report groups the top 500 tokens by market capitalization and examines their average returns from November 11 to November 24.
Overall, the market experienced a broad-based correction: all five market-cap segments recorded average declines of roughly –12% to –16%, with an overall mean of –14.99%. The 100–200 segment posted the steepest losses (–16.43%), indicating that mid-large caps came under the greatest pressure amid tightening liquidity. In contrast, the 300–400 segment saw relatively smaller declines (–12.02%), suggesting that smaller-cap assets did not face accelerated sell-offs despite lower liquidity.
Taken together, this adjustment phase exhibited a pattern of “synchronized drawdowns across all segments with no clear relative strength,” consistent with a macro-driven period of cyclical deleveraging.
Based on CoinGecko data, the top 500 tokens by market capitalization were divided into groups of 100 (e.g., ranks 1–100, 101–200, etc.). For each group, price changes from November 11 to November 24, 2025 were measured and averaged to derive the segment’s mean return. The overall average decline (–14.99%) represents the simple average of individual returns across the top 500 tokens, unweighted by market cap.
Figure 1: Average decline of 14.99%, reflecting synchronized market-wide pullback with no clear relative strength.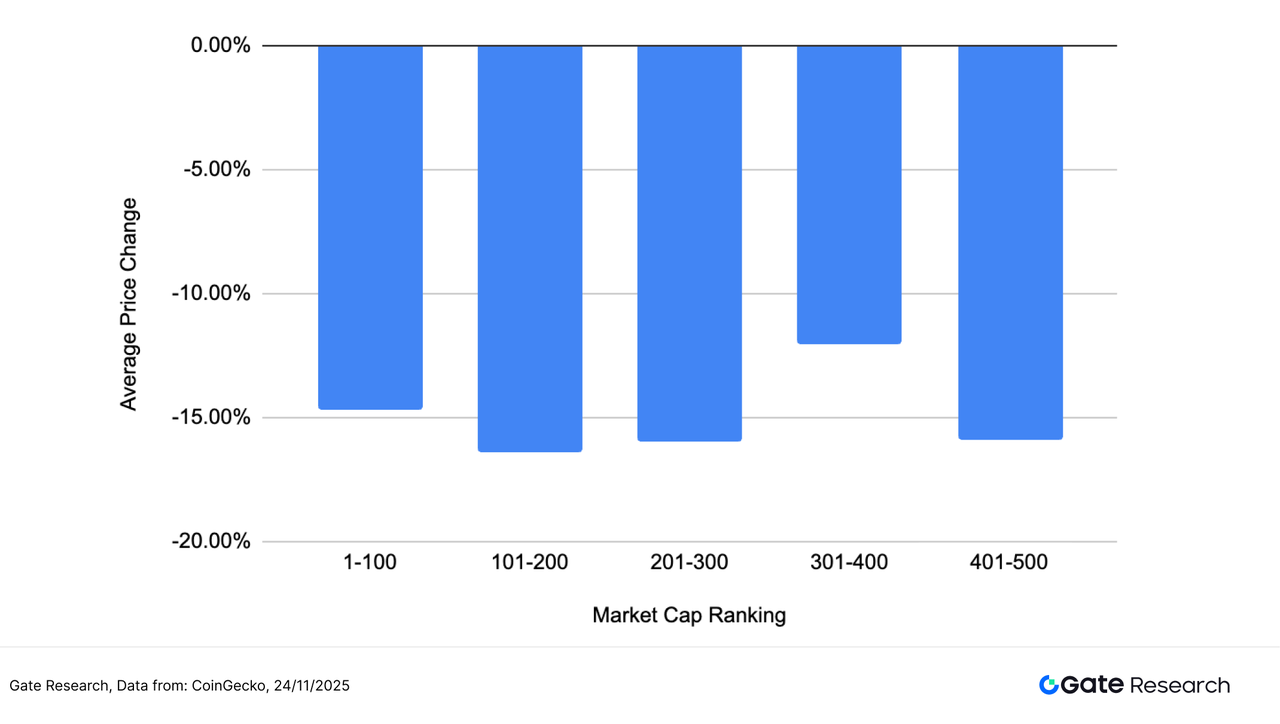
Top Gainers and Losers
Over the past two weeks (November 11–24), the crypto market exhibited significant divergence under the combined influence of macro pressures and shifting narratives. Individual tokens experienced sharp gains and losses, underscoring that market sentiment remains in a high-volatility zone.
Top Gainers: Application-driven and narrative-specific tokens lead; BEAT dominates the market
BEAT topped the leaderboard with an extraordinary 436.92% surge, becoming the strongest focal point of the entire market. BEAT is an application-layer token positioned at the intersection of “AI music + virtual idols,” enabling users to generate AI tracks, interact with AI idols, and participate in creator-driven tasks.
This week’s 436.92% rally likely stemmed from infrastructure tailwinds—including Audiera’s newly announced partnership with Endless Protocol—combined with the broader momentum behind AI narratives. As a high-beta asset within the “AI × entertainment” theme, BEAT drew concentrated inflows from short-term traders. Its small market cap, strong community presence, and high virality amplified the move, making it the most structurally dominant asset of the period.
Following BEAT were AVICI (+67.93%) and TEL (+66.47%), both benefiting from strong communities, narrative extensions, and improved trading flows that provided sustained upward momentum. Others such as FOLKS, B, QRL, and WFI posted gains ranging from 13% to 37%, highlighting the period’s capital preference for “small-cap assets with clear thematic hooks and strong hedge-like characteristics.”
Top Losers: Speculative and early-stage narrative tokens correct sharply, with SOON leading the declines
On the downside, SOON plunged 69.33%, the largest drop in the market, signaling a rapid cooling of previously overheated short-term sentiment. It was followed by USELESS (–54.55%) and PLUME (–54.34%), both exhibiting the classic pattern of theme-driven assets that spike quickly and retrace just as fast.
Other notable decliners—COAI, TIBBIR, CCD, and BRETT—fell between –43% and –52%, largely concentrated in meme tokens, AI-concept tokens, and low-liquidity emerging assets. This reflects the market’s sharply reduced tolerance for high-beta tokens during a liquidity contraction phase.
Overall, capital rotated away from high-volatility speculative assets and toward sectors with clearer fundamentals and narrative durability. The distribution of gains and losses indicates that the market’s style is shifting from short-term hype cycles toward more structurally grounded mid- to long-term themes. High-volatility, small-cap, community-driven thematic tokens saw sizable pullbacks, while tokens with real products, meaningful user bases, or narrative execution pathways attracted stronger buying support.
As the market enters a risk-repricing phase, assets characterized by “strong consensus + clear application value + solid trading support” remain well-positioned to maintain relative strength within a choppy environment.
Figure 2: BEAT surged 436.92%, likely driven by Audiera’s announced partnership with Endless Protocol, which provided infrastructure tailwinds and attracted concentrated short-term inflows into this high-elasticity asset.
Relationship Between Market Cap Ranking and Price Performance
To analyze the structural characteristics of token performance during this market cycle, this report plots a scatter distribution of the top 500 tokens by market capitalization. The horizontal axis represents market-cap ranking (with larger-cap assets on the left), while the vertical axis shows price performance from November 11 to November 24. Each dot represents one token, with green indicating gains and red indicating declines.
Overall, the number of declining tokens far exceeds those that rose. Most assets are clustered in the –10% to –25% range, suggesting that under macro pressure and fading sentiment, the market remains in a weak recovery phase. Tokens with significant gains are relatively scarce and are predominantly concentrated in the 200–500 market-cap range—indicating that capital favored high-elasticity, narrative-driven assets rather than more stable large-cap coins.
Among the outperformers, BEAT (+436%), AVICI (+67.93%), and TEL (+66.47%) stand out as the three most notable gainers, collectively reflecting an “extreme strength + narrative-driven” pattern. All three are positioned in the mid- to lower-cap segments, reinforcing this cycle’s theme that “small-cap narrative tokens dominated the upside.”
Conversely, major decliners such as SOON, COAI, USELESS, and PLUME fall mostly within the long-tail segment (beyond rank 250), with broad drawdowns of –50% to –70%. These assets exhibit classic “post-hype unwinding + capital exit” behavior. This segment also saw the most intense volatility and contributed significantly to the downward pressure in this market cycle.
Overall, price dynamics during this period can be summarized as: “Large caps remained relatively stable, while mid- and small-cap tokens experienced sharp divergence; strength was highly concentrated, while weakness was broadly distributed.” Capital continued to favor short-term sentiment-driven assets in a choppy environment, amplifying volatility among mid- to lower-cap tokens and reflecting a market where risk appetite remains dominated by short-term trading activity.
Figure 3: The scatter distribution of price performance among the top 500 tokens shows that gainers are concentrated in mid- to lower-cap ranges, while decliners are broadly distributed—highlighting clear structural divergence.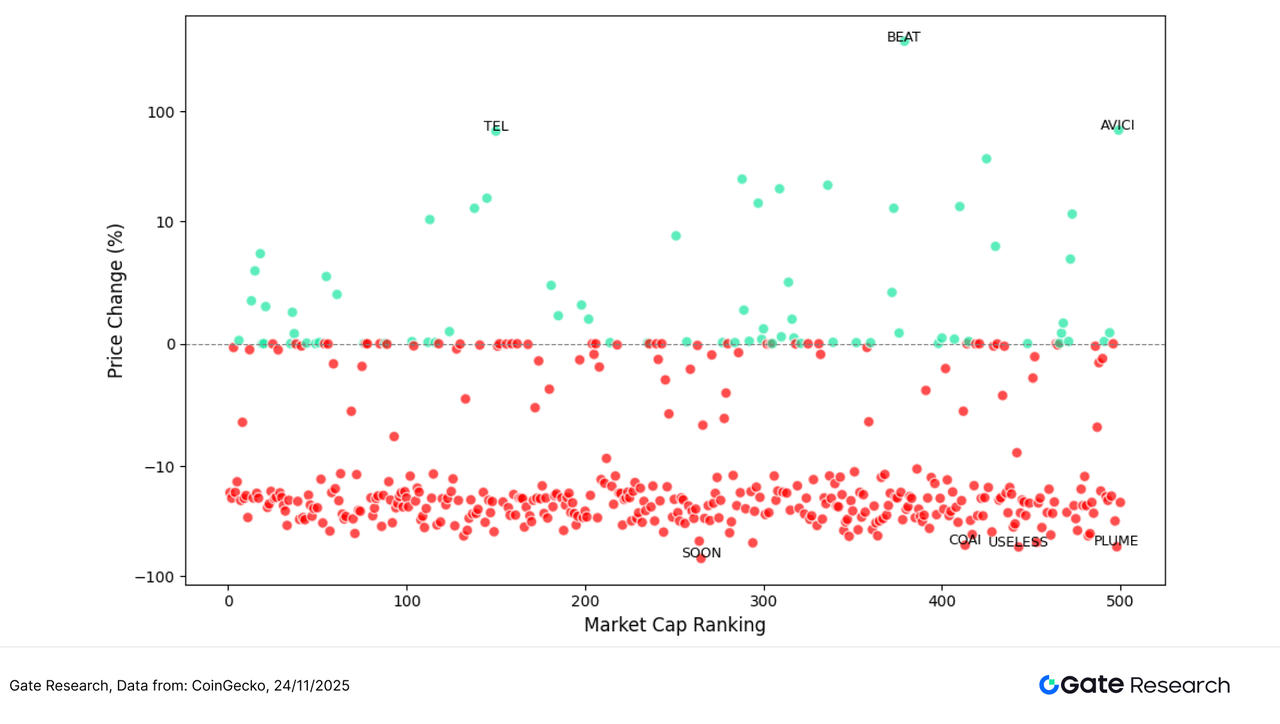
Top 100 Market Cap Leaders
In this choppy market cycle, the performance of the top 100 tokens by market capitalization showed notable divergence. While most major assets exhibited limited volatility, several tokens with strong narratives or defensive characteristics managed to outperform against the trend.
On the gainers list, ZEC (+7.38%) led the group, with renewed attention on the privacy sector as risk-off sentiment increased, prompting active capital inflows. BCH (+5.97%) continued its recent strength, supported by rising on-chain activity and growing interest in payment-related narratives. PI (+4.04%) and WBT (+3.52%) also recorded modest gains, reflecting relatively stable capital preferences within this segment, which favored projects with established ecosystems or more predictable growth trajectories. Overall, the top-performing large-cap assets delivered mild gains, primarily fitting a “steady upside supported by fundamentals” profile.
On the losers list, PUMP (–41.12%) saw the steepest decline, illustrating the sharp pullback in narrative-driven tokens after short-term speculative capital retreated. ICP (–39.09%) and FIL (–35.43%) also ranked among the largest decliners, driven by deteriorating macro risk appetite and profit-taking following earlier rallies. SUI (–34.72%) and NEAR (–32.97%) experienced similarly pronounced corrections, highlighting that high-beta layer-1 chains face greater price pressure during heightened market volatility. Overall, the most significant declines were concentrated in high-elasticity tokens that had posted strong prior gains and were heavily narrative-driven—leading to deeper corrections during this phase of market adjustment.
In summary, the top 100 assets exhibited a clear structural pattern: “steady, fundamental-backed projects posted mild gains, while narrative-driven and high-beta tokens experienced pronounced declines.” During this period of market turbulence, capital showed a stronger preference for high-certainty, mature-ecosystem assets while significantly reducing exposure to short-term, speculative narratives—reflecting a temporary cooling of risk appetite.
Figure 4: Among the top 100 tokens, ZEC continued to lead gains as the privacy sector attracted renewed interest amid rising risk-off sentiment, prompting active capital inflows.
2. Volume Surge Analysis
Trading Volume Growth Analysis
Beyond price performance, this report also examines trading volume changes for selected tokens to assess market activity and capital engagement. Using pre-rally volume levels as the baseline, we calculate the volume expansion multiple and compare it with corresponding price movements to evaluate market attention and short-term capital flows.
Data shows that the five tokens with the most significant volume growth this period were AGENTFUN, XSO, EETH, SWOP, and NMR. Among them, AGENTFUN’s volume expanded by 15.31× while its price declined 24.72%, forming a textbook “higher volume, lower price” pattern. This reflects the unwinding of previously hot narratives, withdrawal of sentiment-driven traders, intensified selling pressure, and a lack of sustained capital despite heightened short-term speculation. XSO saw a 14.81× increase in trading volume with only a mild 2.76% price rebound—an indication of “volume revival without trend formation.” This suggests that liquidity testing and order-book activity dominated flow, rather than directional accumulation; such assets warrant continued observation to determine whether they can form a stable structure after the volume spike.
EETH’s trading volume rose 10.62× but its price still fell –19.57%, placing it in an adjustment phase driven by pressure release and retracement from prior gains—demonstrating that on-chain capital is more cautious during heightened volatility. SWOP and NMR displayed a “higher volume, flat price” structure, indicating increased market attention but still-conservative buying interest, reflecting a broader wait-and-see sentiment in the current environment.
Overall, the volume-expanding tokens this period predominantly exhibit a “capital activity rising but prices under pressure” pattern. Most of the volume increases were driven by short-term liquidity rotation, arbitrage activity, or position adjustments following narrative unwinding, rather than the start of a sustained trend. Capital remains concentrated in localized themes and structural opportunities, though without substantial follow-through—highlighting that market risk appetite remains subdued and short-term trading behavior continues to dominate.
Figure 5: Tokens such as AGENTFUN, XSO, and EETH saw significant volume expansion this period, yet most failed to form trend-driven rebounds. This volume-price divergence underscores a market dominated by short-term liquidity flows.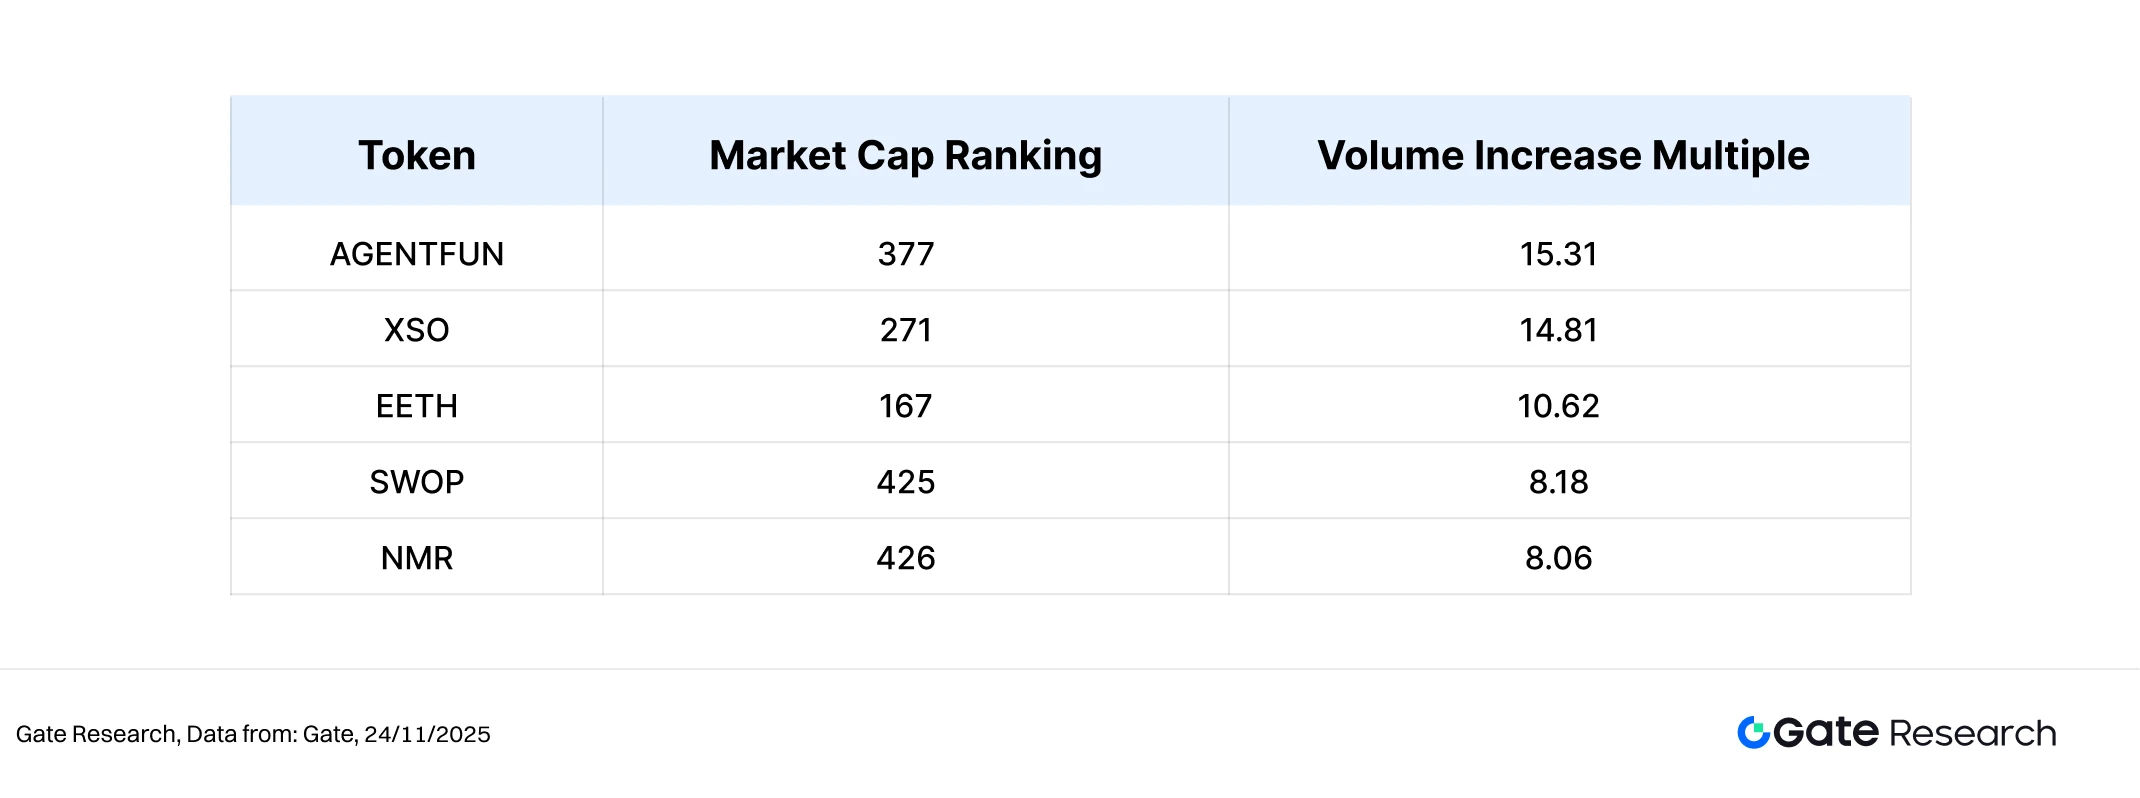
Volume-Price Relationship Analysis
Building on the earlier examination of tokens with notable volume anomalies, this report further incorporates price performance by plotting a scatter chart of Volume Increase Multiple versus Price Change %. The horizontal axis represents each token’s trading volume multiple relative to its baseline period over the past two weeks, while the vertical axis shows its corresponding price change. A symmetric log scale is applied to clearly visualize the structural relationship between “volume expansion” and “price movement.”
Overall, most tokens cluster in the region characterized by modest volume expansion and limited price appreciation, indicating that the market remains in a weak recovery and choppy consolidation phase. Incremental capital remains constrained, and short-term market participants display cautious behavior. The number of declining tokens significantly exceeds those that gained, reflecting that under macro pressure and fragile sentiment, the market is still dominated by deleveraging and structural adjustments.
Notably, the tokens with the strongest gains tended to achieve them without significant volume expansion. For example, QRL posted more than a 20% increase despite only moderate volume growth—suggesting its rally was driven primarily by narrative catalysts rather than broad-based liquidity, a classic “low-volume spike” pattern.
In contrast, several tokens with an 8× to 12× increase in trading volume—such as CUSD0, IUSDS, USDT, and XSO—still delivered muted price performance within the –5% to +5% range. CUSD0, IUSDS, and USDT are stablecoins or stablecoin-like synthetic assets (e.g., interest-bearing dollars, synthetic USD, or LP-split instruments), whose prices are anchored to USD values. Thus, even with substantial volume expansion, these assets do not exhibit trend-driven price movements. Their elevated transaction multiples more often reflect arbitrage, staking/unstaking cycles, pool rebalancing, or on-chain risk-off positioning rather than genuine speculative buying. This structure indicates that capital is skewed toward short-term liquidity operations, testing market depth, and rotating through stability-oriented instruments rather than making directional bets on risk assets.
Overall, this period reflects a classic “structural rotation + volume-price mismatch” environment: mainstream assets saw little improvement in trading activity and remained weak; mid- to small-cap volatility was driven more by sentiment and narrative shifts than by broad capital inflows; high-volume expansion largely failed to translate into price appreciation, signaling subdued risk appetite; and the few outperforming tokens were mostly characterized by “low-volume strength”—a profile more aligned with short-term speculative behavior than sustained market conviction.
Figure 6: Most tokens cluster in regions with limited volume expansion and modest price changes, indicating that the market remains in a weak recovery and choppy structure, with constrained incremental capital and cautious short-term trading behavior.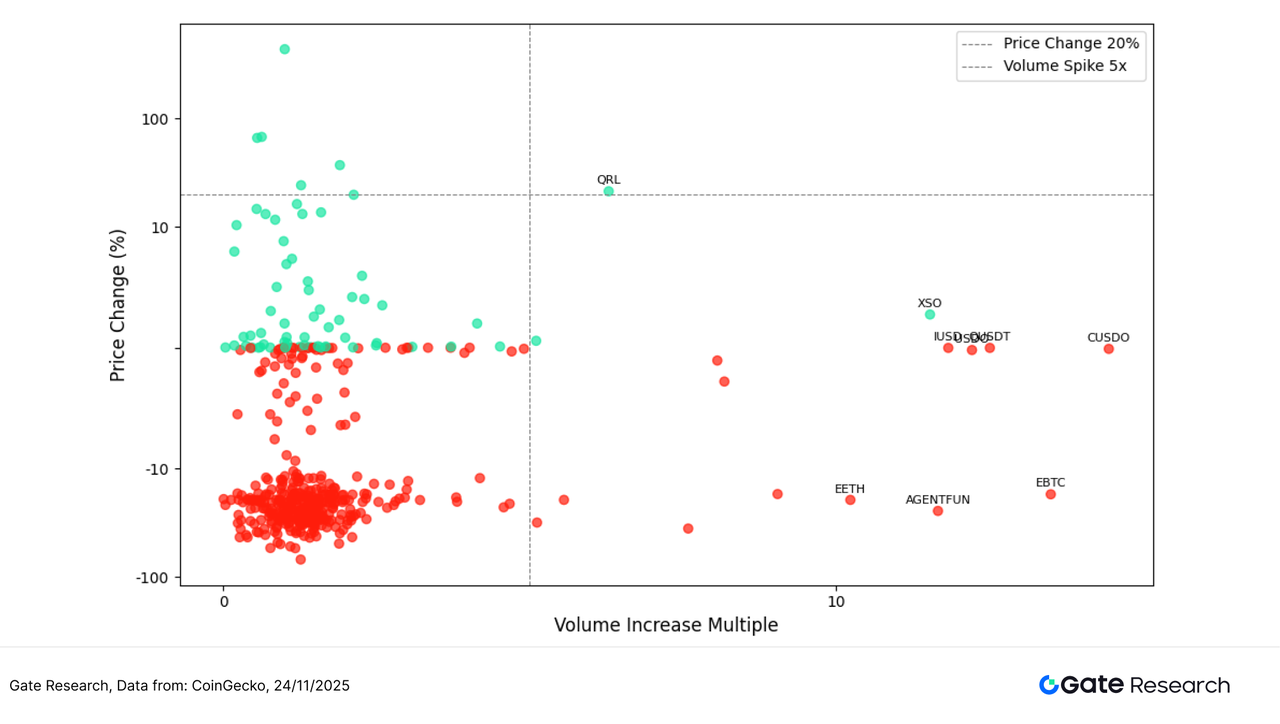
Correlation Analysis
After examining the linkage between trading volume and price movements, this report further analyzes their systemic relationship from a statistical perspective. To assess how capital activity influences price volatility, we construct a Relative Activity Indicator defined as “Volume Growth Rate / Market Capitalization,” and compute its correlation with price changes. This allows us to identify which categories of assets are currently most sensitive to liquidity-driven flows.
As shown in the chart, most tokens fall within the 0.65–0.90 correlation range, indicating that the market remains highly synchronized under heightened macro volatility. However, subtle differences across segments reveal the underlying capital preferences and rotational patterns.
Tokens with the highest correlations (>0.90)—such as XSO, FLUID, ELF, MOVE, and BEAT—primarily belong to trading-narrative assets, AI applications, or high-beta thematic categories. These tokens are highly sensitive to market sentiment and tend to behave as “amplified versions of the broader market.” With strong community dynamics and high-frequency trading characteristics, they are easily driven by short-term liquidity and form the most tightly correlated cluster in this cycle.
Tokens in the lower-correlation range (0.65–0.75), represented by BCH, XVG, WFI, DCR, and WLFI, show visibly larger market caps in the bubble plot. These assets typically fall under infrastructure or long-term value categories, where price movements are less influenced by macro fluctuations and more dependent on ecosystem development or genuine on-chain demand. For example, BCH’s payment narrative and long-term usage base allow it to maintain relative independence even during sharp market swings.
Overall, the correlation distribution this period reflects three structural layers:
High correlation = High-beta thematic assets
AI tokens, trading-driven assets, and community-coordinated tokens that closely track the broader market and act as “volatility amplifiers.”Medium correlation = Functional and utility protocols
These follow overall market trends but retain narrative-specific independence.Low correlation = Value-oriented and infrastructure assets
Tokens like BCH and WLFI remain more stable and defensive, demonstrating lower sensitivity to speculative liquidity.
Figure 7: High-correlation tokens are concentrated in high-beta and trading-narrative categories, while value-driven assets like BCH and WLFI exhibit lower correlation—highlighting the structural stratification of the current market.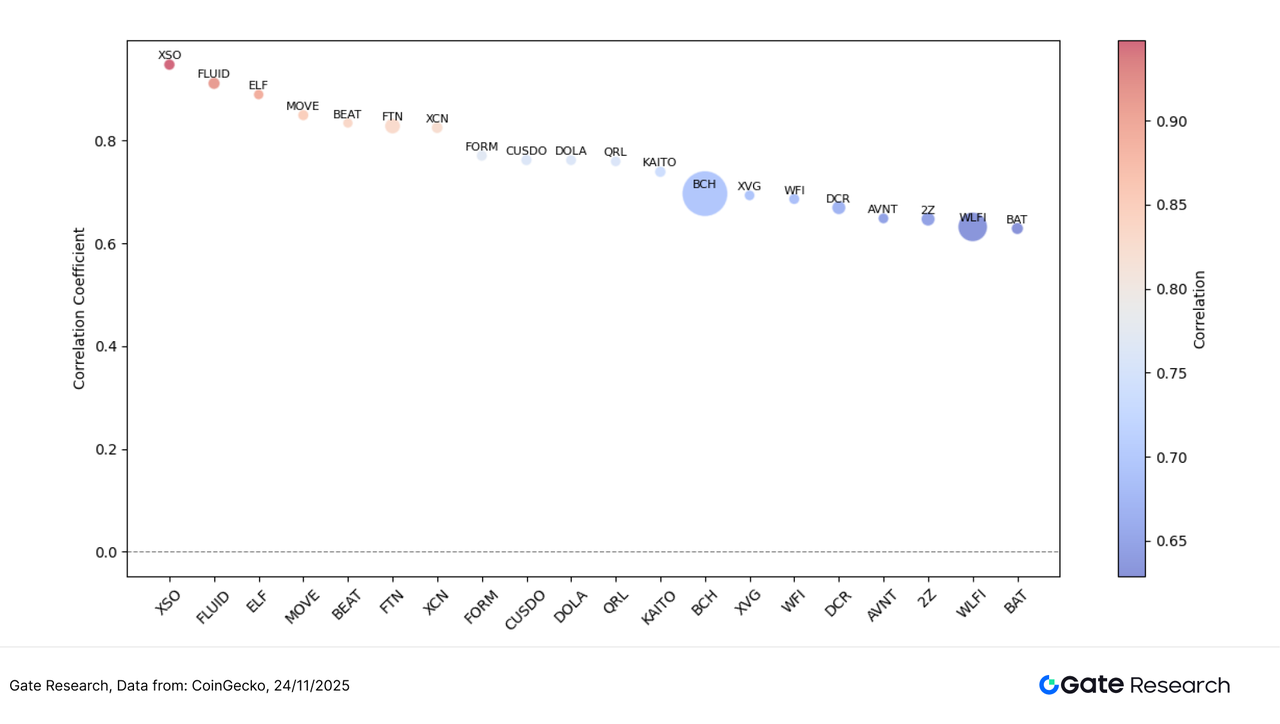
The current crypto market continues to exhibit structural rotation under macro pressure, with the top 500 tokens posting an average decline of 14.99%, reflecting an ongoing deleveraging phase. While most large-cap assets fell within the –10% to –25% range, mid- and small-cap thematic tokens still produced notable outliers: BEAT, AVICI, and TEL recorded strong gains driven by the AI × entertainment narrative and community momentum. In contrast, high-beta projects such as SOON and USELESS experienced sharp corrections, signaling a pronounced cooling across sentiment-driven segments.
Trading activity displayed widespread “higher volume, lower price” and “higher volume, flat price” patterns. Tokens like AGENTFUN and EETH saw their trading volumes expand by 10–15× yet continued to decline, indicating that capital remained focused on short-term liquidity testing rather than initiating sustained trend formation. Overall, the volume–price structure suggests a market still in weak recovery mode.
Beyond market price action, several potential airdrop projects continued to progress across major themes, including AI, Layer 2, social points, and decentralized identity. By staying engaged and interacting consistently, users may position themselves ahead of the curve and secure token rewards and airdrop eligibility during this period of market volatility. The following sections outline four high-potential projects and their participation methods to support a structured approach to capturing Web3 airdrop opportunities.
Airdrop Highlights
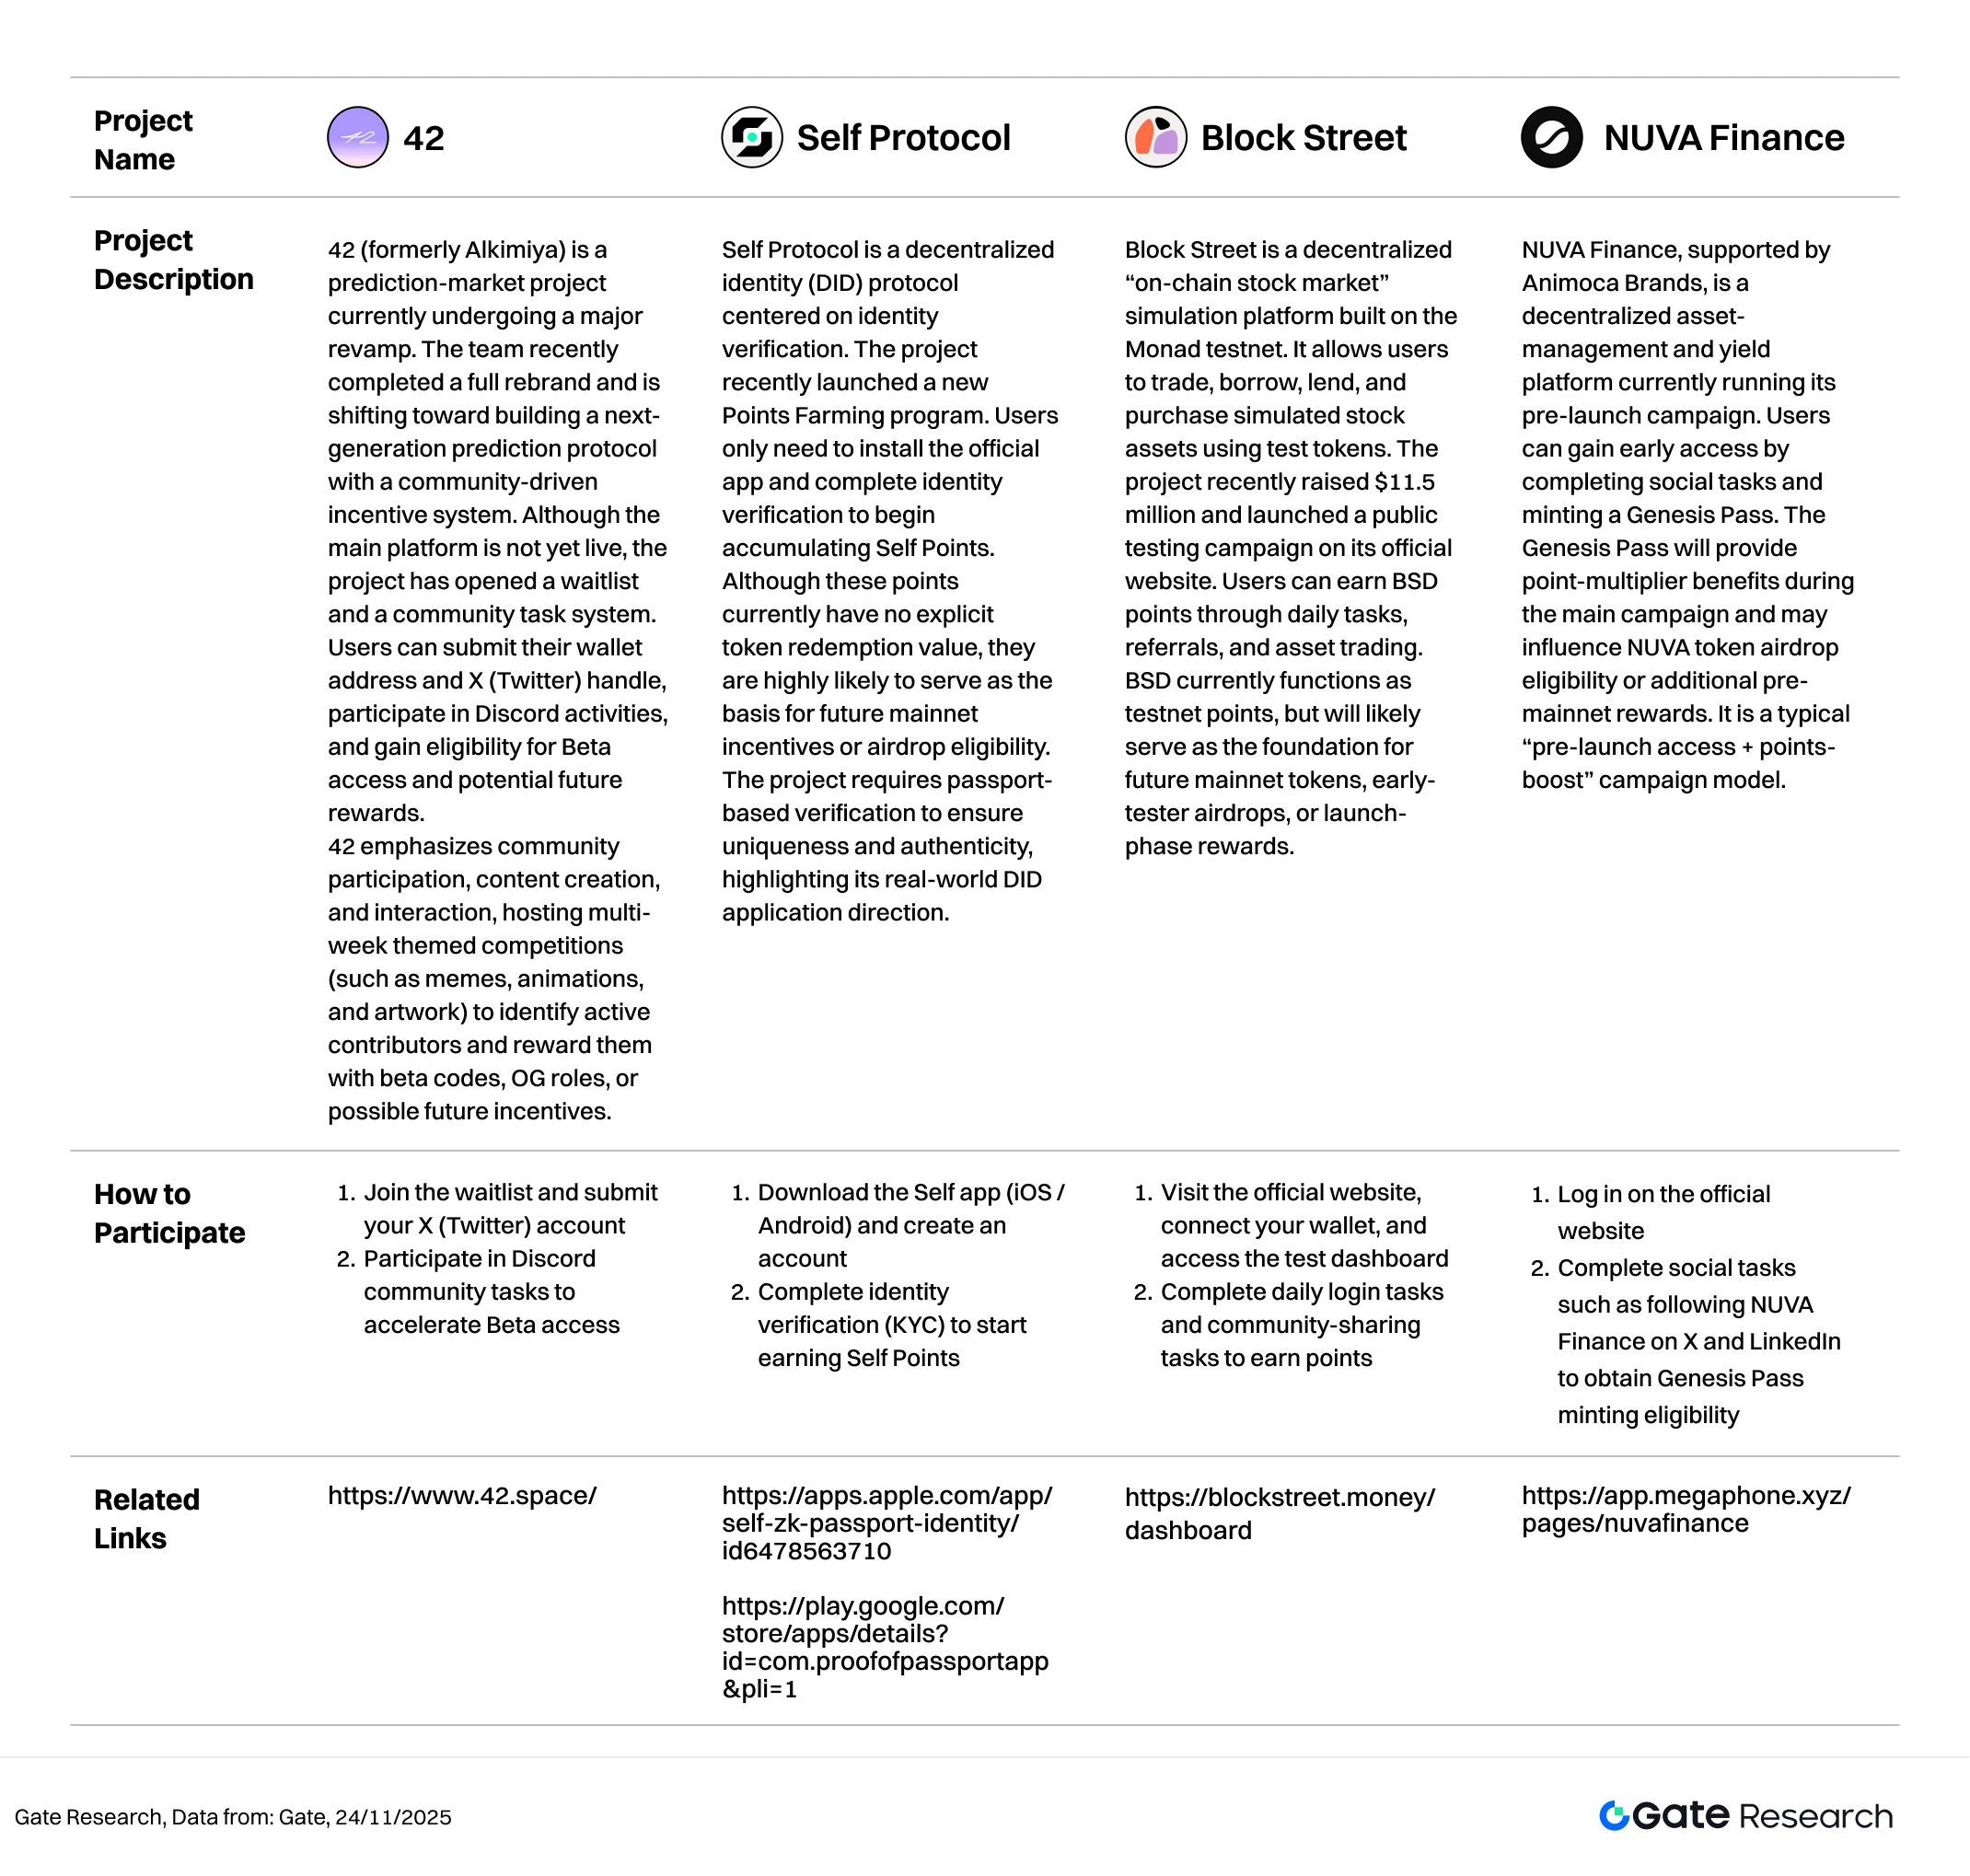
This report highlights key airdrop-potential projects worth tracking between November 11 and November 24, 2025, including 42 (formerly Alkimiya, a community-driven prediction market), Self Protocol (a decentralized identity platform with a DID-based points system), Block Street (an on-chain stock-simulation platform built on Monad), and NUVA Finance (a pre-launch yield platform within the Animoca ecosystem). Users can accumulate contribution records—and secure eligibility for potential future airdrops or token incentives—by connecting their wallets, completing testnet interactions, participating in social tasks, and undergoing identity verification.
42
42 (formerly Alkimiya) is a prediction-market project currently undergoing a major revamp. The team recently completed a full rebrand and is shifting toward building a next-generation prediction protocol with a community-driven incentive system. Although the main platform is not yet live, the project has opened a waitlist and a community task system. Users can submit their wallet address and X (Twitter) handle, participate in Discord activities, and gain eligibility for Beta access and potential future rewards.
42 emphasizes community participation, content creation, and interaction, hosting multi-week themed competitions (such as memes, animations, and artwork) to identify active contributors and reward them with beta codes, OG roles, or possible future incentives.【2】
How to Participate:
- Join the waitlist and submit your X (Twitter) account
- Participate in Discord community tasks to accelerate Beta access
Self Protocol
Self Protocol is a decentralized identity (DID) protocol centered on identity verification. The project recently launched a new Points Farming program. Users only need to install the official app and complete identity verification to begin accumulating Self Points. Although these points currently have no explicit token redemption value, they are highly likely to serve as the basis for future mainnet incentives or airdrop eligibility. The project requires passport-based verification to ensure uniqueness and authenticity, highlighting its real-world DID application direction.【3】【4】
How to Participate:
- Download the Self app (iOS / Android) and create an account
- Complete identity verification (KYC) to start earning Self Points
Block Street
Block Street is a decentralized “on-chain stock market” simulation platform built on the Monad testnet. It allows users to trade, borrow, lend, and purchase simulated stock assets using test tokens. The project recently raised $11.5 million and launched a public testing campaign on its official website. Users can earn BSD points through daily tasks, referrals, and asset trading. BSD currently functions as testnet points, but will likely serve as the foundation for future mainnet tokens, early-tester airdrops, or launch-phase rewards.【5】
How to Participate:
- Visit the official website, connect your wallet, and access the test dashboard
- Complete daily login tasks and community-sharing tasks to earn points
NUVA Finance
NUVA Finance, supported by Animoca Brands, is a decentralized asset-management and yield platform currently running its pre-launch campaign. Users can gain early access by completing social tasks and minting a Genesis Pass. The Genesis Pass will provide point-multiplier benefits during the main campaign and may influence NUVA token airdrop eligibility or additional pre-mainnet rewards. It is a typical “pre-launch access + points-boost” campaign model.【6】
How to Participate:
- Log in on the official website
- Complete social tasks such as following NUVA Finance on X and LinkedIn to obtain Genesis Pass minting eligibility
Reminder
Airdrop plans and participation methods are subject to change at any time. Therefore, it is recommended that users follow the official channels of the above projects for the latest updates. Additionally, users should exercise caution, be aware of the risks, and conduct thorough research before participating. Gate does not guarantee the distribution of subsequent airdrop rewards.
Conclusion
During the period from November 11 to November 24, 2025, the crypto market experienced a broad pullback amid concerns over an AI-driven bubble, stronger-than-expected employment data, and a sharp repricing of rate-cut expectations. However, BTC and ETH saw a technical rebound from their lows on November 19–20, with overall price action forming a bottom-building consolidation structure. On-chain capital flows simultaneously entered a redistribution phase: Arbitrum continued to attract incremental inflows, ecosystems such as Solana and Base recovered, while Ethereum mainnet and Hyperliquid recorded notable outflows. Meanwhile, tokenized stocks and ETFs on-chain approached a total value of USD 10 million, accelerating Arbitrum’s trajectory toward becoming an institutional-grade settlement hub. Among the top-500 assets by market cap, the average decline was around 15%, with mid-large caps (market cap 100–200) posting the steepest drops, while mid-small caps saw the most volatility. BEAT surged 436% as the strongest high-beta mover, with AVICI and TEL also performing well, whereas previously overheated assets such as SOON, USELESS, and PLUME corrected 50–70%, reflecting a “high-beta unwinding with structural divergence” pattern.
Volume-price dynamics showed clear dislocation. Despite 10–15x volume spikes, projects such as AGENTFUN, XSO, and EETH failed to generate sustained trend reversals, suggesting that market activity was dominated by arbitrage flows and liquidity probing. Gains were more concentrated within the 200–500 market-cap segment, where high-correlation tokens such as XSO, BEAT, and MOVE reacted strongly to sentiment shifts, while value-oriented assets like BCH and WLFI traded with relative independence. Overall, the market has entered a “structural rotation + volume-price divergence” phase—short-term capital remains cautious, while medium-term structural opportunities still exist.
In addition, the projects tracked during this period—42, Self Protocol, Block Street, and NUVA Finance—are all in active incentive phases. Their respective focuses include prediction-market infrastructure, identity verification and DID ecosystems, on-chain stock simulation and trading, and pre-launch yield-platform point systems. Their ecosystem roles are complementary, with clear incentive pathways. Users can participate through interactions, testing, referrals, or social tasks according to each project’s requirements to accumulate points and increase potential airdrop weight. It is recommended to monitor each project’s announcements and task updates closely to maximize early-stage participation benefits.
Reference:
- CoinGecko, https://www.coingecko.com/
- 42, https://www.42.space/
- Apple, https://apps.apple.com/app/self-zk-passport-identity/id6478563710
- Google, https://play.google.com/store/apps/details?id=com.proofofpassportapp&pli=1
- Block Street, https://blockstreet.money/dashboard
- NUVA Finance, https://app.megaphone.xyz/pages/nuvafinance
Gate Research is a comprehensive blockchain and cryptocurrency research platform that provides deep content for readers, including technical analysis, market insights, industry research, trend forecasting, and macroeconomic policy analysis.
Disclaimer
Investing in cryptocurrency markets involves high risk. Users are advised to conduct their own research and fully understand the nature of the assets and products before making any investment decisions. Gate is not responsible for any losses or damages arising from such decisions.
Share
Content


Related Articles

12 Best Sites to Hunt Crypto Airdrops in 2025

Top 20 Crypto Airdrops in 2025

Gate Research: 2024 Cryptocurrency Market Review and 2025 Trend Forecast
Perpetual Contract Funding Rate Arbitrage Strategy in 2025

Gate Research: BTC Breaks $100K Milestone, November Crypto Trading Volume Exceeds $10 Trillion For First Time