Recent Ethereum Price Movements
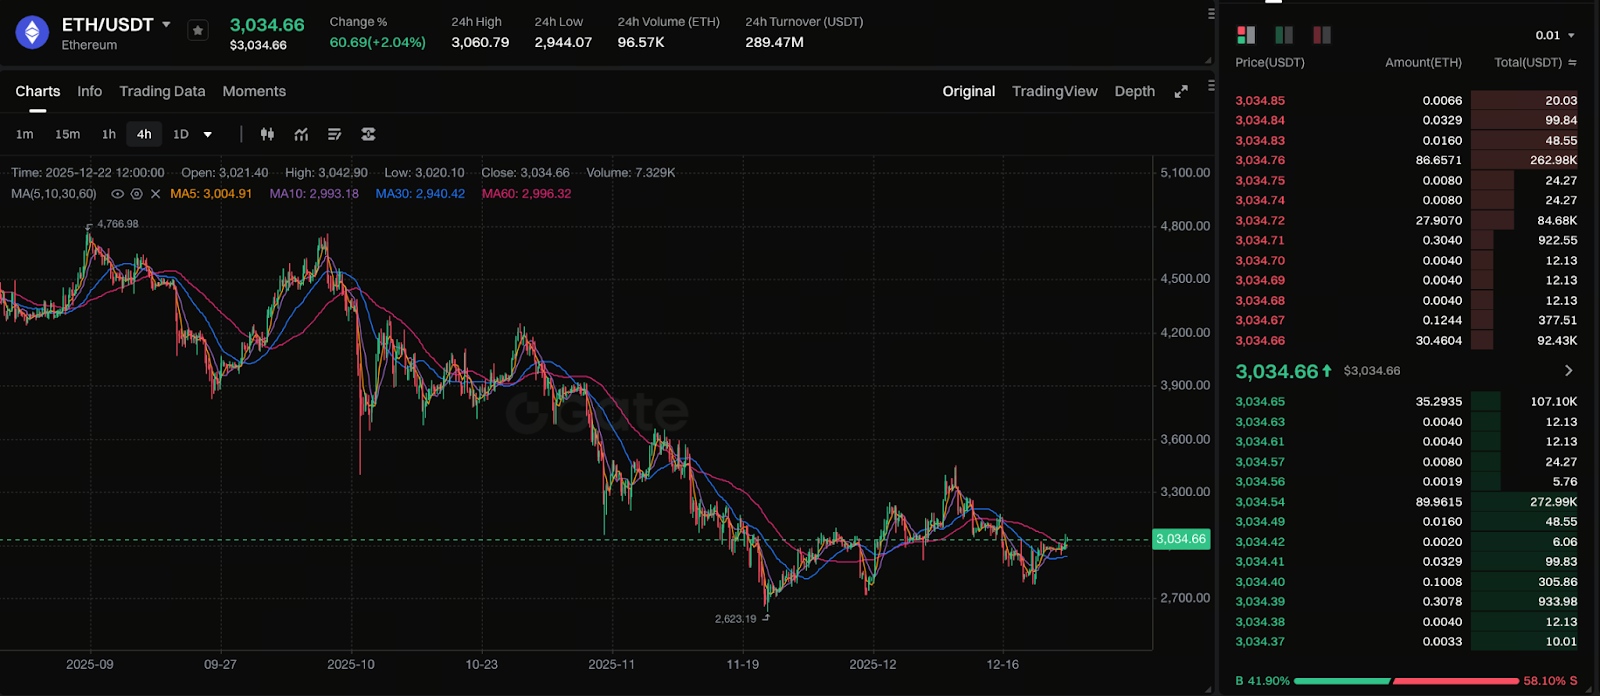
Chart: https://www.gate.com/trade/ETH_USDT
As of December 22, 2025, Ethereum (ETH) pulled back and consolidated after breaking above its previous high. The price briefly rebounded to the upper resistance zone, but increased short-term selling pressure prevented further gains. This action gradually formed a clear ABCD corrective pattern.
Technical indicators show ETH met strong resistance at the 0.618 Fibonacci retracement level. Multiple failed attempts to break this zone highlight persistent selling pressure. On the hourly chart, the price tried to break through local resistance and saw a rebound, but overall trading volume continued to decline. This signals that short-term momentum remains weak and market participation is still cautious.
What Is the ABCD Corrective Pattern?
The ABCD corrective pattern is a classic symmetrical formation in technical analysis, widely used to identify interim pullbacks within a trend:
- A → B: Marks the interim high of the previous rally.
- B → C: Indicates the pullback phase, typically retracing part of the prior advance.
- C → D: Represents the extension of the correction, where the price moves lower to complete the symmetrical structure.
This pattern centers on price symmetry and rhythm. As the ABCD structure nears completion, the market often enters a decisive phase. Prices may shift from correction to consolidation or even attempt to resume an upward move.
Why Is $2,500 a Key Support Level?
In the current technical setup, $2,500 is recognized by many analysts as a major support area on higher time frames. Its significance is reflected in several aspects:
- This range aligns with a previous high-volume trading zone, providing a strong cost basis for support.
- It also marks a recent key low during the pullback.
- If the price decisively breaks this support, the ABCD corrective structure could extend further downward.
- If the price holds and rebounds here, it may establish a temporary bottom and set the stage for a subsequent rally.
As a result, whether $2,500 holds will directly shape ETH’s short- and medium-term trend direction.
Market Sentiment and Volume Analysis
Currently, neither bulls nor bears have a clear advantage. Price action shows capital flows remain balanced, with no signs of extreme sentiment.
Although there have been attempts to rebound, trading volume has not expanded, reinforcing the view that the market is still in a corrective phase. Until volume improves significantly, short-term rebounds are more likely countertrend moves than the start of a new trend.
Potential Strategies for Bulls and Bears
Bullish considerations:
- Monitor the $2,500 support level closely to see if it holds.
- If a bottoming pattern emerges with rising volume, consider scaling in positions gradually.
- For risk management, set stop-losses just below recent lows.
Bearish considerations:
- If the price breaks below $2,500 and confirms a breakdown, consider following the downward trend.
- Watch for potential targets around $2,300 or lower support zones.
- Be mindful of sharp rebounds that may occur with increased volatility.
Potential Future Price Paths
Given the current technical structure, ETH may follow two main scenarios in the coming weeks:
Scenario 1: Correction ends and a rebound follows
If the price holds near $2,500 and trading volume recovers, ETH may retest upper resistance zones.
Scenario 2: Correction extends further
If $2,500 support fails, the ABCD structure may extend downward and the price could test lower key support areas.
Summary
Ethereum remains in a technical correction phase, with $2,500 serving as the critical level for the short- and medium-term outlook. Until the trend becomes clear, patience and close observation of trading volume and key price levels will support more rational responses to market fluctuations.