VT vs STX: Comparing Performance and Features of Virtual Technology and Software-Defined Storage Solutions
Introduction: VT vs STX Investment Comparison
In the cryptocurrency market, the comparison between Vtrading (VT) and Stacks (STX) has been an unavoidable topic for investors. The two not only show significant differences in market cap ranking, application scenarios, and price performance but also represent different positioning in the crypto asset space.
Vtrading (VT): Launched in 2024, it has gained market recognition for its AI-driven quantitative trading services in digital assets.
Stacks (STX): Introduced in 2019, it has been hailed as a new internet for decentralized applications, aiming to empower users with better control over their data.
This article will comprehensively analyze the investment value comparison between VT and STX, focusing on historical price trends, supply mechanisms, institutional adoption, technological ecosystems, and future predictions, attempting to answer the question most important to investors:
"Which is the better buy right now?"
I. Price History Comparison and Current Market Status
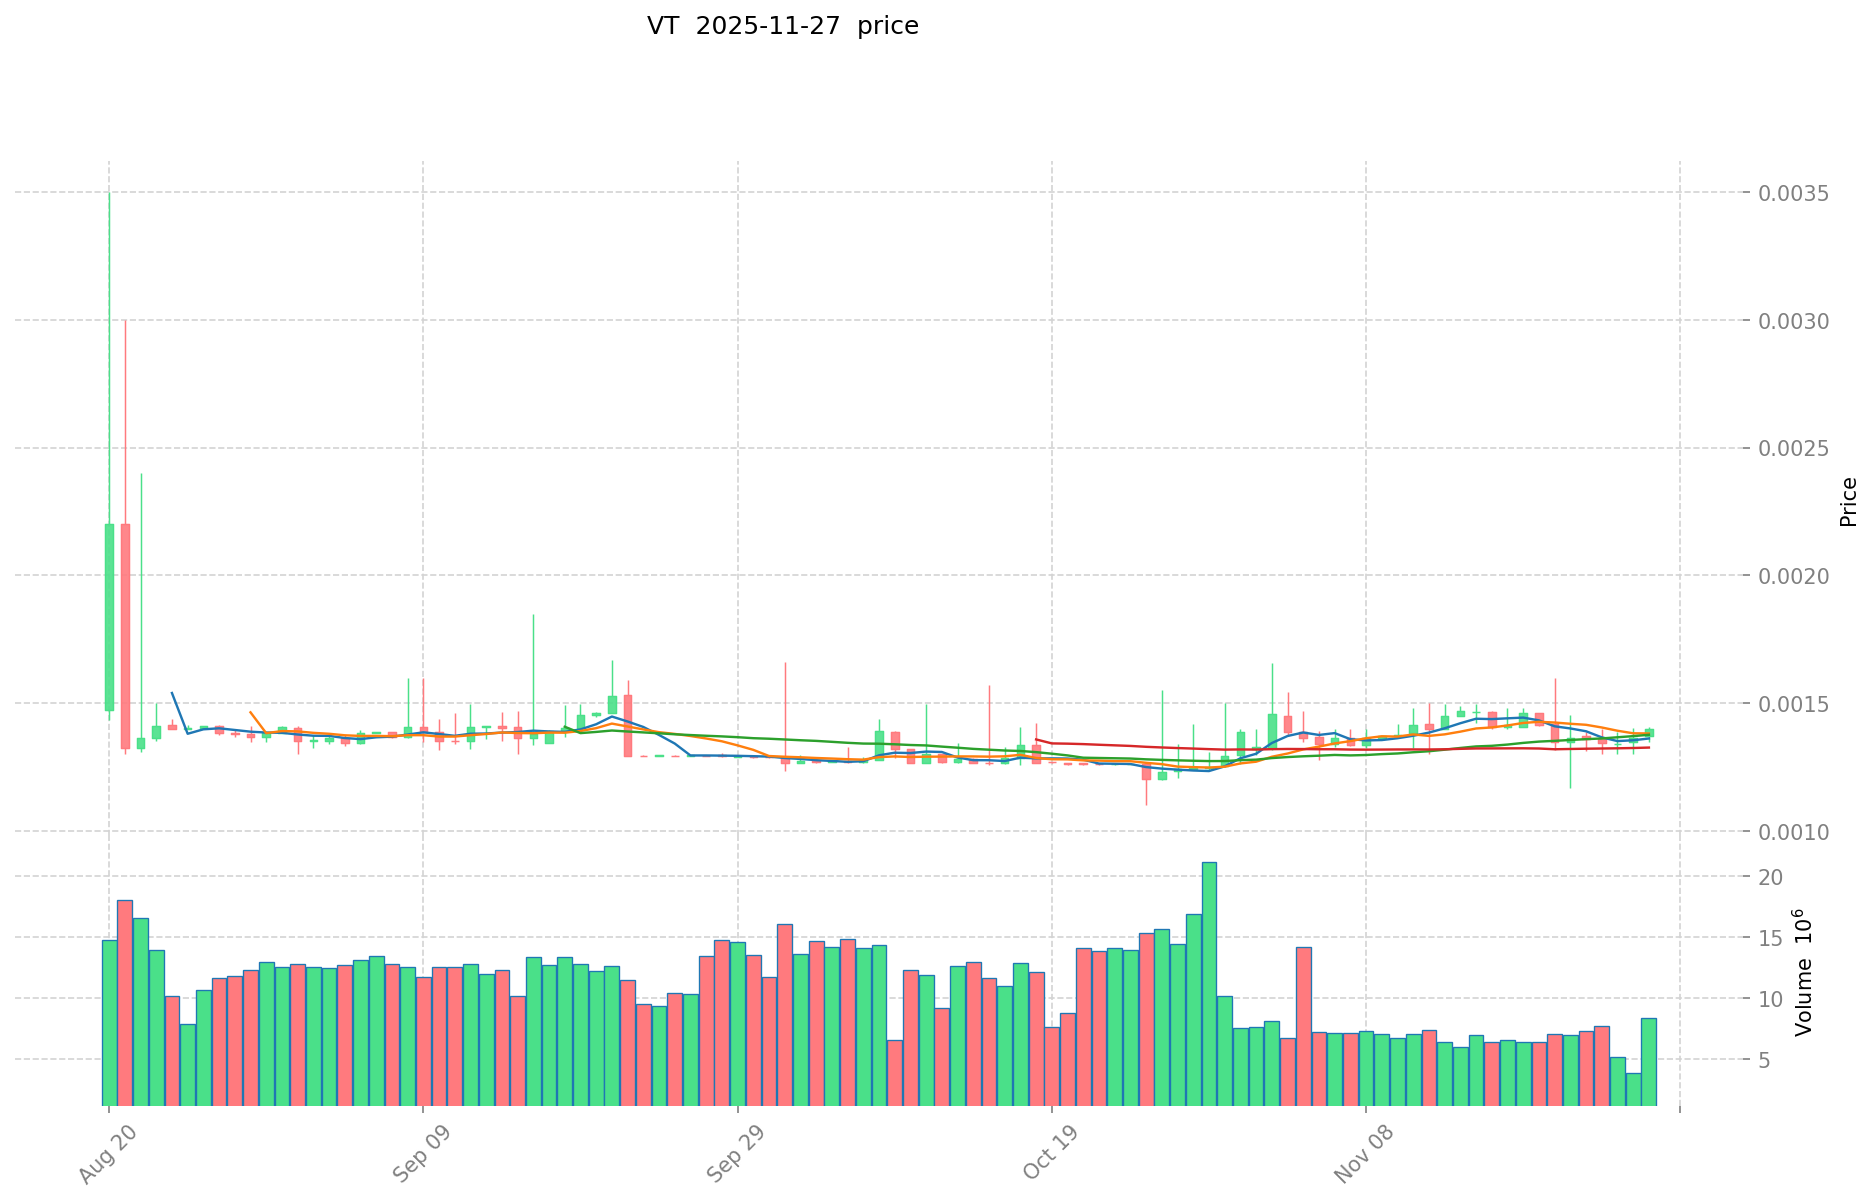
VT and STX Historical Price Trends
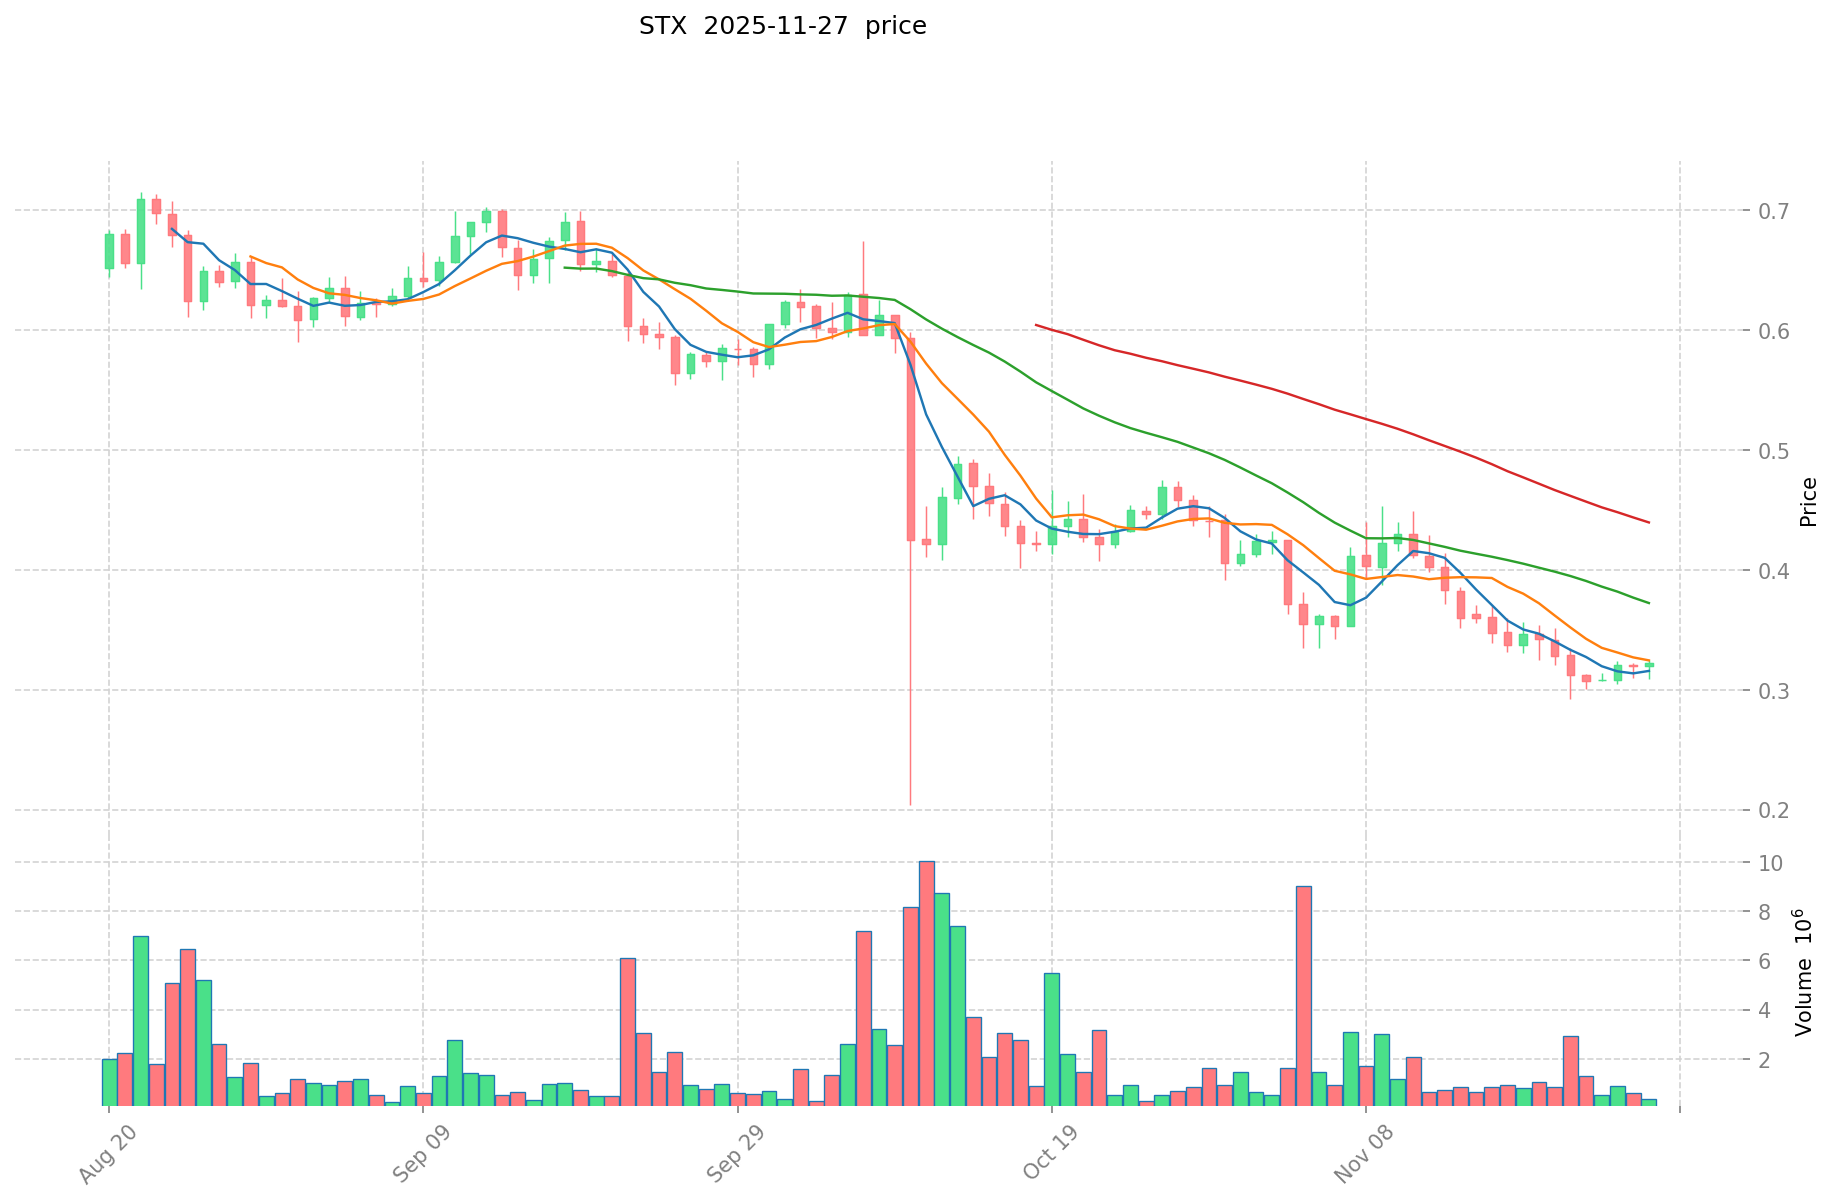
- 2024: STX reached its all-time high of $3.86 on April 1, 2024.
- 2025: VT hit its all-time high of $0.225 on May 28, 2025, followed by a significant drop to its all-time low of $0.001026 on July 17, 2025.
- Comparative Analysis: In the recent market cycle, VT experienced a dramatic decline from $0.225 to $0.001026, while STX has shown relatively more stability, currently trading at $0.3211.
Current Market Situation (2025-11-27)
- VT current price: $0.001553
- STX current price: $0.3211
- 24-hour trading volume: VT $12,014.58 vs STX $208,470.19
- Market Sentiment Index (Fear & Greed Index): 22 (Extreme Fear)
Click to view real-time prices:
- Check VT current price Market Price
- Check STX current price Market Price
II. Core Factors Affecting the Investment Value of VT vs STX
Supply Mechanism Comparison (Tokenomics)
- VT: Insufficient information about supply mechanism.
- STX: Stacking rewards mechanism where users can earn Bitcoin rewards by locking up their STX tokens.
- 📌 Historical Pattern: Supply mechanisms typically influence price cycles through scarcity principles and reward structures. STX's Bitcoin reward system creates a unique value proposition linked to BTC performance.
Institutional Adoption and Market Applications
- Institutional Holdings: Insufficient information about institutional preferences between these assets.
- Enterprise Adoption: STX is being utilized for Web3 applications and Bitcoin DeFi solutions, enabling smart contracts functionality on Bitcoin's network.
- National Policies: Regulatory approaches vary by country, but specific information about VT/STX regulation is not available.
Technical Development and Ecosystem Building
- STX Technical Development: Stacks enables Bitcoin L2 development and smart contracts functionality for Bitcoin, significantly expanding Bitcoin's utility beyond simple transactions.
- Ecosystem Comparison: STX is building a DeFi ecosystem on Bitcoin, offering staking rewards in BTC and enabling smart contract functionality that wasn't previously available on Bitcoin's network.
Macroeconomic and Market Cycles
- Performance in Inflationary Environments: Insufficient specific information about inflation resistance properties.
- Macroeconomic Monetary Policy: Insufficient information about how interest rates and USD index specifically affect these assets.
- Geopolitical Factors: Insufficient information about cross-border transaction demands related to these specific assets.
III. 2025-2030 Price Prediction: VT vs STX
Short-term Prediction (2025)
- VT: Conservative $0.00098368 - $0.001537 | Optimistic $0.001537 - $0.00187514
- STX: Conservative $0.237466 - $0.3209 | Optimistic $0.3209 - $0.410752
Mid-term Prediction (2027)
- VT may enter a growth phase, with estimated price range $0.001576920501 - $0.0025675500465
- STX may enter a steady growth phase, with estimated price range $0.3412424928 - $0.4343086272
- Key drivers: Institutional fund inflows, ETF developments, ecosystem growth
Long-term Prediction (2030)
- VT: Base scenario $0.00335903904575 - $0.004534702711763 | Optimistic scenario $0.004534702711763+
- STX: Base scenario $0.442384053237 - $0.54413238548151 | Optimistic scenario $0.54413238548151+
Disclaimer: The above predictions are based on historical data and current market trends. Cryptocurrency markets are highly volatile and subject to change. This information should not be considered as financial advice. Always conduct your own research before making investment decisions.
VT:
| 年份 | 预测最高价 | 预测平均价格 | 预测最低价 | 涨跌幅 |
|---|---|---|---|---|
| 2025 | 0.00187514 | 0.001537 | 0.00098368 | -1 |
| 2026 | 0.0023373159 | 0.00170607 | 0.0016378272 | 9 |
| 2027 | 0.0025675500465 | 0.00202169295 | 0.001576920501 | 30 |
| 2028 | 0.003327201172462 | 0.00229462149825 | 0.001399719113932 | 47 |
| 2029 | 0.003907166756145 | 0.002810911335356 | 0.002614147541881 | 80 |
| 2030 | 0.004534702711763 | 0.00335903904575 | 0.002855183188888 | 116 |
STX:
| 年份 | 预测最高价 | 预测平均价格 | 预测最低价 | 涨跌幅 |
|---|---|---|---|---|
| 2025 | 0.410752 | 0.3209 | 0.237466 | 0 |
| 2026 | 0.40972512 | 0.365826 | 0.32558514 | 13 |
| 2027 | 0.4343086272 | 0.38777556 | 0.3412424928 | 20 |
| 2028 | 0.43159419828 | 0.4110420936 | 0.312391991136 | 27 |
| 2029 | 0.463449960534 | 0.42131814594 | 0.2612172504828 | 30 |
| 2030 | 0.54413238548151 | 0.442384053237 | 0.26985427247457 | 37 |
IV. Investment Strategy Comparison: VT vs STX
Long-term vs Short-term Investment Strategies
- VT: Suitable for investors interested in AI-driven quantitative trading services in digital assets
- STX: Suitable for investors focused on Bitcoin ecosystem expansion and decentralized applications
Risk Management and Asset Allocation
- Conservative investors: VT: 20% vs STX: 80%
- Aggressive investors: VT: 40% vs STX: 60%
- Hedging tools: Stablecoin allocation, options, cross-currency portfolio
V. Potential Risk Comparison
Market Risks
- VT: High volatility, significant price drops in recent history
- STX: Relatively more stable, but still subject to overall crypto market trends
Technical Risks
- VT: Scalability, network stability
- STX: Dependence on Bitcoin network, potential smart contract vulnerabilities
Regulatory Risks
- Global regulatory policies may have different impacts on both assets, with potential increased scrutiny on AI-driven trading platforms and DeFi applications
VI. Conclusion: Which Is the Better Buy?
📌 Investment Value Summary:
- VT advantages: AI-driven quantitative trading, potential for high returns in favorable market conditions
- STX advantages: Bitcoin ecosystem integration, stacking rewards mechanism, established presence in the market
✅ Investment Advice:
- New investors: Consider a smaller allocation to STX as part of a diversified crypto portfolio
- Experienced investors: Balanced approach with both VT and STX, adjusting based on risk tolerance
- Institutional investors: Focus on STX for its Bitcoin ecosystem integration and more established market presence
⚠️ Risk Warning: The cryptocurrency market is highly volatile, and this article does not constitute investment advice. None
VII. FAQ
Q1: What are the main differences between VT and STX? A: VT is focused on AI-driven quantitative trading services in digital assets, launched in 2024. STX, introduced in 2019, aims to enable decentralized applications and smart contracts on the Bitcoin network.
Q2: Which asset has shown better price stability recently? A: Based on the available information, STX has shown relatively more stability compared to VT. VT experienced a significant price drop from $0.225 to $0.001026 in 2025, while STX is currently trading at $0.3211.
Q3: What unique feature does STX offer to investors? A: STX offers a stacking rewards mechanism where users can earn Bitcoin rewards by locking up their STX tokens. This creates a unique value proposition linked to Bitcoin's performance.
Q4: How does STX contribute to the Bitcoin ecosystem? A: STX enables Bitcoin L2 development and smart contracts functionality for Bitcoin, significantly expanding Bitcoin's utility beyond simple transactions and building a DeFi ecosystem on Bitcoin.
Q5: What are the predicted price ranges for VT and STX in 2030? A: For VT, the base scenario predicts a range of $0.00335903904575 - $0.004534702711763. For STX, the base scenario predicts a range of $0.442384053237 - $0.54413238548151.
Q6: How might a conservative investor allocate between VT and STX? A: A conservative investment strategy suggests allocating 20% to VT and 80% to STX.
Q7: What are the main risks associated with investing in VT and STX? A: VT risks include high volatility and significant price drops. STX risks include dependence on the Bitcoin network and potential smart contract vulnerabilities. Both face regulatory risks as global policies evolve.
Q8: Which asset might be more suitable for new crypto investors? A: For new investors, STX might be more suitable as part of a diversified crypto portfolio due to its more established market presence and integration with the Bitcoin ecosystem.
Share
Content
Introduction: VT vs STX Investment Comparison
I. Price History Comparison and Current Market Status
II. Core Factors Affecting the Investment Value of VT vs STX
III. 2025-2030 Price Prediction: VT vs STX
IV. Investment Strategy Comparison: VT vs STX
V. Potential Risk Comparison
VI. Conclusion: Which Is the Better Buy?
VII. FAQ

