TONC vs GRT: Comparing Two Emerging Blockchain Platforms for Enterprise Solutions
Introduction: TONC vs GRT Investment Comparison
In the cryptocurrency market, the comparison between TONC vs GRT has always been a topic investors can't ignore. The two not only show significant differences in market cap ranking, application scenarios, and price performance, but also represent different cryptocurrency asset positioning.
TONCommunity (TONC): Launched in 2020, it has gained market recognition for its decentralized global blockchain network.
The Graph (GRT): Since its inception in 2020, it has been hailed as a decentralized protocol for indexing and querying blockchain data, becoming one of the cryptocurrencies with high global trading volume and market capitalization.
This article will comprehensively analyze the investment value comparison between TONC vs GRT, focusing on historical price trends, supply mechanisms, institutional adoption, technological ecosystems, and future predictions, and attempt to answer the question investors are most concerned about:
"Which is the better buy right now?"
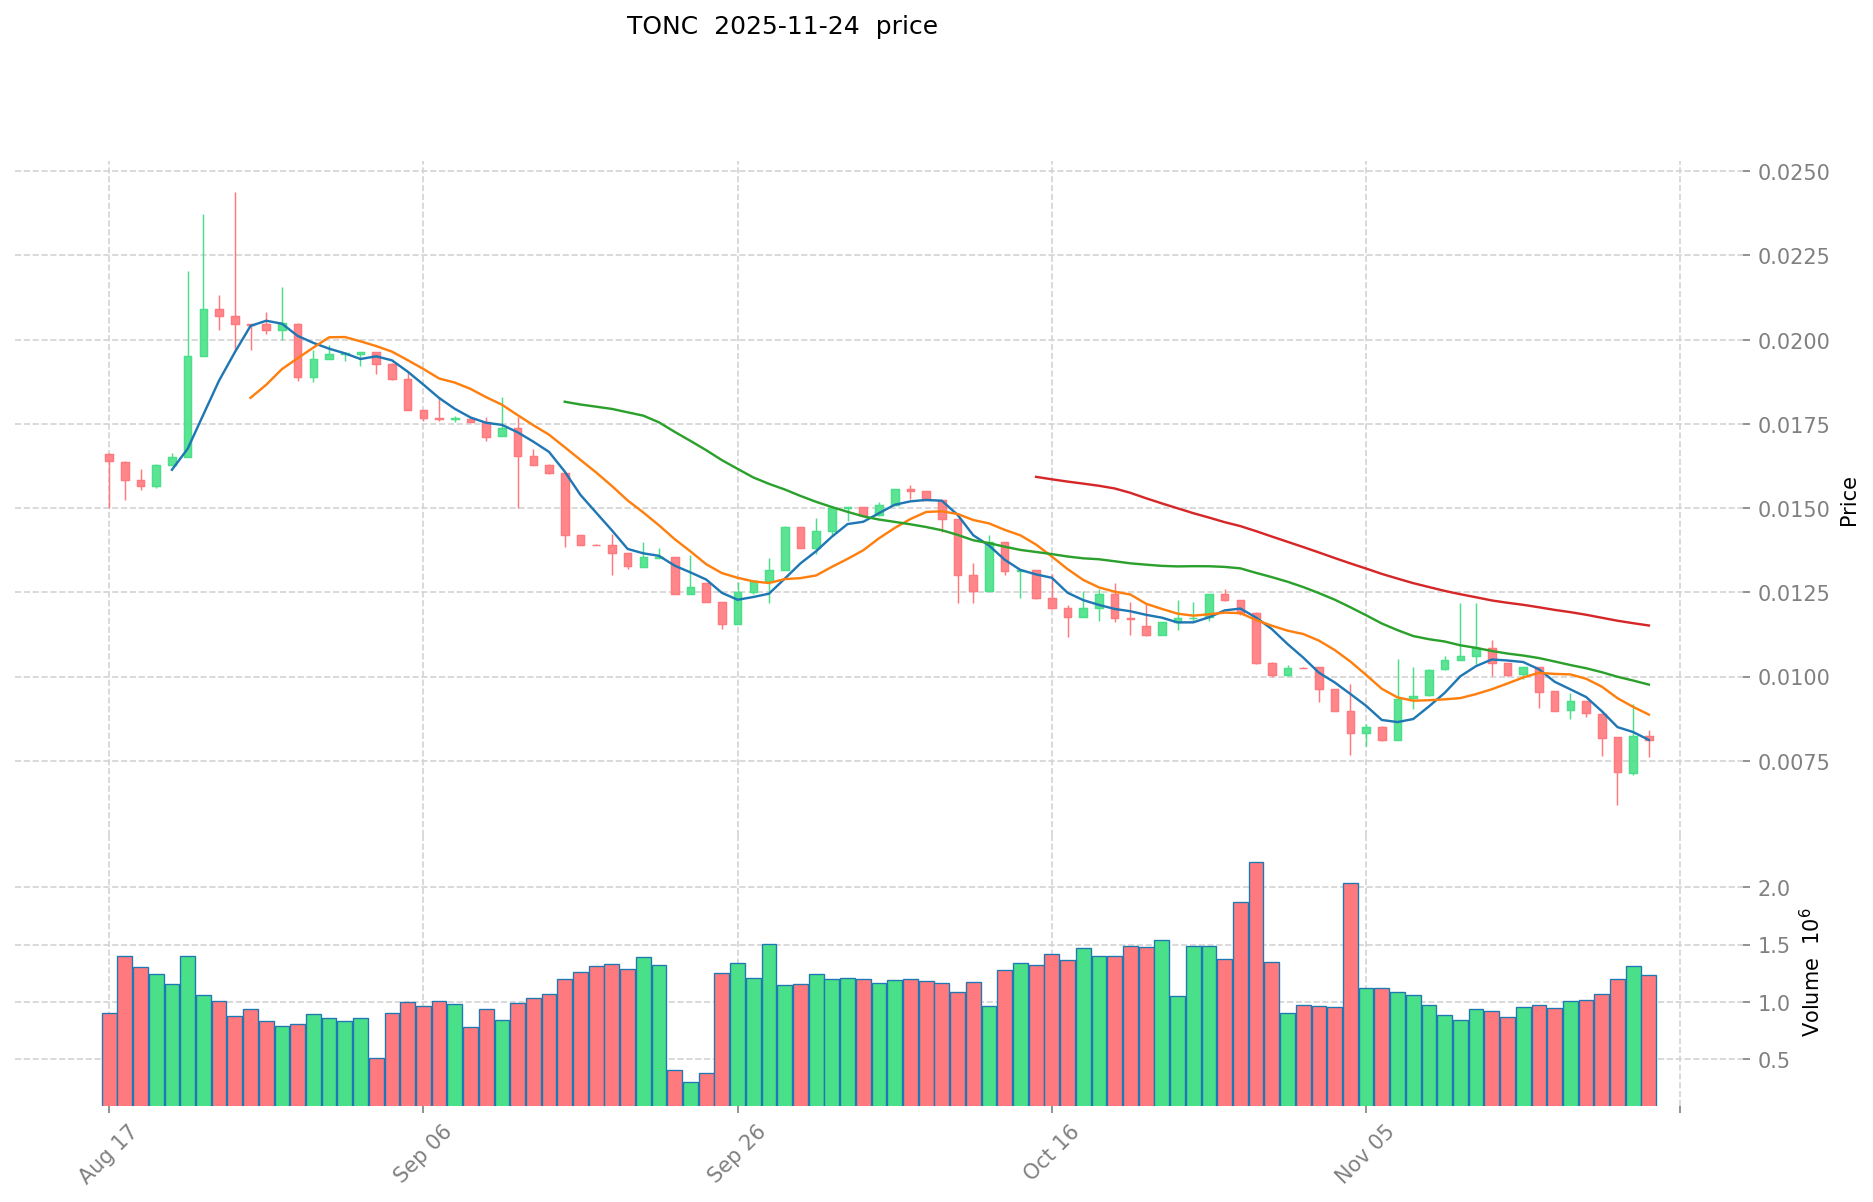
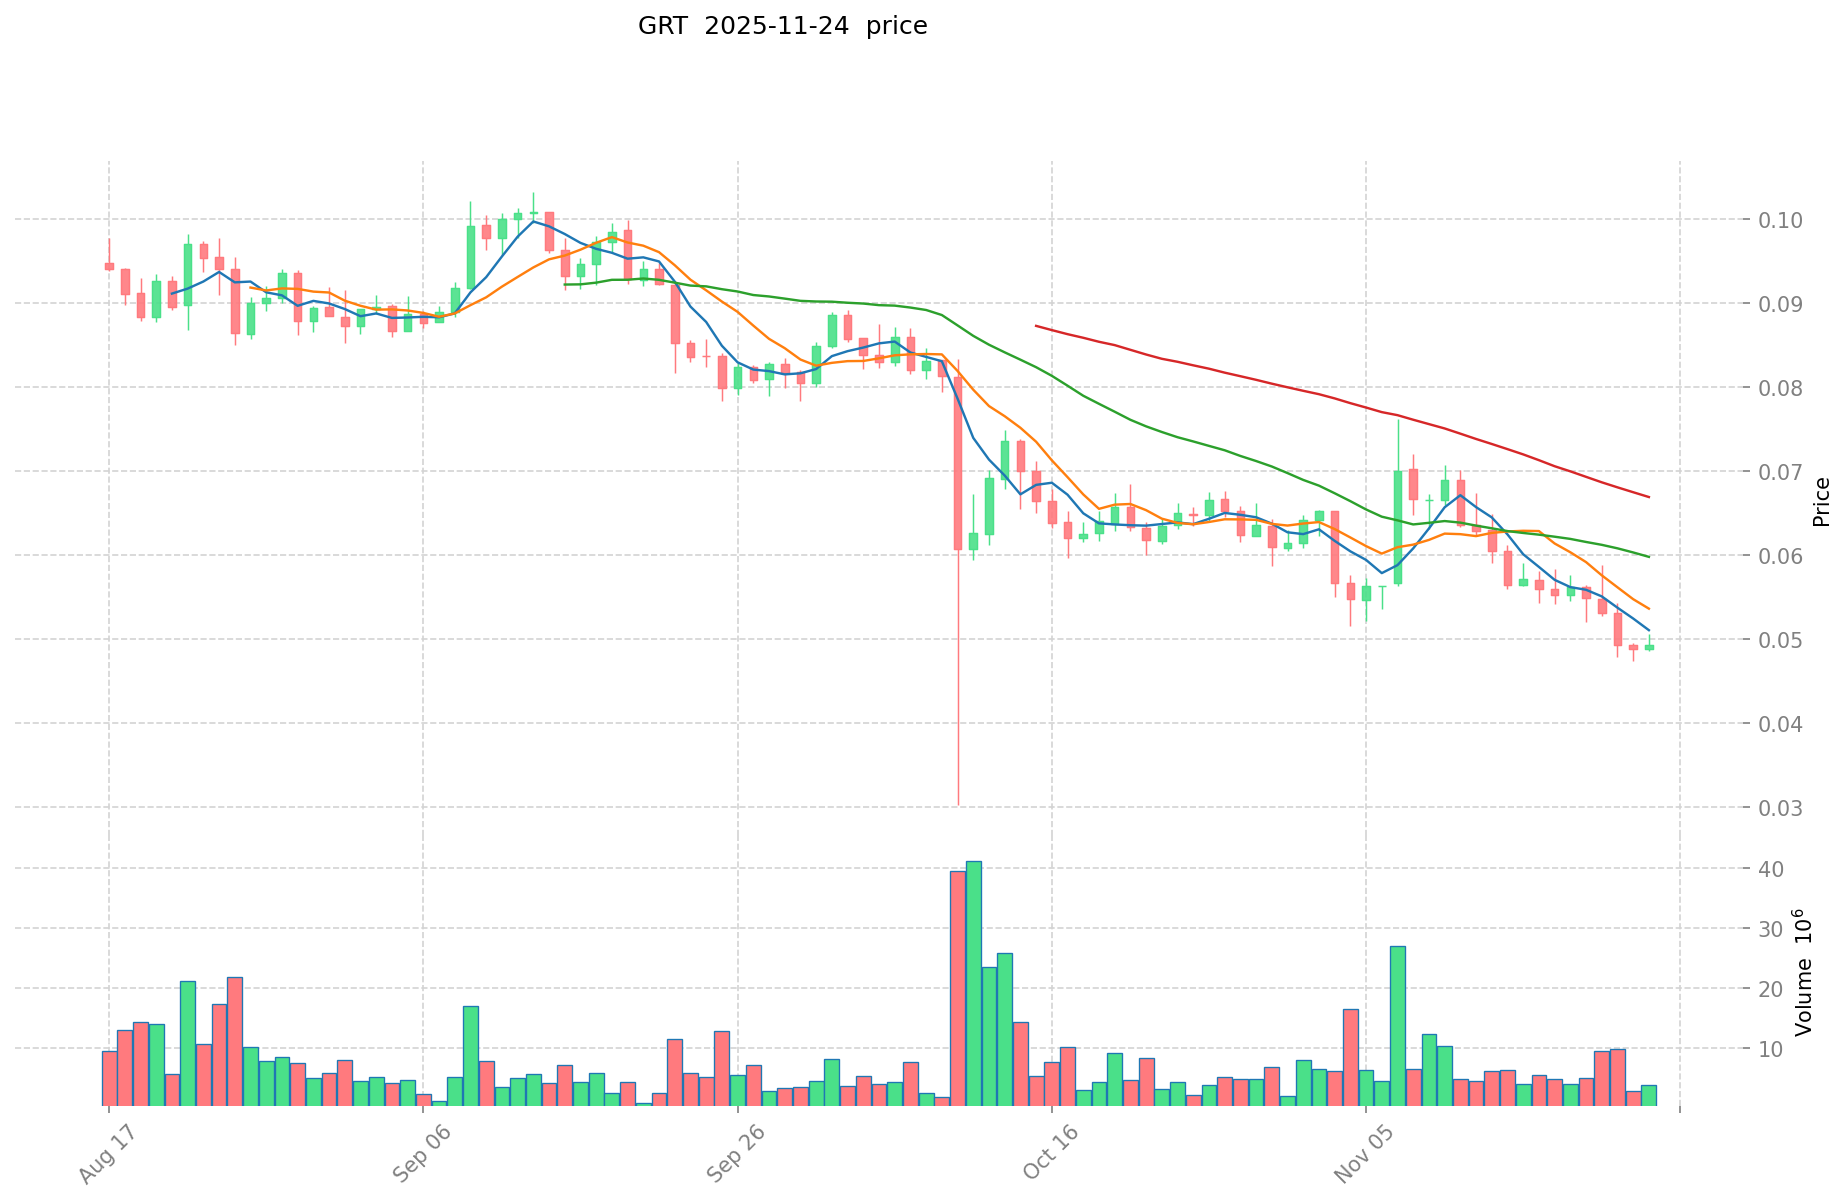
I. Price History Comparison and Current Market Status
TONC and GRT Historical Price Trends
- 2020: TONC launched on May 7, 2020, on TONOS blockchain.
- 2021: GRT reached its all-time high of $2.84 on February 12, 2021.
- Comparative analysis: TONC has fallen from its all-time high of $0.104949 to a current price of $0.008269, while GRT has declined from its peak of $2.84 to $0.05047.
Current Market Situation (2025-11-24)
- TONC current price: $0.008269
- GRT current price: $0.05047
- 24-hour trading volume: TONC $10,015.08 vs GRT $186,885.41
- Market Sentiment Index (Fear & Greed Index): 19 (Extreme Fear)
Click to view real-time prices:
- View TONC current price Market Price
- View GRT current price Market Price
II. Core Factors Affecting the Investment Value of TONC vs GRT
Supply Mechanism Comparison (Tokenomics)
- TONC: Unclear supply mechanism based on available data
- GRT: Total supply of 10 billion tokens with deflationary mechanics through query fees that are burned
- 📌 Historical Pattern: Deflationary mechanisms like GRT's token burning tend to create upward price pressure over time if network usage grows.
Institutional Adoption and Market Applications
- Institutional Holdings: Insufficient data on institutional preference between TONC and GRT
- Enterprise Adoption: GRT has established itself as the indexing protocol for blockchain data, serving many Web3 applications
- National Policies: Regulatory approaches vary by jurisdiction, with neither token facing specific regulatory challenges based on available data
Technical Development and Ecosystem Building
- TONC Technical Upgrades: Insufficient data on specific technical developments
- GRT Technical Development: Continuous improvements to The Graph protocol's indexing and query capabilities
- Ecosystem Comparison: GRT has a well-established ecosystem with over 40,000 subgraphs serving various DeFi, NFT, and other Web3 applications
Macroeconomic Factors and Market Cycles
- Performance in Inflationary Environments: Insufficient data on comparative inflation resistance
- Macroeconomic Monetary Policy: Both tokens likely affected by broader crypto market reactions to interest rates and USD strength
- Geopolitical Factors: The Graph's decentralized data infrastructure may benefit from increased global demand for censorship-resistant data services
III. 2025-2030 Price Predictions: TONC vs GRT
Short-term Forecast (2025)
- TONC: Conservative $0.00702865 - $0.008269 | Optimistic $0.008269 - $0.00884783
- GRT: Conservative $0.0330132 - $0.05002 | Optimistic $0.05002 - $0.0690276
Mid-term Forecast (2027)
- TONC may enter a growth phase, with prices expected in the range of $0.008703908055 - $0.0111216602925
- GRT may enter a bullish market, with prices expected in the range of $0.06602379896 - $0.07515474988
- Key drivers: Institutional capital inflow, ETFs, ecosystem development
Long-term Forecast (2030)
- TONC: Base scenario $0.01425181531554 - $0.015391960540783 | Optimistic scenario $0.015391960540783+
- GRT: Base scenario $0.090883243047964 - $0.121783545684272 | Optimistic scenario $0.121783545684272+
Disclaimer: This forecast is for informational purposes only and should not be considered as financial advice. Cryptocurrency markets are highly volatile and unpredictable. Always conduct your own research before making any investment decisions.
TONC:
| 年份 | 预测最高价 | 预测平均价格 | 预测最低价 | 涨跌幅 |
|---|---|---|---|---|
| 2025 | 0.00884783 | 0.008269 | 0.00702865 | 0 |
| 2026 | 0.0107836029 | 0.008558415 | 0.00710348445 | 3 |
| 2027 | 0.0111216602925 | 0.00967100895 | 0.008703908055 | 16 |
| 2028 | 0.015282611893237 | 0.01039633462125 | 0.005925910734112 | 25 |
| 2029 | 0.015664157373837 | 0.012839473257243 | 0.007703683954346 | 55 |
| 2030 | 0.015391960540783 | 0.01425181531554 | 0.013539224549763 | 72 |
GRT:
| 年份 | 预测最高价 | 预测平均价格 | 预测最低价 | 涨跌幅 |
|---|---|---|---|---|
| 2025 | 0.0690276 | 0.05002 | 0.0330132 | 0 |
| 2026 | 0.080952368 | 0.0595238 | 0.052976182 | 17 |
| 2027 | 0.07515474988 | 0.070238084 | 0.06602379896 | 39 |
| 2028 | 0.0806930228034 | 0.07269641694 | 0.0632458827378 | 44 |
| 2029 | 0.105071766224229 | 0.0766947198717 | 0.050618515115322 | 51 |
| 2030 | 0.121783545684272 | 0.090883243047964 | 0.086339080895566 | 80 |
IV. Investment Strategy Comparison: TONC vs GRT
Long-term vs Short-term Investment Strategies
- TONC: Suitable for investors focused on blockchain network potential
- GRT: Suitable for investors interested in data indexing and Web3 infrastructure
Risk Management and Asset Allocation
- Conservative investors: TONC: 30% vs GRT: 70%
- Aggressive investors: TONC: 50% vs GRT: 50%
- Hedging tools: Stablecoin allocation, options, cross-currency portfolios
V. Potential Risk Comparison
Market Risks
- TONC: Limited market data and trading volume
- GRT: Volatility tied to overall crypto market conditions
Technical Risks
- TONC: Scalability, network stability (insufficient data for detailed assessment)
- GRT: Potential indexing challenges, protocol upgrades
Regulatory Risks
- Global regulatory policies may impact both tokens differently, with GRT potentially facing scrutiny as a utility token for data services
VI. Conclusion: Which Is the Better Buy?
📌 Investment Value Summary:
- TONC advantages: Potential for growth in the TON ecosystem
- GRT advantages: Established role in blockchain data indexing, wide adoption in Web3 applications
✅ Investment Advice:
- Novice investors: Consider a small allocation to GRT due to its more established market presence
- Experienced investors: Balanced approach with both TONC and GRT, aligning with risk tolerance
- Institutional investors: Focus on GRT for its utility in blockchain data infrastructure
⚠️ Risk Warning: The cryptocurrency market is highly volatile. This article does not constitute investment advice. None
VII. FAQ
Q1: What are the main differences between TONC and GRT? A: TONC is a token associated with the TON blockchain network, while GRT is the native token of The Graph protocol, which focuses on indexing and querying blockchain data. GRT has a more established market presence and ecosystem, with higher trading volumes and market capitalization compared to TONC.
Q2: Which token has performed better historically? A: Based on the available data, GRT has shown a more notable price history, reaching an all-time high of $2.84 in February 2021. TONC's historical performance is less clear, with limited data on its price movements.
Q3: How do the supply mechanisms of TONC and GRT differ? A: GRT has a clear supply mechanism with a total supply of 10 billion tokens and a deflationary model through query fee burning. TONC's supply mechanism is unclear based on the available data.
Q4: Which token has better institutional adoption? A: GRT appears to have stronger institutional adoption, serving as the indexing protocol for many Web3 applications. There is insufficient data on TONC's institutional adoption.
Q5: What are the long-term price predictions for TONC and GRT? A: By 2030, TONC is predicted to reach a base scenario of $0.01425181531554 - $0.015391960540783, while GRT is expected to reach $0.090883243047964 - $0.121783545684272 in the base scenario.
Q6: How should investors allocate their portfolio between TONC and GRT? A: Conservative investors might consider allocating 30% to TONC and 70% to GRT, while aggressive investors might opt for a 50-50 split. The exact allocation should depend on individual risk tolerance and investment goals.
Q7: What are the main risks associated with investing in TONC and GRT? A: TONC faces risks related to limited market data and trading volume, while GRT's main risks include market volatility and potential technical challenges in indexing. Both tokens may be affected by regulatory risks in the cryptocurrency space.
Share
Content
Introduction: TONC vs GRT Investment Comparison
I. Price History Comparison and Current Market Status
II. Core Factors Affecting the Investment Value of TONC vs GRT
III. 2025-2030 Price Predictions: TONC vs GRT
IV. Investment Strategy Comparison: TONC vs GRT
V. Potential Risk Comparison
VI. Conclusion: Which Is the Better Buy?
VII. FAQ

