TNK vs BNB: The Battle of Blockchain Titans Shaping the Future of Decentralized Finance
Introduction: TNK vs BNB Investment Comparison
In the cryptocurrency market, the comparison between Trac Network (TNK) vs Binance Coin (BNB) has been an unavoidable topic for investors. The two not only show significant differences in market cap ranking, application scenarios, and price performance, but also represent different positioning in crypto assets.
Trac Network (TNK): Since its launch, it has gained market recognition as a groundbreaking local-first Layer 1 and true peer-to-peer crypto network.
Binance Coin (BNB): Introduced in 2017, it has been hailed as the fuel for the Binance ecosystem and is one of the cryptocurrencies with the highest global trading volume and market capitalization.
This article will provide a comprehensive analysis of the investment value comparison between TNK and BNB, focusing on historical price trends, supply mechanisms, institutional adoption, technological ecosystems, and future predictions, attempting to answer the question investors are most concerned about:
"Which is the better buy right now?"
I. Price History Comparison and Current Market Status
TNK and BNB Historical Price Trends
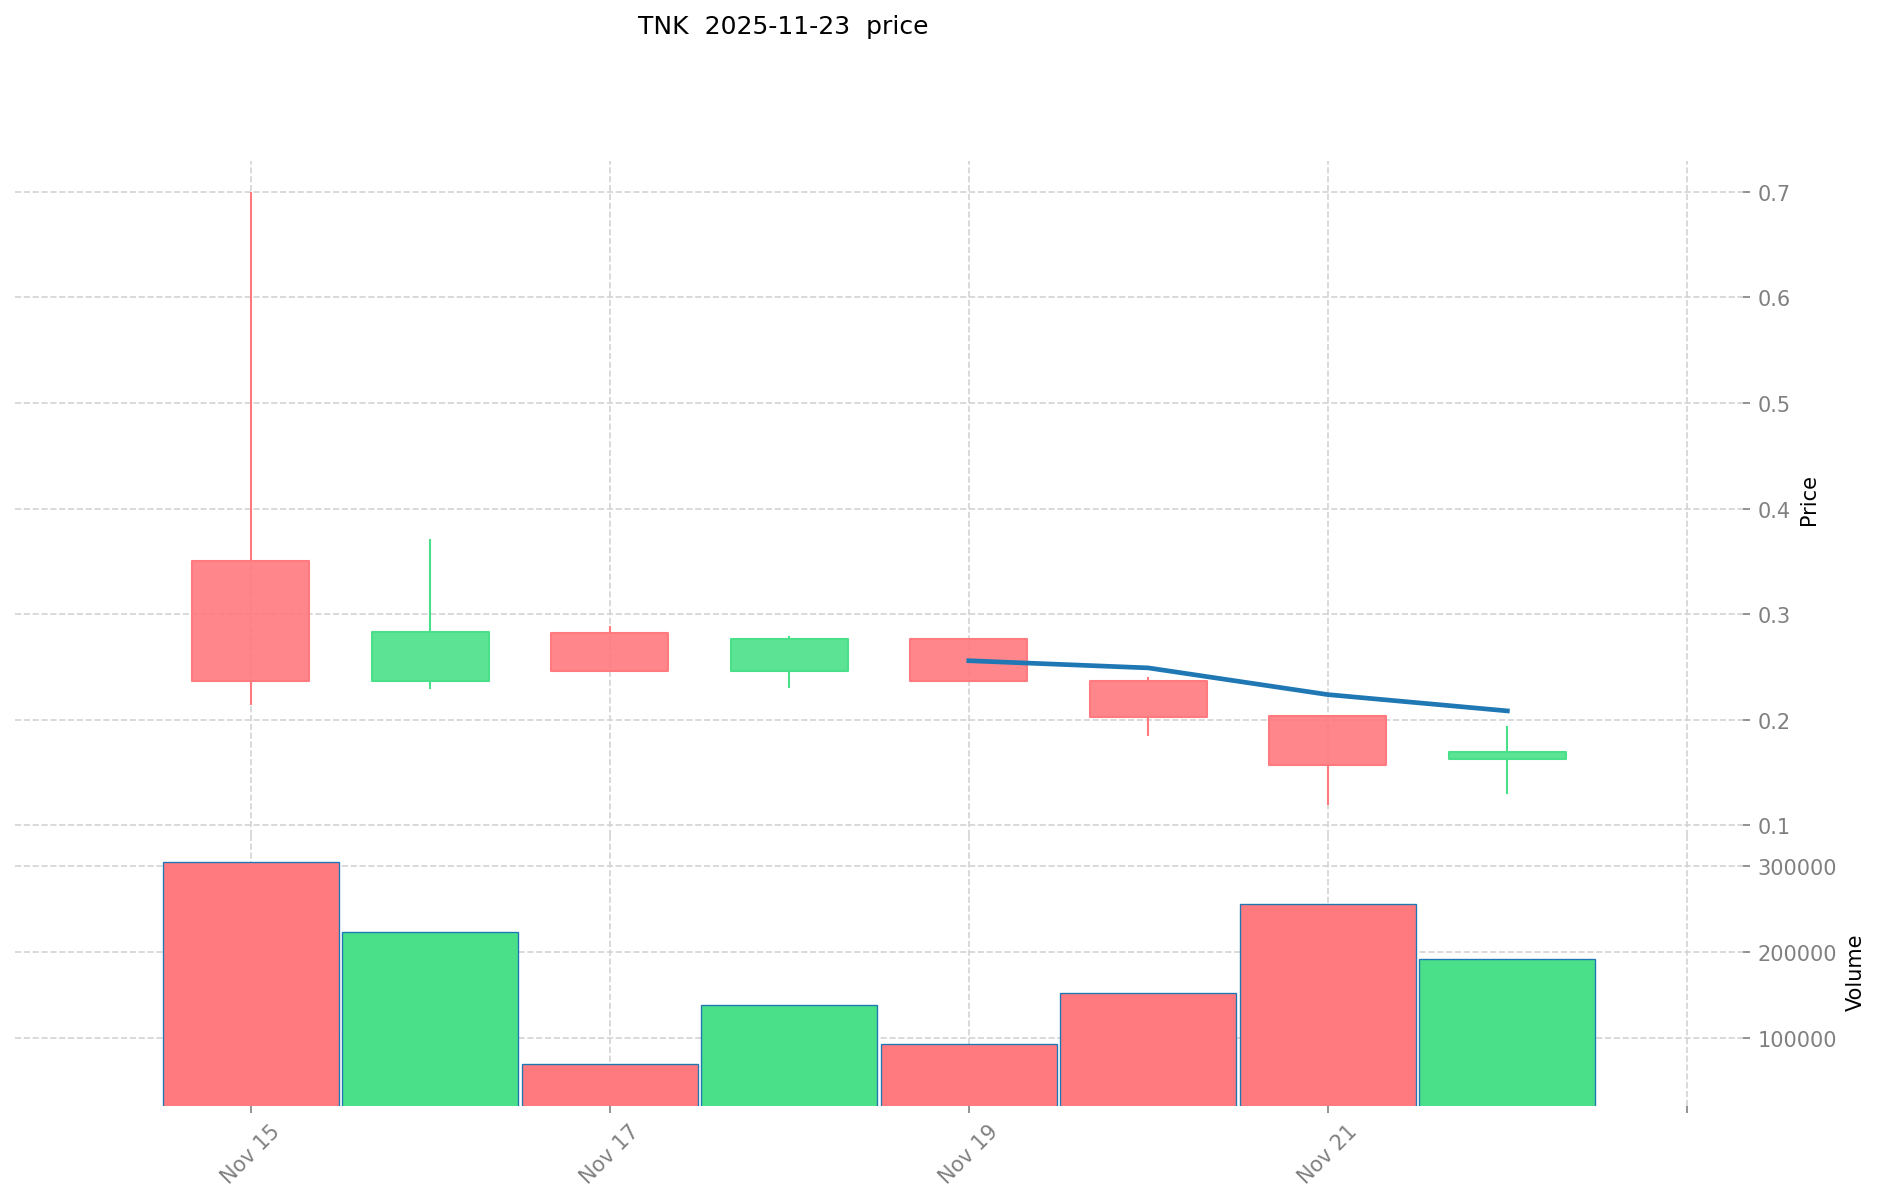
- 2025: TNK reached its all-time high of $0.7 on November 15, then dropped to its all-time low of $0.119 on November 21.
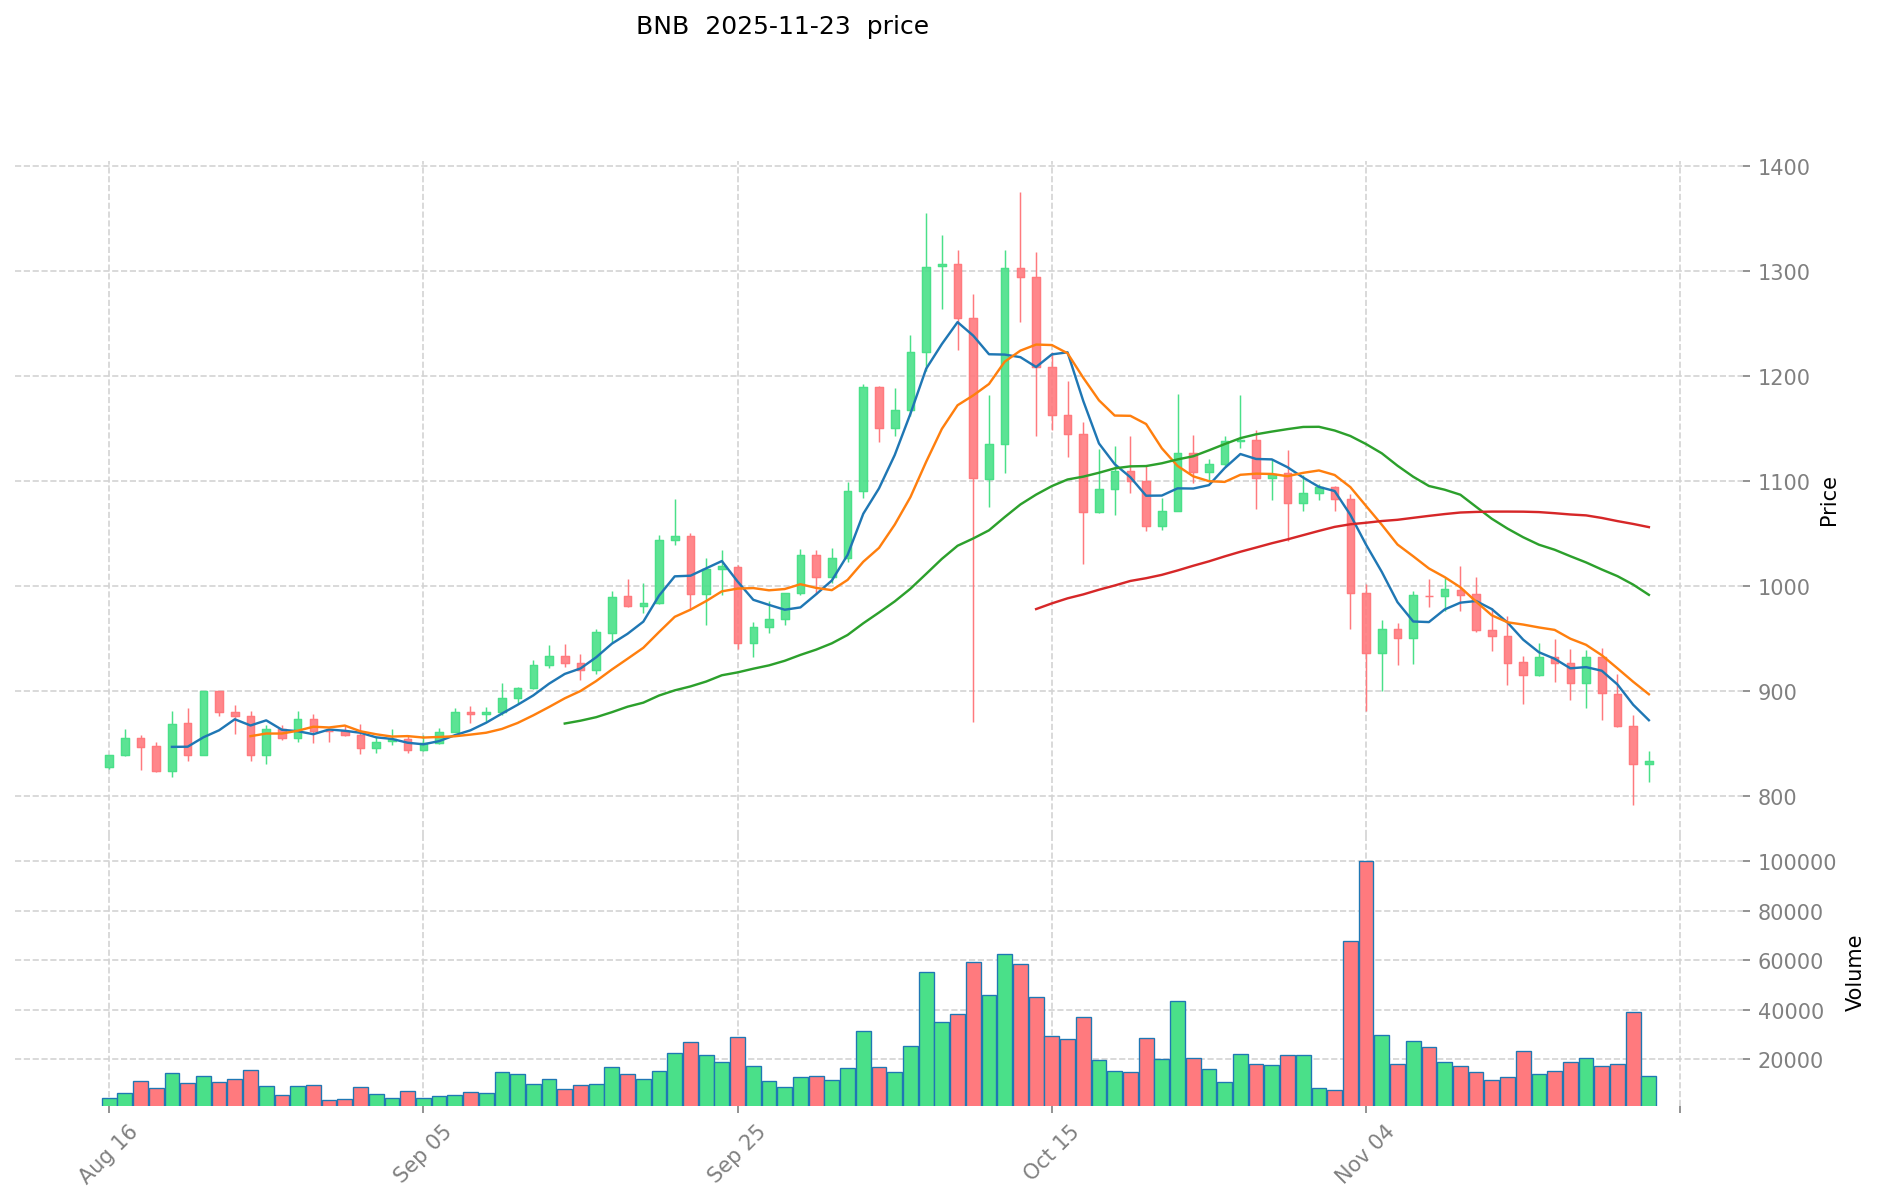
- 2025: BNB hit its all-time high of $1,369.99 on October 13, showing significant growth from its all-time low of $0.0398177 in 2017.
- Comparative analysis: In this short period, TNK experienced extreme volatility, while BNB demonstrated more stable long-term growth since its inception.
Current Market Situation (2025-11-23)
- TNK current price: $0.1623
- BNB current price: $843.6
- 24-hour trading volume: TNK $28,717.45 vs BNB $9,225,980.50
- Market Sentiment Index (Fear & Greed Index): 13 (Extreme Fear)
Click to view real-time prices:
- Check TNK current price Market Price
- Check BNB current price Market Price
II. Project Overview and Technology Comparison
TNK (Trac Network)
- Description: A groundbreaking local-first Layer 1 and true peer-to-peer crypto network
- Key features: Enables business & consumer-grade applications without compromises
- Technology: Local-first Layer 1 protocol
BNB (Binance Coin)
- Description: A decentralized digital asset issued by Binance
- Key features: Used for transaction fee discounts, payments, and as utility token in the Binance ecosystem
- Technology: Originally an ERC-20 token, now the native coin of Binance Smart Chain
Comparative Analysis
- TNK focuses on being a local-first Layer 1 solution, while BNB has evolved from an exchange token to a multi-chain ecosystem coin
- BNB has a more established ecosystem and wider adoption compared to the newer TNK project
III. Market Performance and Financial Metrics
TNK (Trac Network)
- Market Cap: $3,408,300
- Circulating Supply: 21,000,000 TNK
- 24h Trading Volume: $28,717.45
- All-Time High: $0.7 (Nov 15, 2025)
- All-Time Low: $0.119 (Nov 21, 2025)
BNB (Binance Coin)
- Market Cap: $116,194,627,428
- Circulating Supply: 137,736,637.54 BNB
- 24h Trading Volume: $9,225,980.50
- All-Time High: $1,369.99 (Oct 13, 2025)
- All-Time Low: $0.0398177 (Oct 19, 2017)
Comparative Analysis
- Market Dominance: BNB (3.73%) vs TNK (0.00010%)
- Trading Volume: BNB's volume is significantly higher, indicating greater liquidity and market interest
- Price Stability: BNB shows more stability with its established market presence, while TNK exhibits high volatility typical of newer projects
IV. Community and Ecosystem Development
TNK (Trac Network)
- Social Media Presence: Twitter, Discord
- Development Activity: Limited public information available
BNB (Binance Coin)
- Social Media Presence: Twitter, Reddit, GitHub
- Development Activity: Active development with multiple GitHub repositories
- User Base: Supported in over 180 countries
Comparative Analysis
- Community Size: BNB has a significantly larger and more established community
- Ecosystem Development: BNB's ecosystem is more diverse and developed, including DeFi, NFTs, and various Binance Chain projects
- Global Reach: BNB has a wider global presence compared to TNK's more recent entry into the market
V. Investment Considerations and Risks
TNK (Trac Network)
- Potential: Innovative local-first approach could attract niche market interest
- Risks: High volatility, limited market presence, and competition from established Layer 1 protocols
BNB (Binance Coin)
- Potential: Established ecosystem, continued growth of Binance and its related services
- Risks: Regulatory challenges, competition from other major exchanges and blockchain platforms
General Market Risks
- Current extreme fear sentiment (Fear & Greed Index: 13) indicates a highly cautious market
- Regulatory uncertainties in the crypto space
- Potential for rapid market shifts due to global economic factors
VI. Conclusion
While BNB represents a well-established and widely adopted cryptocurrency with a robust ecosystem, TNK is a newcomer with an innovative approach to Layer 1 solutions. BNB offers stability and a proven track record, whereas TNK presents higher risk but potential for growth in its niche. Investors should consider their risk tolerance and conduct thorough research before making investment decisions in this volatile market environment.
II. Core Factors Affecting TRX vs BNB Investment Value
Supply Mechanism Comparison (Tokenomics)
- TRX: Originally had a maximum supply of 100 billion TRX; employs a deflationary model through token burns
- BNB: Fixed maximum supply of 165,116,760 BNB with regular burning mechanisms; follows a deflationary model
- 📌 Historical Pattern: Deflationary mechanisms for both tokens have historically supported price stability, with token burns reducing circulating supply over time.
Institutional Adoption and Market Applications
- Institutional Holdings: BNB appears to have stronger institutional interest due to Binance's dominant position in the exchange market
- Enterprise Adoption: BNB has wider application across Binance ecosystem services including exchange, launchpad, and payment solutions; TRX is focused on TRON network applications
- National Policies: Regulatory scrutiny varies, with Binance facing regulatory challenges in multiple jurisdictions while TRON has pursued more regulator-friendly strategies
Technical Development and Ecosystem Building
- TRX Technical Upgrades: TRON network has evolved to support smart contracts, DeFi applications, and stablecoin transactions with a focus on high throughput
- BNB Technical Development: BNB Chain has implemented multiple upgrades focusing on scalability and compatibility with Ethereum Virtual Machine
- Ecosystem Comparison: BNB has a more diverse ecosystem spanning DeFi, NFTs, gaming and payments; TRX has significant strength in stablecoin transactions, particularly USDT on TRON
Macroeconomic Factors and Market Cycles
- Performance During Inflation: Both tokens have shown mixed performance during inflationary periods
- Macro Monetary Policy: Interest rate changes affect both tokens similarly to the broader crypto market
- Geopolitical Factors: TRX has shown particular strength in regions with cross-border transaction needs and currency restrictions
III. 2025-2030 Price Prediction: TNK vs BNB
Short-term Prediction (2025)
- TNK: Conservative $0.133578 - $0.1629 | Optimistic $0.1629 - $0.190593
- BNB: Conservative $498.196 - $844.4 | Optimistic $844.4 - $987.948
Mid-term Prediction (2027)
- TNK may enter a growth phase, with an estimated price range of $0.173918556 - $0.24131199645
- BNB may enter a stable growth phase, with an estimated price range of $835.7797315 - $1333.491257
- Key drivers: Institutional capital inflow, ETF, ecosystem development
Long-term Prediction (2030)
- TNK: Base scenario $0.225188115007094 - $0.308476869872731 | Optimistic scenario $0.308476869872731 - $0.348578862956187
- BNB: Base scenario $985.05836342939025 - $1262.8953377299875 | Optimistic scenario $1262.8953377299875 - $1641.76393904898375
Disclaimer: The above predictions are based on historical data and market analysis. Cryptocurrency markets are highly volatile and subject to various factors. These forecasts should not be considered as financial advice. Always conduct your own research before making investment decisions.
TNK:
| 年份 | 预测最高价 | 预测平均价格 | 预测最低价 | 涨跌幅 |
|---|---|---|---|---|
| 2025 | 0.190593 | 0.1629 | 0.133578 | 0 |
| 2026 | 0.25804989 | 0.1767465 | 0.13079241 | 8 |
| 2027 | 0.24131199645 | 0.217398195 | 0.173918556 | 33 |
| 2028 | 0.31421648114325 | 0.229355095725 | 0.17660342370825 | 41 |
| 2029 | 0.345167951311338 | 0.271785788434125 | 0.2174286307473 | 67 |
| 2030 | 0.348578862956187 | 0.308476869872731 | 0.225188115007094 | 90 |
BNB:
| 年份 | 预测最高价 | 预测平均价格 | 预测最低价 | 涨跌幅 |
|---|---|---|---|---|
| 2025 | 987.948 | 844.4 | 498.196 | 0 |
| 2026 | 961.9827 | 916.174 | 613.83658 | 8 |
| 2027 | 1333.491257 | 939.07835 | 835.7797315 | 11 |
| 2028 | 1352.178916165 | 1136.2848035 | 874.939298695 | 34 |
| 2029 | 1281.558815627475 | 1244.2318598325 | 895.8469390794 | 47 |
| 2030 | 1641.76393904898375 | 1262.8953377299875 | 985.05836342939025 | 49 |
IV. Investment Strategy Comparison: TNK vs BNB
Long-term vs Short-term Investment Strategy
- TNK: Suitable for investors interested in innovative Layer 1 solutions and potential high growth
- BNB: Suitable for investors seeking ecosystem stability and established market presence
Risk Management and Asset Allocation
- Conservative investors: TNK: 10% vs BNB: 90%
- Aggressive investors: TNK: 30% vs BNB: 70%
- Hedging tools: Stablecoin allocation, options, cross-currency portfolios
V. Potential Risk Comparison
Market Risk
- TNK: High volatility, limited market history, potential for rapid price swings
- BNB: Exposure to overall crypto market trends, regulatory impacts on Binance
Technical Risk
- TNK: Scalability, network stability, and adoption challenges
- BNB: Centralization concerns, potential security vulnerabilities in the ecosystem
Regulatory Risk
- Global regulatory policies may have different impacts on both tokens, with BNB potentially facing more scrutiny due to Binance's prominence
VI. Conclusion: Which Is the Better Buy?
📌 Investment Value Summary:
- TNK advantages: Innovative local-first approach, potential for high growth in niche market
- BNB advantages: Established ecosystem, wide adoption, proven track record
✅ Investment Advice:
- Novice investors: Consider a small allocation to BNB as part of a diversified crypto portfolio
- Experienced investors: Explore a balanced approach with a majority in BNB and a smaller, speculative position in TNK
- Institutional investors: Focus on BNB for its liquidity and ecosystem strength, monitor TNK for potential future opportunities
⚠️ Risk Warning: The cryptocurrency market is highly volatile, and this article does not constitute investment advice. None
VII. FAQ
Q1: What are the key differences between TNK and BNB? A: TNK is a newer, local-first Layer 1 network, while BNB is an established cryptocurrency powering the Binance ecosystem. TNK focuses on peer-to-peer applications, while BNB has a wider range of uses across Binance's services.
Q2: Which token has shown better price performance historically? A: BNB has demonstrated more stable long-term growth since its inception in 2017, reaching an all-time high of $1,369.99 in October 2025. TNK, being newer, has shown extreme volatility in a short period, with its all-time high at $0.7 in November 2025.
Q3: How do the market caps of TNK and BNB compare? A: There's a significant difference in market capitalization. As of November 23, 2025, BNB's market cap was $116,194,627,428, while TNK's was $3,408,300, indicating BNB's much larger market presence.
Q4: What are the main risks associated with investing in TNK and BNB? A: TNK risks include high volatility, limited market presence, and competition from established protocols. BNB faces regulatory challenges and competition from other major exchanges. Both are subject to general crypto market risks and regulatory uncertainties.
Q5: How do the ecosystems of TNK and BNB differ? A: BNB has a more developed and diverse ecosystem, including DeFi, NFTs, and various Binance Chain projects. TNK's ecosystem is newer and focused on its local-first approach, with less established applications and services.
Q6: Which token might be more suitable for different types of investors? A: Conservative investors might prefer BNB for its stability and established market presence. Aggressive investors looking for potential high growth might consider allocating a portion to TNK. Institutional investors may focus more on BNB due to its liquidity and ecosystem strength.
Q7: What are the long-term price predictions for TNK and BNB? A: By 2030, TNK is predicted to reach between $0.225188115007094 and $0.348578862956187 in optimistic scenarios. BNB is forecasted to be between $985.05836342939025 and $1641.76393904898375 in the same timeframe. However, these predictions are subject to market volatility and should not be considered financial advice.
Share
Content
Introduction: TNK vs BNB Investment Comparison
I. Price History Comparison and Current Market Status
II. Project Overview and Technology Comparison
III. Market Performance and Financial Metrics
IV. Community and Ecosystem Development
V. Investment Considerations and Risks
VI. Conclusion
II. Core Factors Affecting TRX vs BNB Investment Value
III. 2025-2030 Price Prediction: TNK vs BNB
IV. Investment Strategy Comparison: TNK vs BNB
V. Potential Risk Comparison
VI. Conclusion: Which Is the Better Buy?
VII. FAQ

