STOS vs APT: Comparing Security Approaches in Modern Threat Landscapes
Introduction: STOS vs APT Investment Comparison
In the cryptocurrency market, the comparison between Stratos (STOS) and Aptos (APT) has been an unavoidable topic for investors. The two not only show significant differences in market cap ranking, application scenarios, and price performance, but also represent different crypto asset positioning.
Stratos (STOS): Since its launch, it has gained market recognition for its decentralized data infrastructure solution.
Aptos (APT): Introduced as a high-performance Layer 1 blockchain, it has been focusing on delivering a secure and scalable blockchain solution.
This article will comprehensively analyze the investment value comparison between STOS and APT, focusing on historical price trends, supply mechanisms, institutional adoption, technological ecosystems, and future predictions, attempting to answer the question investors care about most:
"Which is the better buy right now?"
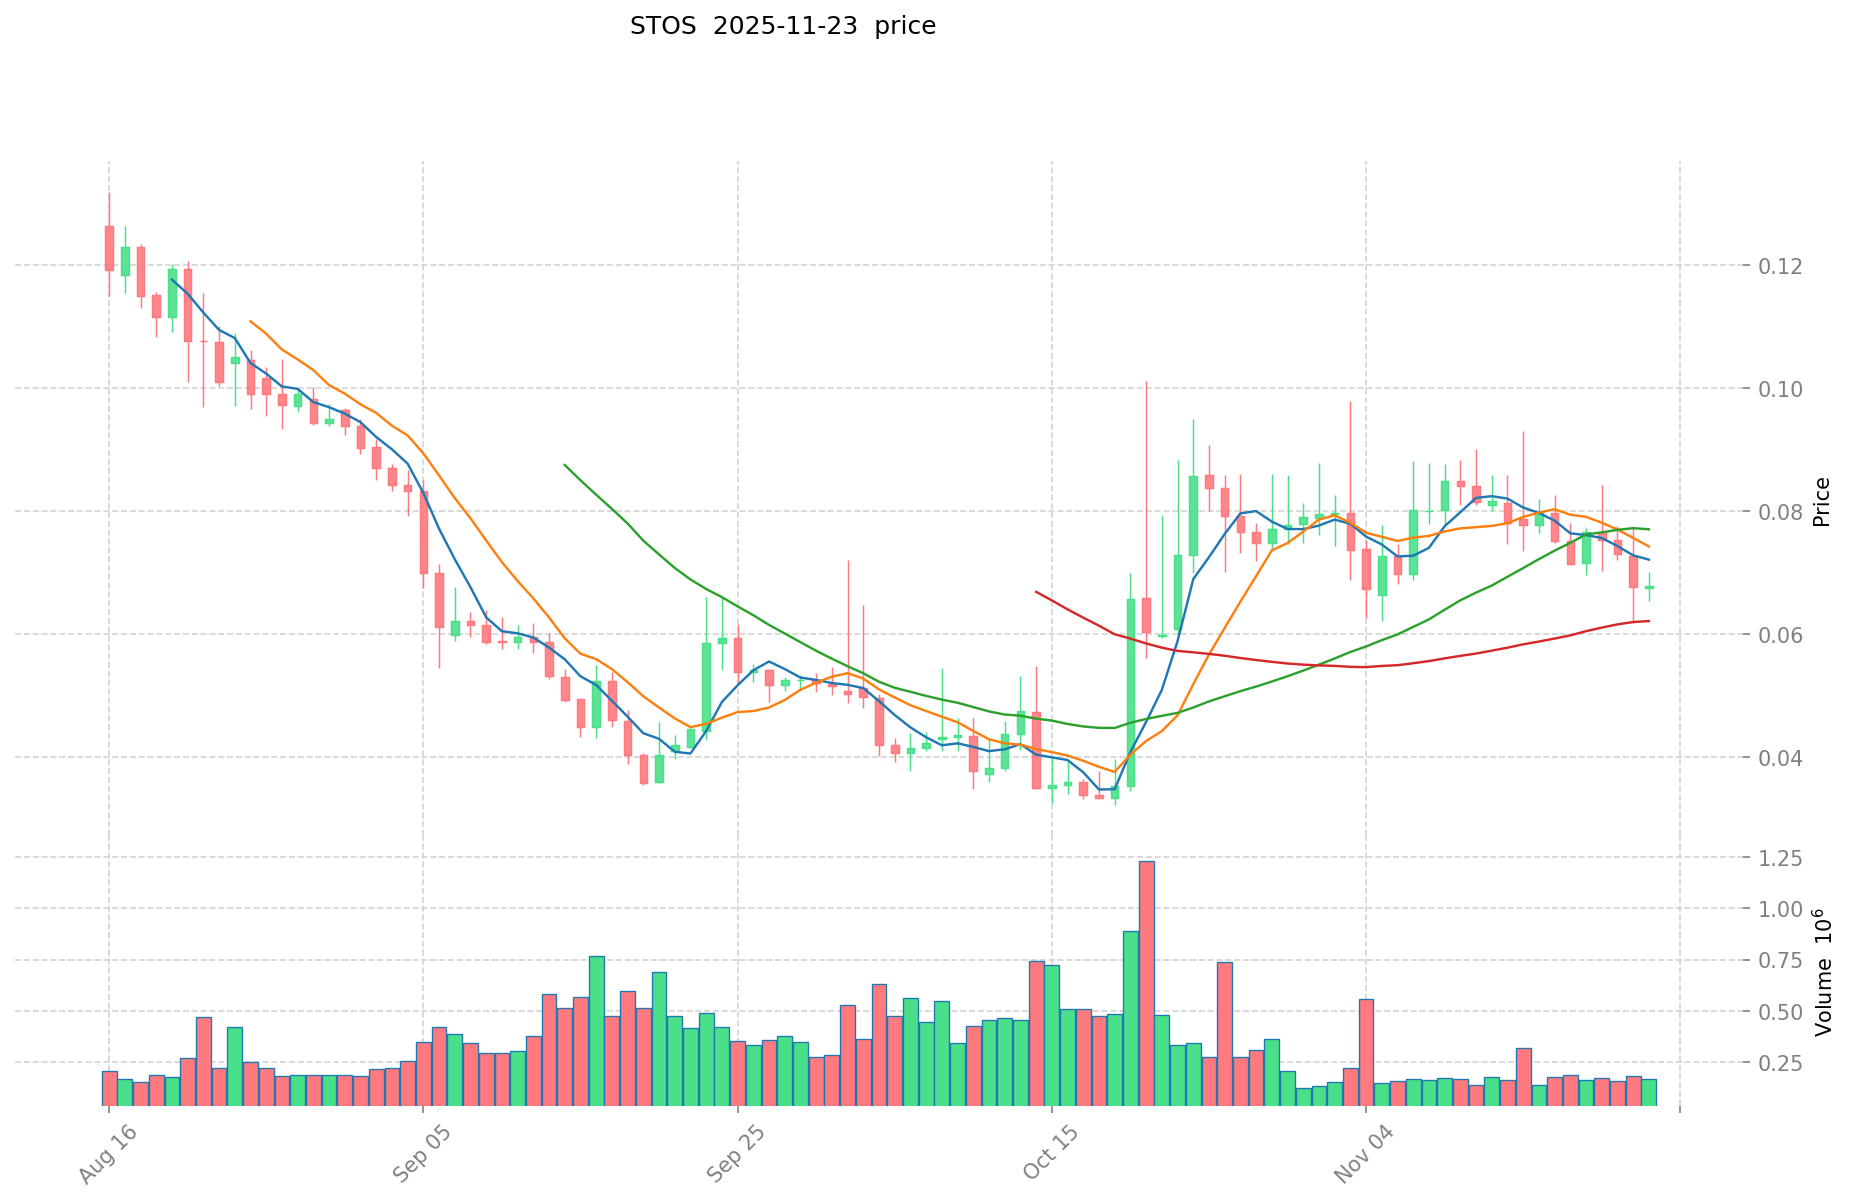
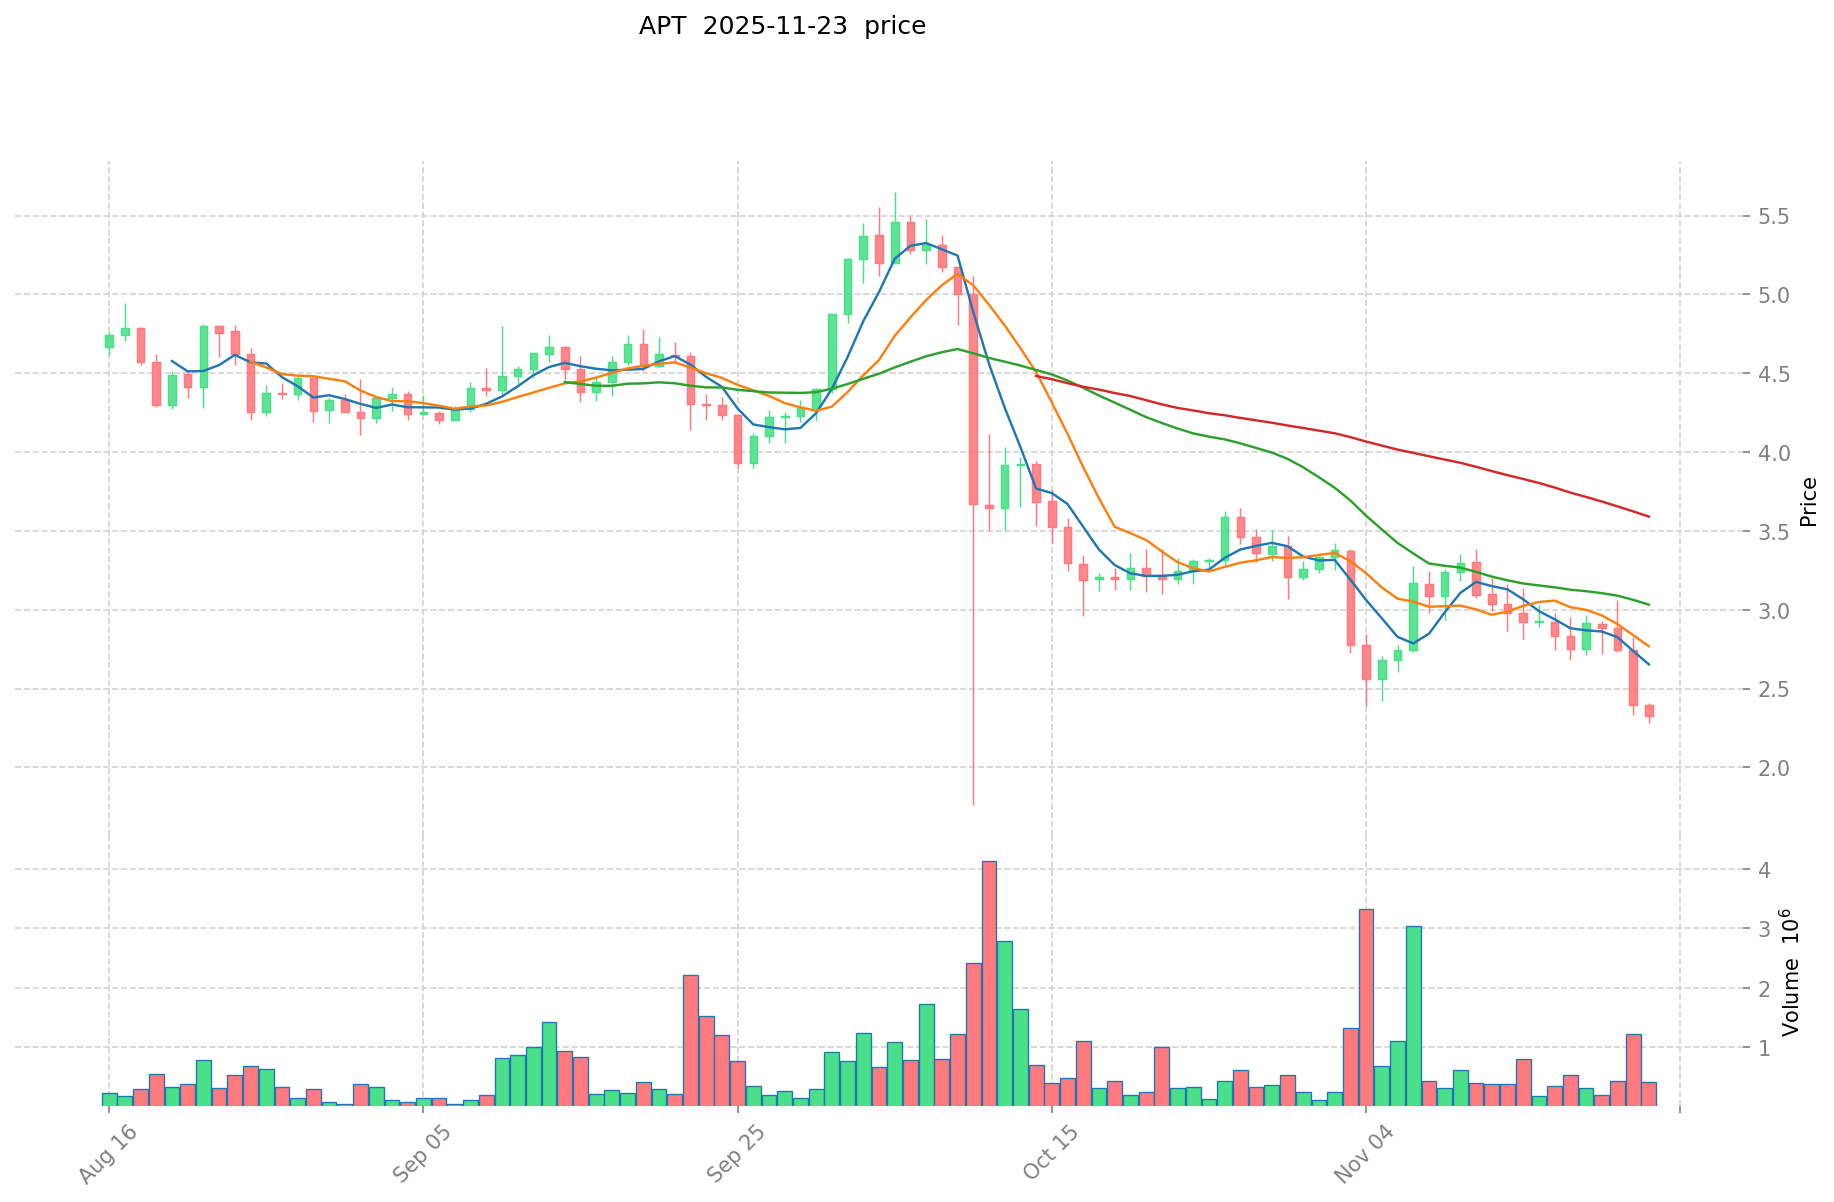
I. Price History Comparison and Current Market Status
STOS and APT Historical Price Trends
- 2021: STOS reached its all-time high of $5.18 on November 26, 2021.
- 2023: APT hit its all-time high of $19.92 on January 26, 2023.
- Comparative analysis: STOS has fallen from its peak of $5.18 to a current price of $0.07033, while APT has declined from $19.92 to $2.351.
Current Market Situation (2025-11-23)
- STOS current price: $0.07033
- APT current price: $2.351
- 24-hour trading volume: STOS $11,042.71 vs APT $686,318.89
- Market Sentiment Index (Fear & Greed Index): 13 (Extreme Fear)
Click to view real-time prices:
- View STOS current price Market Price
- View APT current price Market Price
II. Core Factors Affecting Investment Value of STOS vs APT
Supply Mechanism Comparison (Tokenomics)
-
STOS: The token uses a deflationary mechanism with Stratis' Proof-of-Stake consensus model, where validator rewards decrease over time to control inflation
-
APT: Aptos has a predetermined inflation schedule, starting at around 7% annually and decreasing over time, with 51% of total tokens allocated to the community
-
📌 Historical pattern: Deflationary tokens like STOS tend to perform better in bull markets due to scarcity, while APT's controlled inflation model provides steady rewards to validators while maintaining long-term value.
Institutional Adoption and Market Applications
- Institutional holdings: APT has gained more institutional attention, with backing from major VCs including a16z, FTX Ventures, and Tiger Global
- Enterprise adoption: STOS offers enterprise-ready blockchain solutions specifically targeting financial services and .NET ecosystem, while APT focuses on high-performance applications across various sectors
- Regulatory stance: Both projects maintain regulatory compliance, though APT benefits from stronger institutional backing and relationships
Technical Development and Ecosystem Building
- STOS technical upgrades: Stratis Blockchain Platform offers extensive C# support, Smart Contracts, and sidechains tailored for enterprise applications
- APT technical development: Aptos utilizes the Move programming language and parallel execution engine with high throughput (over 130,000 TPS) and low latency
- Ecosystem comparison: APT has a more diverse DeFi and NFT ecosystem with rapid growth due to substantial funding and developer incentives, while STOS focuses on enterprise blockchain solutions and Microsoft .NET integration
Macroeconomic Factors and Market Cycles
- Performance in inflationary environments: Both tokens have limited historical data during inflation, though APT's robust funding may provide more stability
- Macroeconomic monetary policy: Interest rates and USD index affect both tokens similarly to the broader crypto market
- Geopolitical factors: STOS enterprise focus may provide stability during geopolitical uncertainty, while APT's high performance could make it attractive for cross-border applications requiring speed and efficiency
III. 2025-2030 Price Prediction: STOS vs APT
Short-term Prediction (2025)
- STOS: Conservative $0.0557 - $0.0706 | Optimistic $0.0706 - $0.0847
- APT: Conservative $1.3895 - $2.3550 | Optimistic $2.3550 - $3.4148
Mid-term Prediction (2027)
- STOS may enter a growth phase, with estimated prices $0.0871 - $0.1193
- APT may enter a consolidation phase, with estimated prices $2.3800 - $3.4272
- Key drivers: Institutional capital inflow, ETF, ecosystem development
Long-term Prediction (2030)
- STOS: Base scenario $0.1162 - $0.1277 | Optimistic scenario $0.1277 - $0.1775
- APT: Base scenario $3.0006 - $4.4785 | Optimistic scenario $4.4785 - $5.2846
Disclaimer: The above predictions are based on historical data and market analysis. Cryptocurrency markets are highly volatile and subject to rapid changes. This information should not be considered as financial advice. Always conduct your own research before making investment decisions.
STOS:
| 年份 | 预测最高价 | 预测平均价格 | 预测最低价 | 涨跌幅 |
|---|---|---|---|---|
| 2025 | 0.084672 | 0.07056 | 0.0557424 | 0 |
| 2026 | 0.11176704 | 0.077616 | 0.05588352 | 10 |
| 2027 | 0.1193113152 | 0.09469152 | 0.0871161984 | 34 |
| 2028 | 0.111281474304 | 0.1070014176 | 0.070620935616 | 51 |
| 2029 | 0.14624953757568 | 0.109141445952 | 0.05566213743552 | 54 |
| 2030 | 0.177496733551737 | 0.12769549176384 | 0.116202897505094 | 80 |
APT:
| 年份 | 预测最高价 | 预测平均价格 | 预测最低价 | 涨跌幅 |
|---|---|---|---|---|
| 2025 | 3.41475 | 2.355 | 1.38945 | 0 |
| 2026 | 3.46185 | 2.884875 | 2.04826125 | 22 |
| 2027 | 3.4272315 | 3.1733625 | 2.380021875 | 34 |
| 2028 | 4.2903861 | 3.300297 | 1.78216038 | 40 |
| 2029 | 5.161664508 | 3.79534155 | 3.3019471485 | 61 |
| 2030 | 5.28463357422 | 4.478503029 | 3.00059702943 | 90 |
IV. Investment Strategy Comparison: STOS vs APT
Long-term vs Short-term Investment Strategies
- STOS: Suitable for investors focusing on enterprise blockchain solutions and .NET ecosystem potential
- APT: Suitable for investors seeking high-performance blockchain applications and diverse DeFi/NFT ecosystems
Risk Management and Asset Allocation
- Conservative investors: STOS: 30% vs APT: 70%
- Aggressive investors: STOS: 60% vs APT: 40%
- Hedging tools: Stablecoin allocation, options, cross-currency portfolios
V. Potential Risk Comparison
Market Risks
- STOS: Limited market visibility and lower trading volume
- APT: Higher volatility due to increased institutional interest
Technical Risks
- STOS: Scalability, network stability
- APT: Potential security vulnerabilities in the Move language, network congestion during high demand
Regulatory Risks
- Global regulatory policies may impact both differently, with APT potentially facing more scrutiny due to its higher profile and institutional backing
VI. Conclusion: Which Is the Better Buy?
📌 Investment Value Summary:
- STOS advantages: Enterprise-focused blockchain solutions, Microsoft .NET integration, deflationary mechanism
- APT advantages: High-performance blockchain, strong institutional backing, diverse ecosystem
✅ Investment Advice:
- Novice investors: Consider a balanced approach, leaning towards APT for its higher liquidity and market visibility
- Experienced investors: Explore STOS for its potential in enterprise blockchain solutions while maintaining a position in APT
- Institutional investors: Evaluate APT for its high-performance capabilities and STOS for potential enterprise partnerships
⚠️ Risk Warning: Cryptocurrency markets are highly volatile, and this article does not constitute investment advice. None
VII. FAQ
Q1: What are the main differences between STOS and APT? A: STOS focuses on decentralized data infrastructure and enterprise blockchain solutions, particularly for the .NET ecosystem. APT is a high-performance Layer 1 blockchain designed for scalability and security across various applications.
Q2: Which token has performed better historically? A: APT reached its all-time high more recently (January 2023) at $19.92, while STOS hit its peak earlier (November 2021) at $5.18. Both have since declined, with APT currently trading higher at $2.351 compared to STOS at $0.07033.
Q3: How do their supply mechanisms differ? A: STOS uses a deflationary mechanism with decreasing validator rewards over time. APT has a predetermined inflation schedule starting at around 7% annually and decreasing over time, with 51% of tokens allocated to the community.
Q4: Which project has more institutional adoption? A: APT has gained more institutional attention, with backing from major venture capital firms like a16z, FTX Ventures, and Tiger Global. STOS focuses more on enterprise-ready blockchain solutions for financial services and the .NET ecosystem.
Q5: What are the key technical features of each project? A: STOS offers extensive C# support, Smart Contracts, and sidechains tailored for enterprise applications. APT utilizes the Move programming language and a parallel execution engine, claiming high throughput (over 130,000 TPS) and low latency.
Q6: How do their ecosystems compare? A: APT has a more diverse DeFi and NFT ecosystem with rapid growth due to substantial funding and developer incentives. STOS focuses on enterprise blockchain solutions and Microsoft .NET integration.
Q7: What are the long-term price predictions for STOS and APT? A: By 2030, STOS is predicted to reach $0.1162 - $0.1775 in an optimistic scenario, while APT is expected to reach $3.0006 - $5.2846 in an optimistic scenario. However, these predictions are subject to market volatility and should not be considered financial advice.
Q8: Which token might be better for different types of investors? A: Novice investors might consider a balanced approach leaning towards APT for its higher liquidity and market visibility. Experienced investors could explore STOS for its potential in enterprise blockchain solutions while maintaining a position in APT. Institutional investors may evaluate APT for its high-performance capabilities and STOS for potential enterprise partnerships.
Share
Content
Introduction: STOS vs APT Investment Comparison
I. Price History Comparison and Current Market Status
II. Core Factors Affecting Investment Value of STOS vs APT
III. 2025-2030 Price Prediction: STOS vs APT
IV. Investment Strategy Comparison: STOS vs APT
V. Potential Risk Comparison
VI. Conclusion: Which Is the Better Buy?
VII. FAQ

