SLAY vs APT: The Battle of Cyber Titans in the Digital Realm
Introduction: Investment Comparison of SLAY vs APT
In the cryptocurrency market, the comparison between SatLayer (SLAY) vs Aptos (APT) has been an unavoidable topic for investors. The two not only show significant differences in market cap ranking, application scenarios, and price performance, but also represent different positioning in crypto assets.
SatLayer (SLAY): Since its launch, it has gained market recognition for its role as the economic layer for Bitcoin, making BTC a programmable asset for various applications.
Aptos (APT): Introduced as a high-performance PoS Layer 1 project, it aims to deliver a secure and scalable blockchain solution.
This article will provide a comprehensive analysis of the investment value comparison between SLAY and APT, focusing on historical price trends, supply mechanisms, institutional adoption, technological ecosystems, and future predictions, attempting to answer the question investors care about most:
"Which is the better buy right now?"
I. Price History Comparison and Current Market Status
SatLayer (SLAY) and Aptos (APT) Historical Price Trends
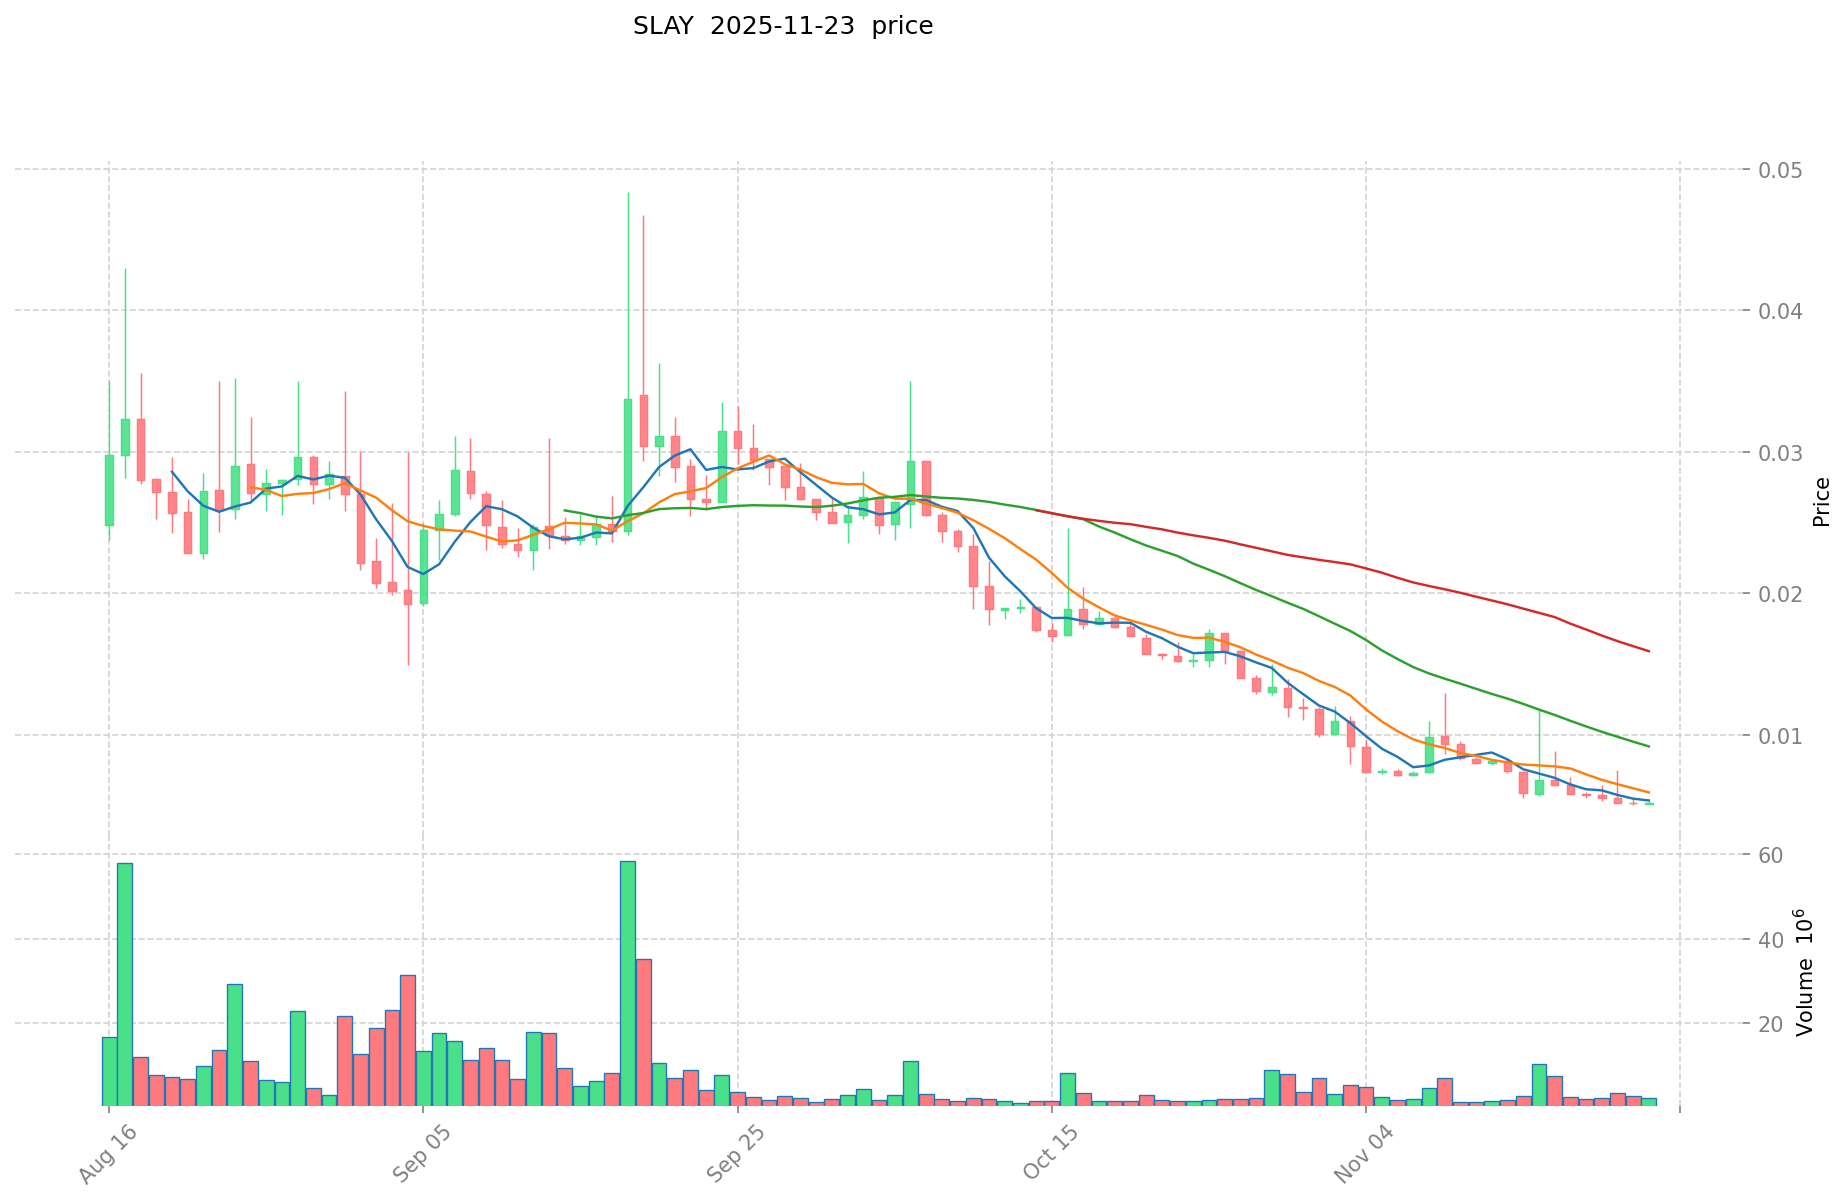
- 2025: SLAY experienced a significant price drop, reaching its all-time low of $0.005 on November 21, 2025.
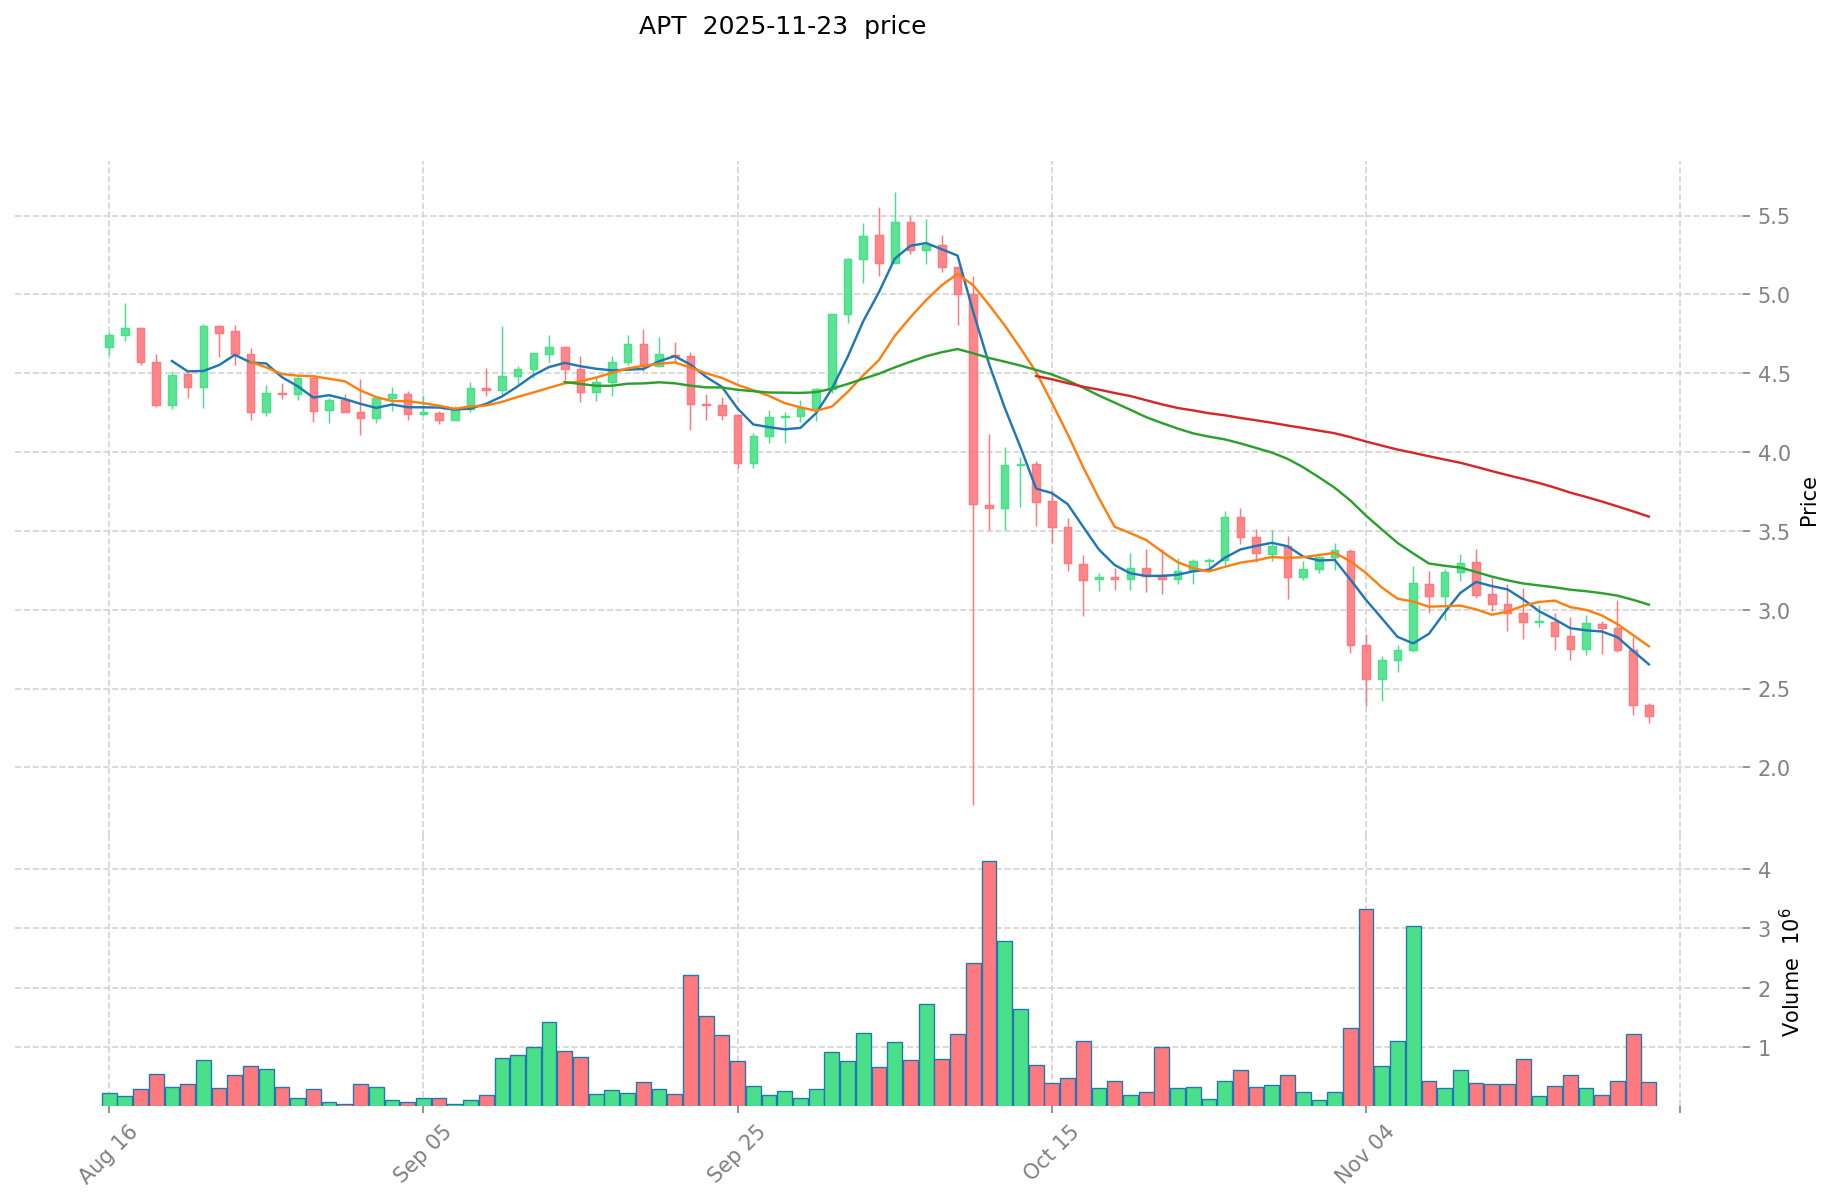
- 2025: APT also faced a downward trend, hitting its all-time low of $2.29 on November 22, 2025.
- Comparative analysis: In the recent market cycle, SLAY dropped from its all-time high of $0.13933 on August 11, 2025, to its current price, while APT declined from its all-time high of $19.92 on January 26, 2023, to its current level.
Current Market Situation (2025-11-24)
- SLAY current price: $0.00538
- APT current price: $2.37
- 24-hour trading volume: SLAY $14,820.68 vs APT $634,367.40
- Market Sentiment Index (Fear & Greed Index): 13 (Extreme Fear)
Click to view real-time prices:
- Check SLAY current price Market Price
- Check APT current price Market Price
II. Core Factors Affecting SLAY vs APT Investment Value
Supply Mechanism Comparison (Tokenomics)
-
SLAY: Fixed maximum supply of 10 billion tokens with 55% allocated to the ecosystem, 15% to investors, 15% to the team, 10% to the foundation, and 5% to advisors
-
APT: Total supply of 1 billion tokens with 51.02% allocated to the community, 19% to core contributors, 16.5% to the foundation, and 13.48% to investors
-
📌 Historical Pattern: Tokens with fixed supply caps like SLAY tend to create scarcity value over time, while APT's distribution model focuses on community governance and ecosystem development.
Institutional Adoption and Market Applications
- Institutional Holdings: APT has gained more institutional attention with backing from a16z, Multicoin Capital, and other major VCs, while SLAY is still building institutional interest
- Enterprise Adoption: APT benefits from Aptos Labs' partnerships with Google Cloud and other tech enterprises, while SLAY is currently focused on gaming and entertainment applications
- Regulatory Attitudes: Both tokens operate in regulatory gray areas across jurisdictions, with neither having achieved widespread regulatory clarity globally
Technical Development and Ecosystem Building
- SLAY Technical Development: Built on an EVM-compatible Layer 2 solution focused on gaming and entertainment, with architecture designed for high throughput and low gas fees
- APT Technical Development: Features the Move programming language and parallel execution with block-STM technology, enabling high TPS (>100,000 transactions per second) and enhanced security
- Ecosystem Comparison: APT has a more diversified ecosystem spanning DeFi, NFTs, and gaming with over 300 projects, while SLAY is concentrated in gaming with some emerging DeFi applications
Macroeconomic Factors and Market Cycles
- Inflation Performance: Neither token has established a strong track record as inflation hedges, with both being subject to broader crypto market volatility
- Monetary Policy Impact: Both tokens show high correlation with tech stocks and risk assets, making them sensitive to Federal Reserve policies and interest rate changes
- Geopolitical Factors: APT's global development approach gives it broader exposure across various markets, while SLAY's gaming focus may provide some insulation from certain geopolitical tensions
III. 2025-2030 Price Prediction: SLAY vs APT
Short-term Prediction (2025)
- SLAY: Conservative $0.00464-$0.00533 | Optimistic $0.00533-$0.00714
- APT: Conservative $1.72-$2.36 | Optimistic $2.36-$2.48
Mid-term Prediction (2027)
- SLAY may enter a growth phase, with prices estimated at $0.00675-$0.01071
- APT may enter a consolidation phase, with prices estimated at $2.69-$3.58
- Key drivers: Institutional inflows, ETFs, ecosystem development
Long-term Prediction (2030)
- SLAY: Base scenario $0.00912-$0.01125 | Optimistic scenario $0.01125-$0.01249
- APT: Base scenario $3.86-$4.49 | Optimistic scenario $4.49-$6.24
Disclaimer: This analysis is for informational purposes only and should not be considered as financial advice. Cryptocurrency markets are highly volatile and unpredictable. Always conduct your own research before making any investment decisions.
SLAY:
| 年份 | 预测最高价 | 预测平均价格 | 预测最低价 | 涨跌幅 |
|---|---|---|---|---|
| 2025 | 0.0071422 | 0.00533 | 0.0046371 | 0 |
| 2026 | 0.009291789 | 0.0062361 | 0.00374166 | 15 |
| 2027 | 0.01071424341 | 0.0077639445 | 0.006754631715 | 44 |
| 2028 | 0.00951626677365 | 0.009239093955 | 0.007391275164 | 71 |
| 2029 | 0.013128752510055 | 0.009377680364325 | 0.005157724200378 | 74 |
| 2030 | 0.01249107024528 | 0.01125321643719 | 0.009115105314123 | 109 |
APT:
| 年份 | 预测最高价 | 预测平均价格 | 预测最低价 | 涨跌幅 |
|---|---|---|---|---|
| 2025 | 2.48115 | 2.363 | 1.72499 | 0 |
| 2026 | 3.487788 | 2.422075 | 1.67123175 | 1 |
| 2027 | 3.575467115 | 2.9549315 | 2.688987665 | 24 |
| 2028 | 4.277411092825 | 3.2651993075 | 1.6979036399 | 37 |
| 2029 | 5.20440117622425 | 3.7713052001625 | 2.225070068095875 | 58 |
| 2030 | 6.238115931588791 | 4.487853188193375 | 3.859553741846302 | 88 |
IV. Investment Strategy Comparison: SLAY vs APT
Long-term vs Short-term Investment Strategies
- SLAY: Suitable for investors focused on gaming and entertainment ecosystems, Layer 2 solutions
- APT: Suitable for investors interested in high-performance Layer 1 platforms, diverse DeFi applications
Risk Management and Asset Allocation
- Conservative investors: SLAY: 30% vs APT: 70%
- Aggressive investors: SLAY: 60% vs APT: 40%
- Hedging tools: Stablecoin allocation, options, cross-currency portfolios
V. Potential Risk Comparison
Market Risks
- SLAY: Higher volatility due to smaller market cap, concentrated in gaming sector
- APT: Exposure to broader crypto market trends, competition from other Layer 1 platforms
Technical Risks
- SLAY: Scalability, network stability
- APT: Centralization concerns, potential security vulnerabilities in Move language
Regulatory Risks
- Global regulatory policies may impact both tokens differently, with APT potentially facing more scrutiny as a Layer 1 platform
VI. Conclusion: Which Is the Better Buy?
📌 Investment Value Summary:
- SLAY advantages: Fixed supply cap, focus on Bitcoin ecosystem, gaming industry potential
- APT advantages: High-performance technology, diverse ecosystem, strong institutional backing
✅ Investment Recommendations:
- New investors: Consider a balanced approach with a slight preference for APT due to its more established ecosystem
- Experienced investors: Explore SLAY for potential higher growth, while maintaining APT for stability
- Institutional investors: Evaluate APT for its technological advancements and broader application scope
⚠️ Risk Warning: Cryptocurrency markets are highly volatile, and this article does not constitute investment advice. None
VII. FAQ
Q1: What are the main differences between SLAY and APT? A: SLAY is an economic layer for Bitcoin focused on gaming and entertainment, while APT is a high-performance Layer 1 blockchain with a diverse ecosystem spanning DeFi, NFTs, and gaming. SLAY has a fixed supply cap of 10 billion tokens, whereas APT has a total supply of 1 billion tokens with a different allocation structure.
Q2: Which token has shown better price performance recently? A: As of November 24, 2025, both tokens have experienced significant price drops. SLAY reached its all-time low of $0.005 on November 21, 2025, while APT hit its all-time low of $2.29 on November 22, 2025. Currently, SLAY is trading at $0.00538 and APT at $2.37.
Q3: How do the long-term price predictions for SLAY and APT compare? A: For 2030, SLAY's base scenario predicts a range of $0.00912-$0.01125, with an optimistic scenario of $0.01125-$0.01249. APT's base scenario for 2030 is $3.86-$4.49, with an optimistic scenario of $4.49-$6.24.
Q4: What are the key factors affecting the investment value of SLAY and APT? A: Key factors include supply mechanisms, institutional adoption, technical development, ecosystem building, and macroeconomic factors. APT has more institutional backing and a more diverse ecosystem, while SLAY benefits from its fixed supply cap and focus on the gaming sector.
Q5: How should investors approach risk management when investing in SLAY and APT? A: Conservative investors might consider allocating 30% to SLAY and 70% to APT, while aggressive investors could opt for 60% SLAY and 40% APT. It's recommended to use hedging tools such as stablecoin allocation, options, and cross-currency portfolios to manage risk.
Q6: What are the potential risks associated with investing in SLAY and APT? A: Both tokens face market risks, technical risks, and regulatory risks. SLAY may experience higher volatility due to its smaller market cap and concentration in the gaming sector. APT faces competition from other Layer 1 platforms and potential centralization concerns.
Q7: Which token might be more suitable for different types of investors? A: New investors might prefer a balanced approach with a slight preference for APT due to its more established ecosystem. Experienced investors could explore SLAY for potential higher growth while maintaining APT for stability. Institutional investors may find APT more attractive due to its technological advancements and broader application scope.
Share
Content
Introduction: Investment Comparison of SLAY vs APT
I. Price History Comparison and Current Market Status
II. Core Factors Affecting SLAY vs APT Investment Value
III. 2025-2030 Price Prediction: SLAY vs APT
IV. Investment Strategy Comparison: SLAY vs APT
V. Potential Risk Comparison
VI. Conclusion: Which Is the Better Buy?
VII. FAQ

