RWA vs ETC: Comparing Real-World Assets and Emerging Technology Cryptocurrencies in the Digital Economy
Introduction: Investment Comparison of RWA vs ETC
In the cryptocurrency market, the comparison between Allo (RWA) vs Ethereum Classic (ETC) has always been a topic that investors cannot ignore. The two not only have significant differences in market cap ranking, application scenarios, and price performance, but also represent different positioning in crypto assets.
Allo (RWA): Since its launch in 2025, it has gained market recognition for its focus on tokenized stocks and real-world assets (RWAs).
Ethereum Classic (ETC): Since its inception in 2016, it has been hailed as a continuation of the original Ethereum blockchain, adhering to the "code is law" principle.
This article will comprehensively analyze the investment value comparison between RWA and ETC, focusing on historical price trends, supply mechanisms, institutional adoption, technological ecosystems, and future predictions, and attempt to answer the question investors care about most:
"Which is the better buy right now?"
I. Price History Comparison and Current Market Status
RWA (Coin A) and ETC (Coin B) Historical Price Trends
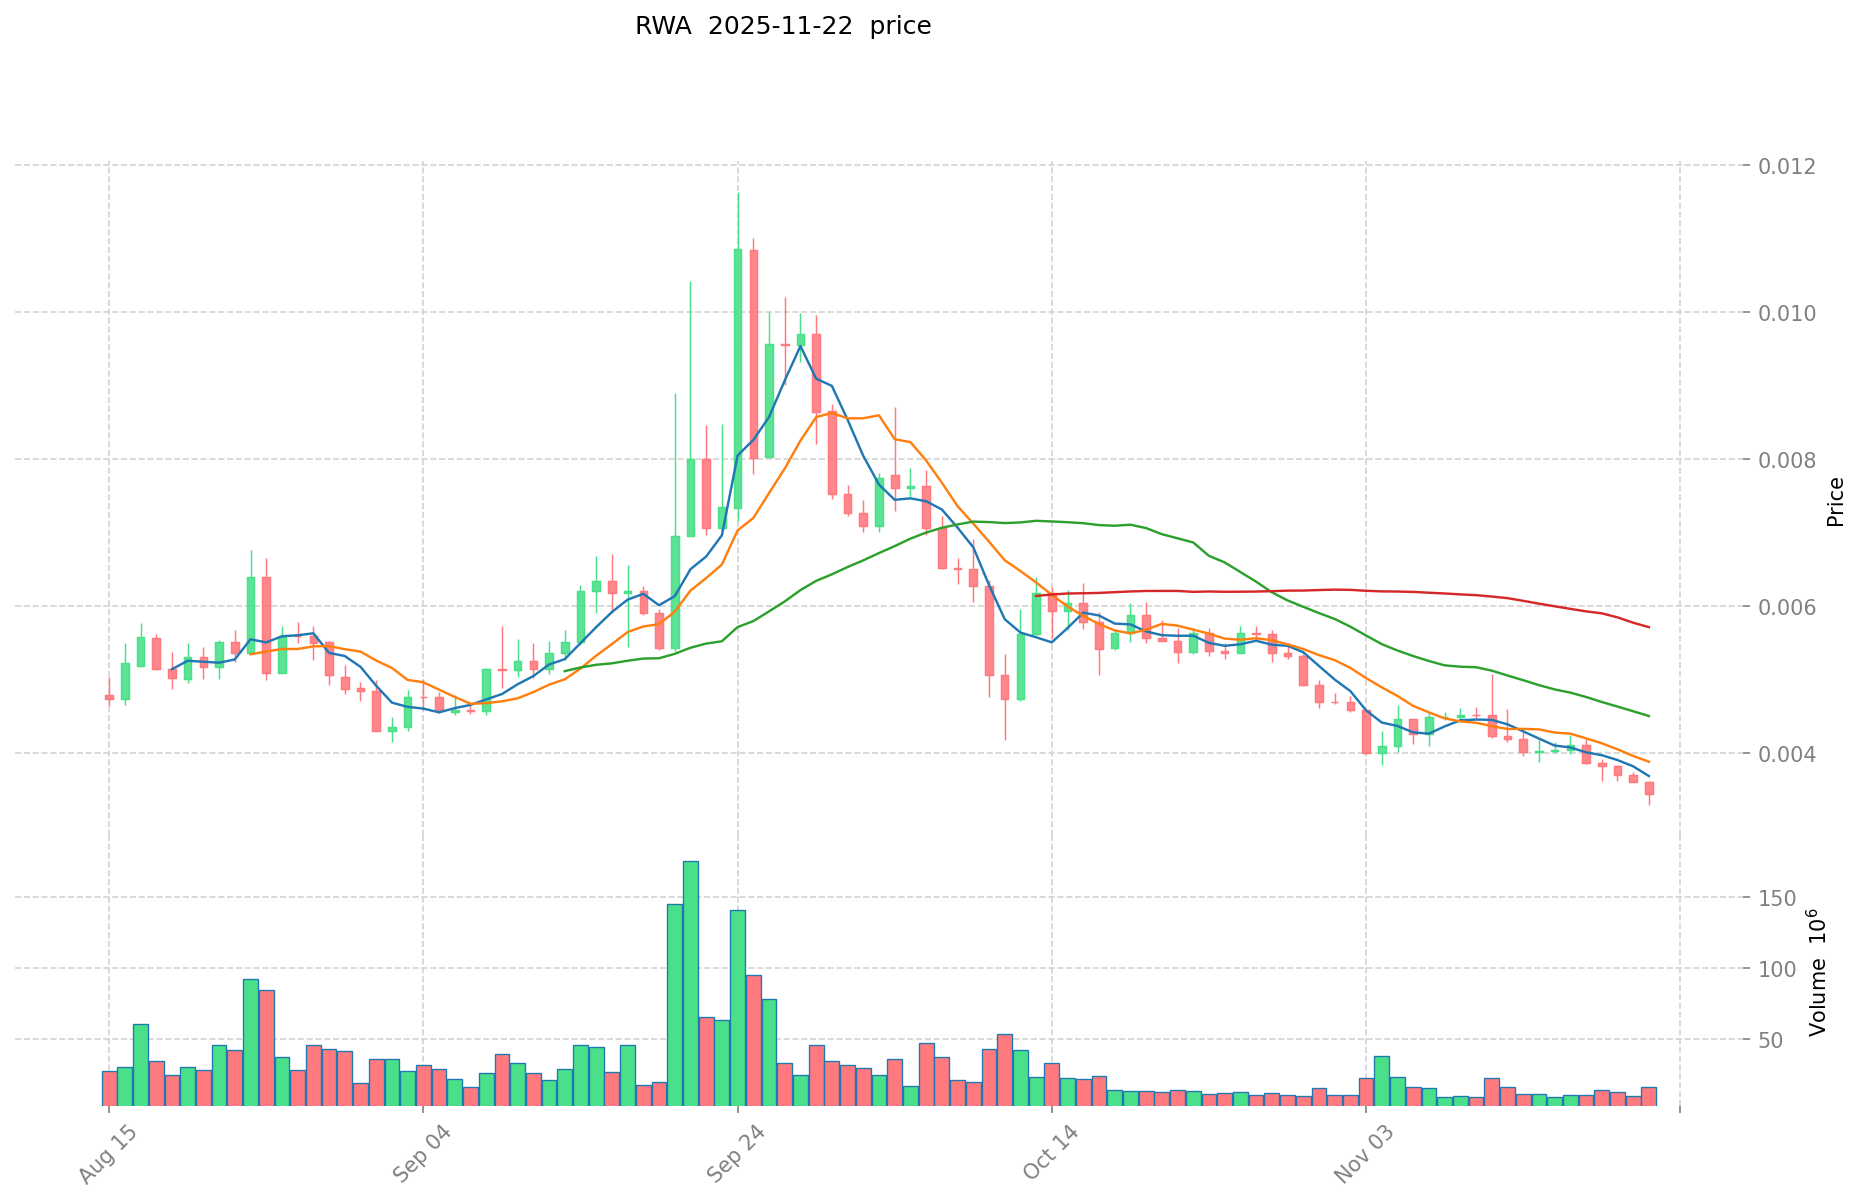
- 2025: RWA reached its all-time high of $0.01829 on May 24, 2025, and its all-time low of $0.003063 on July 25, 2025.
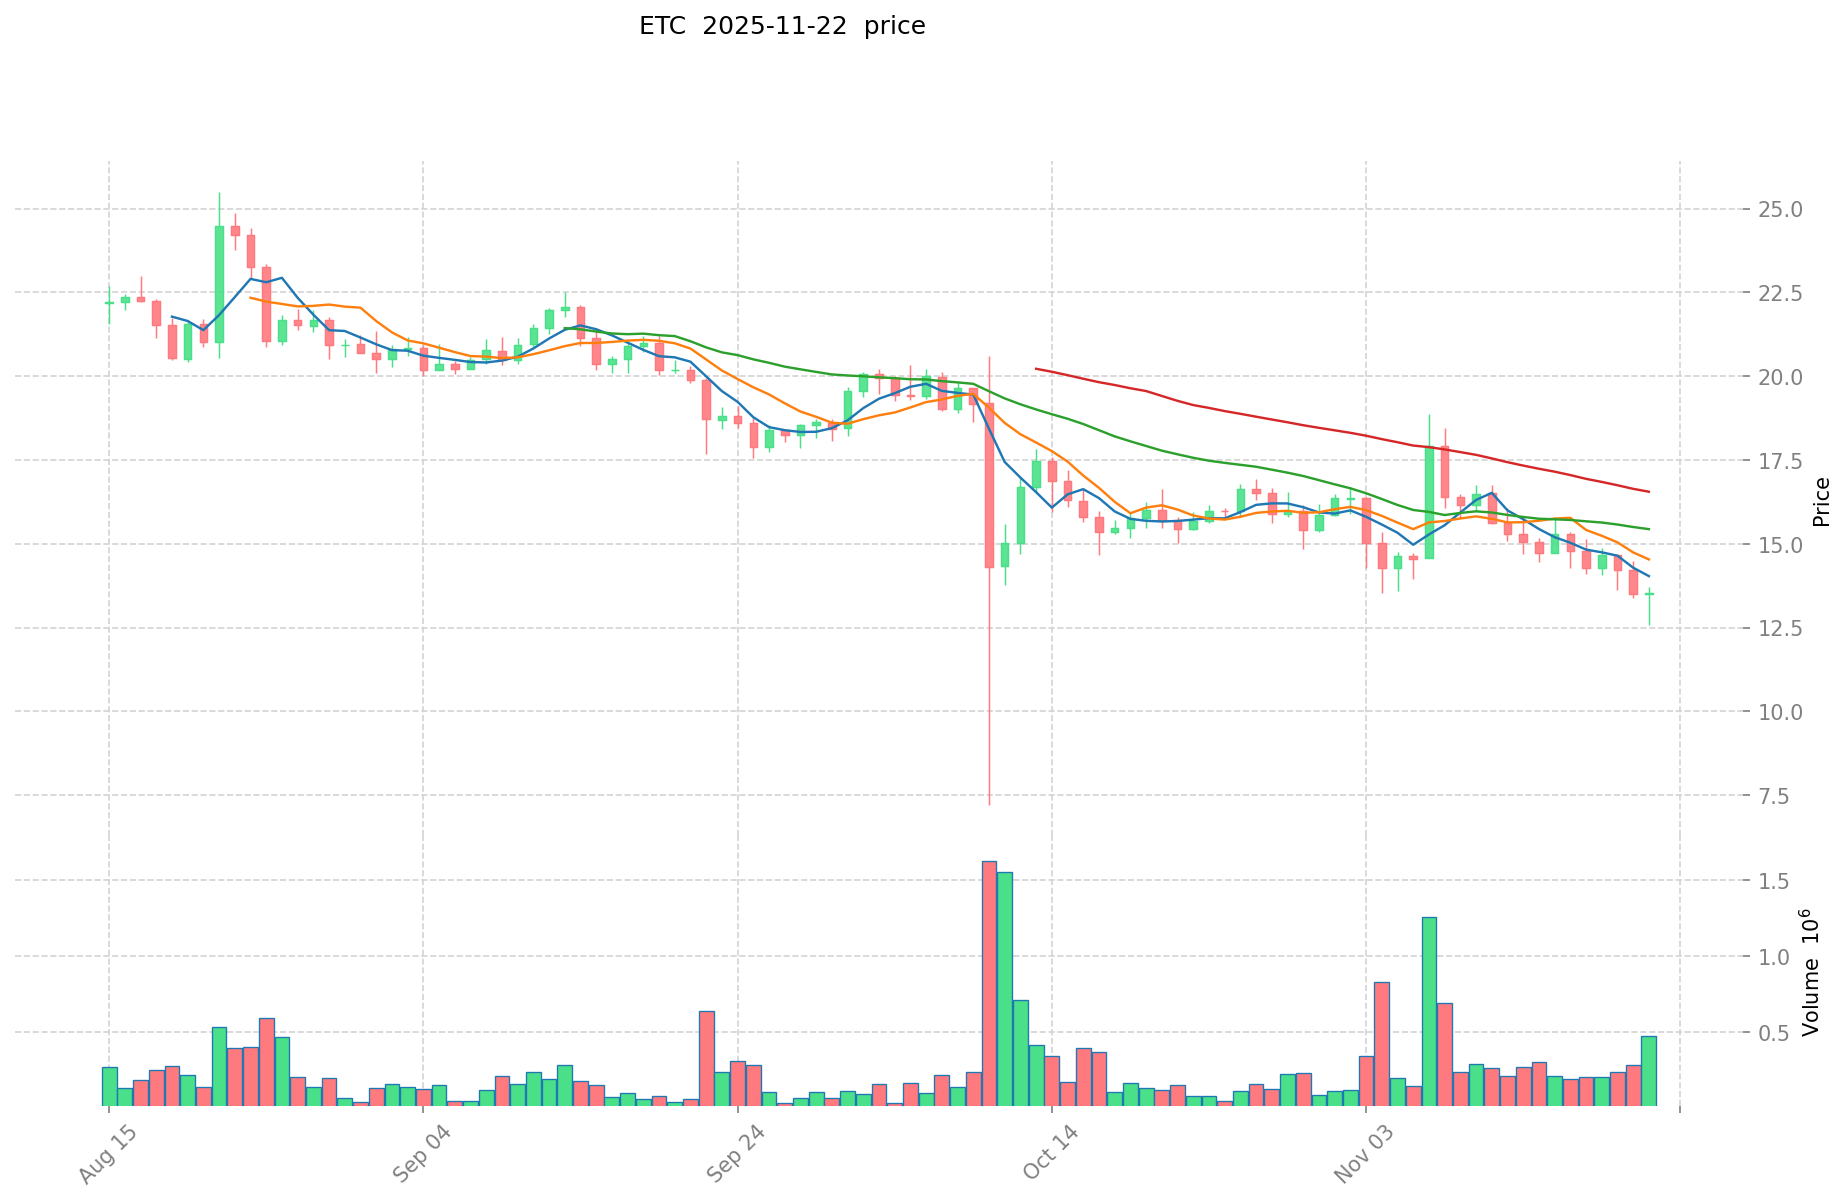
- 2021: ETC reached its all-time high of $167.09 on May 7, 2021, while its all-time low was $0.615038 on July 25, 2016.
- Comparative analysis: In recent market cycles, RWA has experienced significant volatility within a short period in 2025, while ETC has shown a longer-term price history with more dramatic price swings over the years.
Current Market Situation (2025-11-22)
- RWA current price: $0.00349
- ETC current price: $13.654
- 24-hour trading volume: RWA $38,986.99 vs ETC $6,124,209.56
- Market Sentiment Index (Fear & Greed Index): 11 (Extreme Fear)
Click to view real-time prices:
- Check RWA current price Market Price
- Check ETC current price Market Price
II. Key Factors Affecting RWA vs ETC Investment Value
Supply Mechanism Comparison (Tokenomics)
- RWA: Tokenomics dependent on the underlying real-world asset and specific token structure
- ETC: Fixed supply cap of 210.7 million coins with declining inflation rate, similar to Bitcoin's model
- 📌 Historical pattern: ETC's capped supply model creates scarcity potential during market uptrends, while RWAs typically maintain value stability linked to underlying assets.
Institutional Adoption and Market Applications
- Institutional holdings: RWAs gaining more institutional interest due to regulatory clarity and familiar asset structures
- Enterprise adoption: RWAs are increasingly used in settlement systems and investment portfolios, while ETC maintains niche applications in the cryptocurrency ecosystem
- National policies: RWAs generally face clearer regulatory frameworks across jurisdictions, while ETC faces varying treatments as a cryptocurrency
Technology Development and Ecosystem Building
- RWA technology upgrades: Integration with traditional finance infrastructure, improved compliance tools, and enhanced legal frameworks
- ETC technology development: Maintaining Proof-of-Work consensus and original Ethereum vision
- Ecosystem comparison: RWAs are expanding across traditional finance applications, while ETC has limited DeFi and NFT activity compared to Ethereum
Macroeconomic Environment and Market Cycles
- Performance in inflationary environments: RWAs vary based on underlying assets (real estate and commodities often perform well), while ETC has theoretical inflation hedge properties but high correlation to broader crypto market
- Macroeconomic monetary policy: Interest rates directly impact RWA valuations, while ETC often moves with broader cryptocurrency sentiment
- Geopolitical factors: RWAs may face jurisdictional restrictions, while ETC offers borderless transactions but with regulatory uncertainty
III. 2025-2030 Price Prediction: RWA vs ETC
Short-term Prediction (2025)
- RWA: Conservative $0.00317499 - $0.003489 | Optimistic $0.003489 - $0.00467526
- ETC: Conservative $10.95039 - $13.519 | Optimistic $13.519 - $17.03394
Mid-term Prediction (2027)
- RWA may enter a growth phase, with prices estimated between $0.003071394612 and $0.005770498968
- ETC may enter a consolidation phase, with prices estimated between $8.8656993645 and $18.9023401545
- Key drivers: Institutional capital inflow, ETFs, ecosystem development
Long-term Prediction (2030)
- RWA: Base scenario $0.006744279976106 - $0.00573263797969 | Optimistic scenario $0.00573263797969 - $0.009441991966548
- ETC: Base scenario $23.037515616719587 - $21.655264679716412 | Optimistic scenario $21.655264679716412 - $25.571642334558742
Disclaimer: These predictions are based on historical data and current market trends. Cryptocurrency markets are highly volatile and subject to change. This information should not be considered as financial advice.
RWA:
| 年份 | 预测最高价 | 预测平均价格 | 预测最低价 | 涨跌幅 |
|---|---|---|---|---|
| 2025 | 0.00467526 | 0.003489 | 0.00317499 | 0 |
| 2026 | 0.0052251264 | 0.00408213 | 0.0026942058 | 16 |
| 2027 | 0.005770498968 | 0.0046536282 | 0.003071394612 | 33 |
| 2028 | 0.00745325092512 | 0.005212063584 | 0.00307511751456 | 49 |
| 2029 | 0.007155902697652 | 0.00633265725456 | 0.004116227215464 | 81 |
| 2030 | 0.009441991966548 | 0.006744279976106 | 0.00573263797969 | 93 |
ETC:
| 年份 | 预测最高价 | 预测平均价格 | 预测最低价 | 涨跌幅 |
|---|---|---|---|---|
| 2025 | 17.03394 | 13.519 | 10.95039 | 0 |
| 2026 | 18.1789993 | 15.27647 | 14.0543524 | 11 |
| 2027 | 18.9023401545 | 16.72773465 | 8.8656993645 | 22 |
| 2028 | 23.6939997449925 | 17.81503740225 | 15.67723291398 | 30 |
| 2029 | 25.320512659817925 | 20.75451857362125 | 14.320617815798662 | 52 |
| 2030 | 25.571642334558742 | 23.037515616719587 | 21.655264679716412 | 68 |
IV. Investment Strategy Comparison: RWA vs ETC
Long-term vs Short-term Investment Strategies
- RWA: Suitable for investors focusing on real-world asset exposure and regulatory compliance
- ETC: Suitable for investors seeking cryptocurrency ecosystem exposure and potential for high volatility returns
Risk Management and Asset Allocation
- Conservative investors: RWA: 70% vs ETC: 30%
- Aggressive investors: RWA: 40% vs ETC: 60%
- Hedging tools: Stablecoin allocation, options, cross-currency portfolios
V. Potential Risk Comparison
Market Risks
- RWA: Valuation fluctuations of underlying assets, liquidity risks
- ETC: High volatility, correlation with broader cryptocurrency market
Technical Risks
- RWA: Smart contract vulnerabilities, oracle reliability
- ETC: Network security, 51% attack vulnerability
Regulatory Risks
- Global regulatory policies have differing impacts on both assets, with RWAs generally facing clearer frameworks
VI. Conclusion: Which Is the Better Buy?
📌 Investment Value Summary:
- RWA advantages: Regulatory clarity, real-world asset backing, potential institutional adoption
- ETC advantages: Established history, fixed supply cap, potential for high returns in bull markets
✅ Investment Advice:
- New investors: Consider a higher allocation to RWA for lower volatility and regulatory clarity
- Experienced investors: Balanced portfolio with both RWA and ETC based on risk tolerance
- Institutional investors: Focus on RWA for regulatory compliance and integration with traditional finance
⚠️ Risk Warning: Cryptocurrency markets are highly volatile. This article does not constitute investment advice. None
VII. FAQ
Q1: What are the key differences between RWA and ETC? A: RWA focuses on tokenized real-world assets, while ETC is a continuation of the original Ethereum blockchain. RWA typically offers more stability and regulatory clarity, while ETC provides exposure to the cryptocurrency ecosystem with higher volatility potential.
Q2: Which asset is better for long-term investment? A: The better long-term investment depends on your risk tolerance and investment goals. RWA may be more suitable for conservative investors seeking stable returns and regulatory compliance, while ETC might appeal to those comfortable with higher risk and potential for greater returns in bull markets.
Q3: How do supply mechanisms differ between RWA and ETC? A: RWA's supply is typically linked to the underlying real-world assets, while ETC has a fixed supply cap of 210.7 million coins with a declining inflation rate, similar to Bitcoin's model.
Q4: What are the main risks associated with investing in RWA and ETC? A: For RWA, main risks include valuation fluctuations of underlying assets and liquidity risks. For ETC, risks include high volatility, network security concerns, and potential 51% attacks.
Q5: How do institutional investors view RWA compared to ETC? A: Institutional investors generally show more interest in RWA due to its regulatory clarity and familiar asset structures. ETC is seen as a more niche cryptocurrency investment with higher risk.
Q6: What are the price predictions for RWA and ETC by 2030? A: Based on the provided predictions, RWA's price range for 2030 is estimated between $0.00573263797969 and $0.009441991966548, while ETC's range is between $21.655264679716412 and $25.571642334558742. However, these predictions are speculative and subject to market conditions.
Share
Content
Introduction: Investment Comparison of RWA vs ETC
I. Price History Comparison and Current Market Status
II. Key Factors Affecting RWA vs ETC Investment Value
III. 2025-2030 Price Prediction: RWA vs ETC
IV. Investment Strategy Comparison: RWA vs ETC
V. Potential Risk Comparison
VI. Conclusion: Which Is the Better Buy?
VII. FAQ

