RTF vs AVAX: Comparing Two Blockchain Networks for DeFi and Smart Contract Development


Introduction: RTF vs AVAX Investment Comparison
In the cryptocurrency market, comparisons between RTF and AVAX have become an unavoidable topic for investors. The two assets show significant differences not only in market cap rankings and application scenarios, but also represent different positioning within the crypto asset landscape. RTF (Ready to Fight): Since its launch in April 2024, it has gained market recognition by leveraging blockchain technology and SocialFi principles to transform the professional fighting industry, creating a unified ecosystem for fighters, coaches, fans, promoters, and other stakeholders. AVAX (Avalanche): Since its launch in July 2020, it has been recognized as a leading smart contract platform, offering a revolutionary consensus protocol that enables smart contracts with 1-second transaction finality and Ethereum toolkit compatibility, establishing itself as one of the most traded and highest market-cap cryptocurrencies in the digital finance space. This article will provide a comprehensive analysis of the investment value comparison between RTF and AVAX from multiple dimensions including historical price performance, supply mechanisms, ecosystem maturity, and market positioning, while attempting to address the question investors care most about:
"Which represents a better opportunity right now?"
I. Historical Price Comparison and Current Market Status
Ready to Fight (RTF) and Avalanche (AVAX) Historical Price Trends
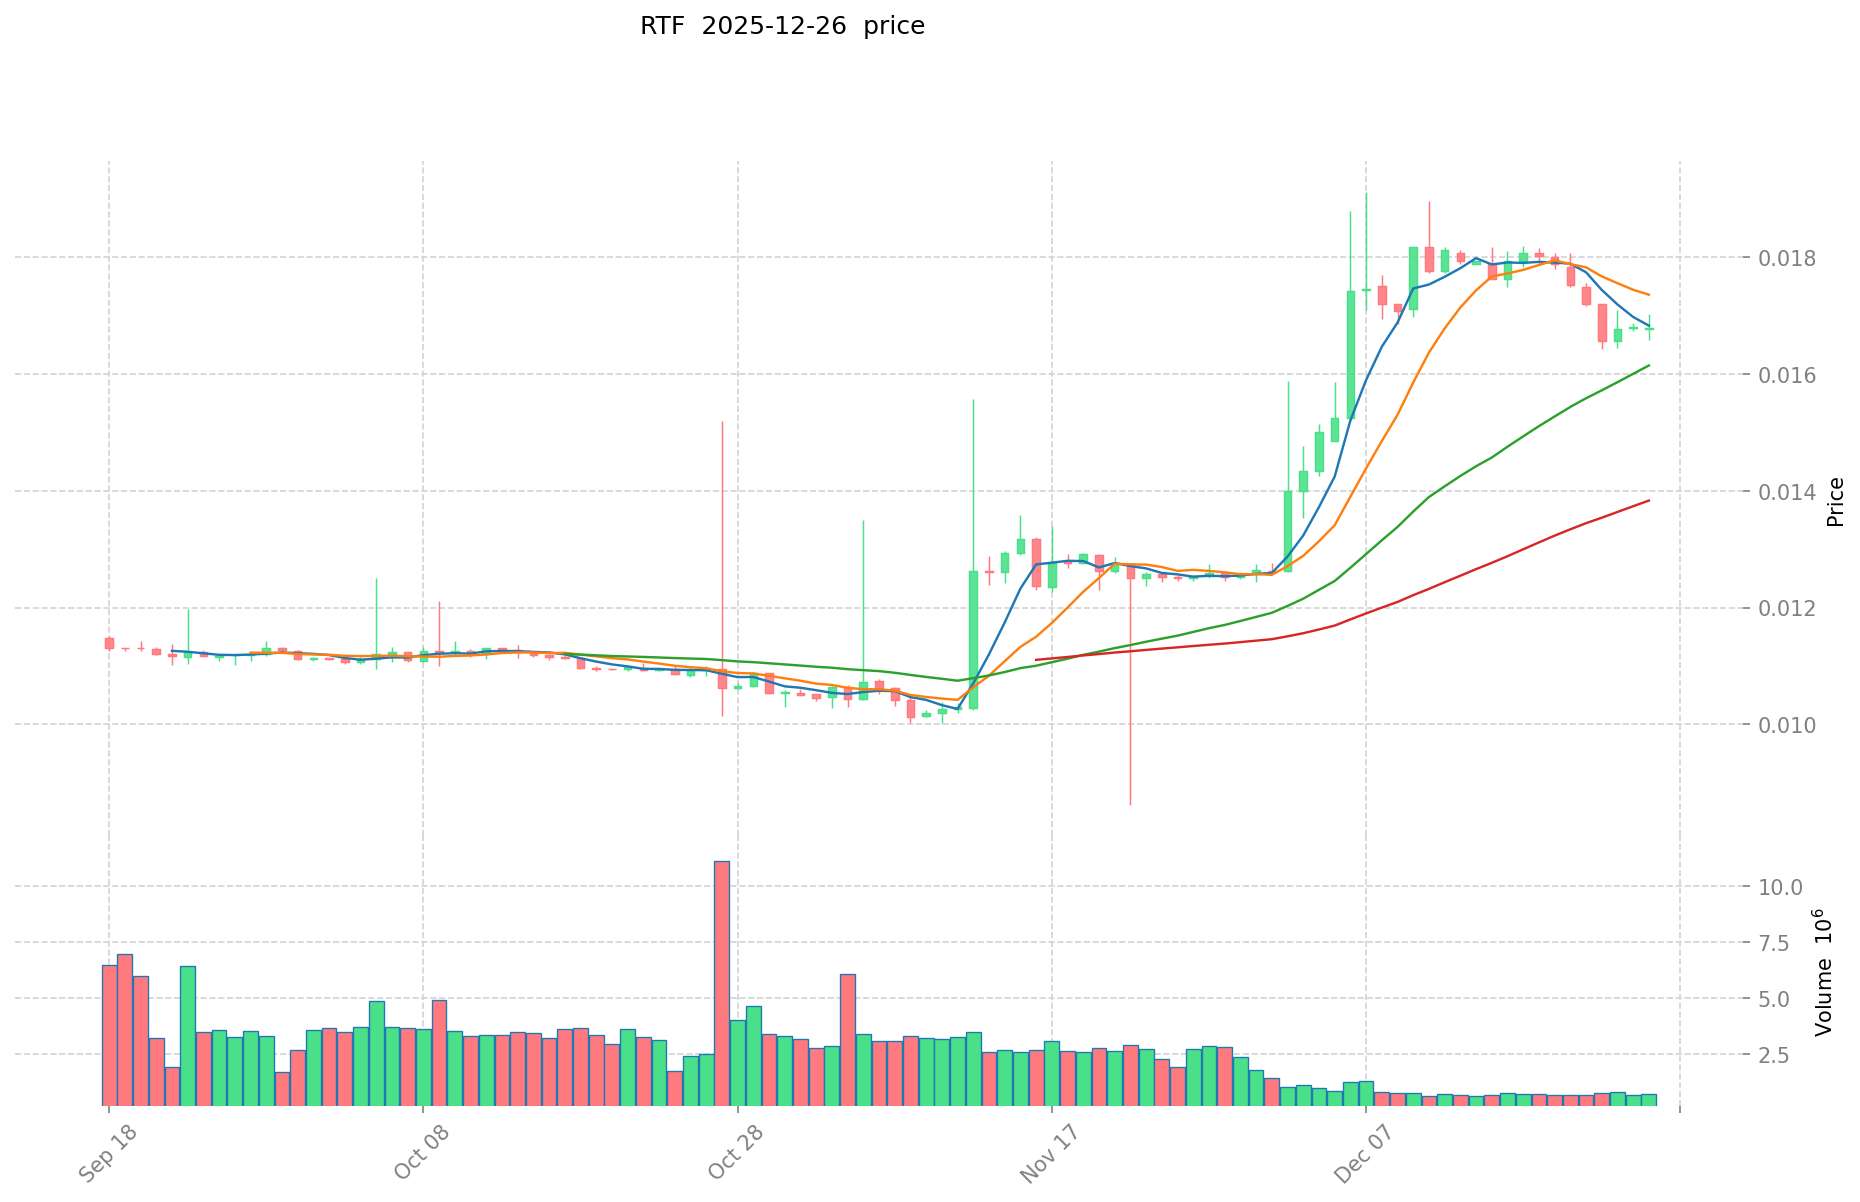
- 2024: Ready to Fight (RTF) reached its all-time high of $0.356 on April 24, 2024, reflecting early market enthusiasm for the platform's blockchain-based professional fighting ecosystem.
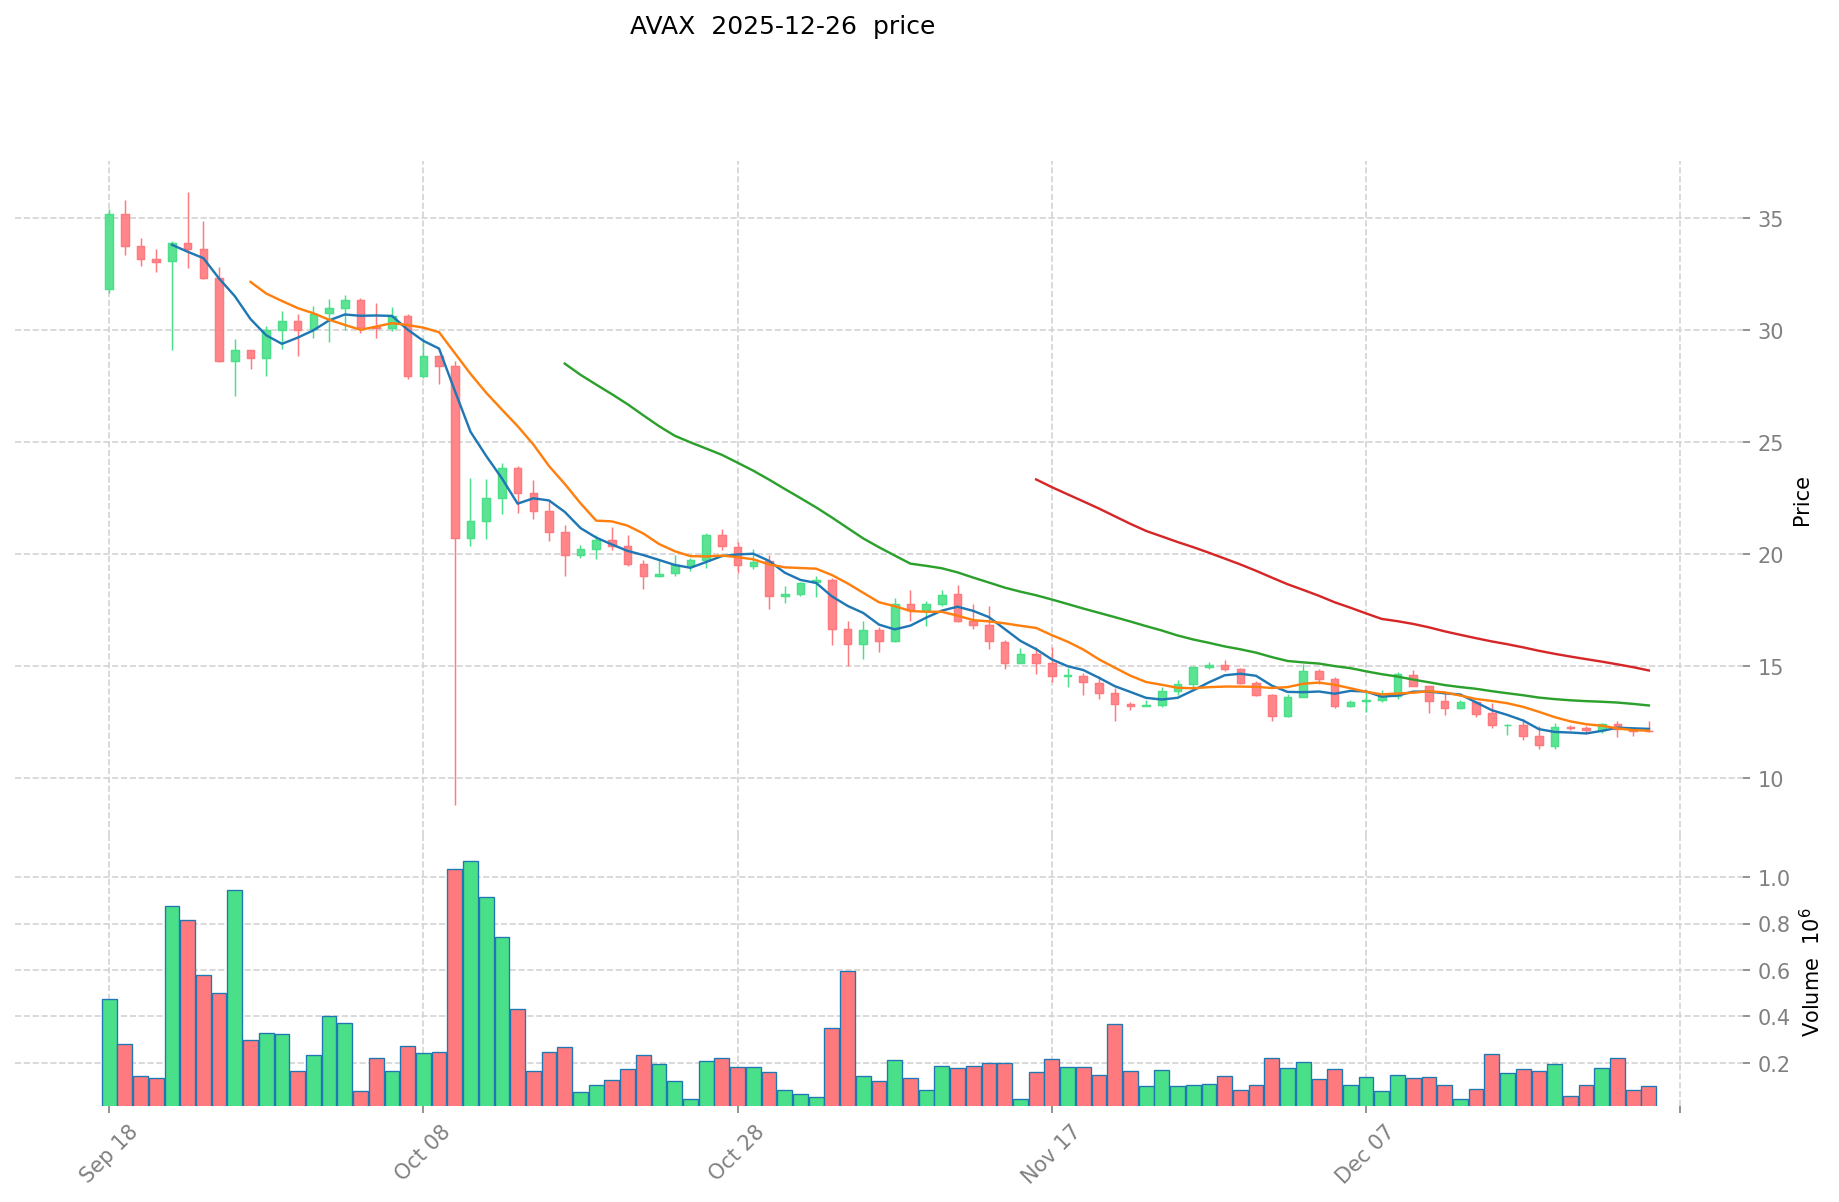
- 2020: Avalanche (AVAX) launched at $0.583 and experienced significant growth, reaching its all-time high of $144.96 on November 21, 2021, driven by the expansion of decentralized applications and the broader cryptocurrency bull market.
- Comparative analysis: In the broader market cycle, RTF has declined from its peak of $0.356 to the current price of $0.01682, representing a 95.27% decrease from the all-time high. During the same period, AVAX has fallen from its peak of $144.96 to $12.16, representing a 91.61% decrease, indicating both tokens experienced significant corrections though AVAX maintained relatively greater stability in recent market conditions.
Current Market Status (December 26, 2025)
- RTF current price: $0.01682
- AVAX current price: $12.16
- 24-hour trading volume: RTF $12,108.68 vs AVAX $1,275,000.68
- Market sentiment index (Fear & Greed Index): 20 (Extreme Fear)
Click to view real-time prices:
- View RTF current price Market Price
- View AVAX current price Market Price
II. Core Factors Affecting RTF vs AVAX Investment Value
Supply Mechanism Comparison (Tokenomics)
- RTF: Supply mechanism includes planned token burn mechanisms and institutional participation mechanisms based on available information.
- AVAX: As the native token of the Avalanche platform, AVAX operates within the ecosystem's incentive structure. The network distributes rewards to validators through staking mechanisms, with token economics designed to encourage network participation and security.
- 📌 Historical Pattern: Supply mechanisms directly influence price cycle dynamics through participation incentives and scarcity factors.
Institutional Adoption and Market Applications
- Institutional Holdings: AVAX has attracted significant institutional interest following major funding rounds, including $230 million in June 2021 led by Polychain Capital and Three Arrows Capital.
- Enterprise Adoption: AVAX demonstrates strong application in DeFi protocols (Aave, Curve, Benqi, Pangolin, Vee.Finance) and NFT markets (OpenSea, Joepegs, Kalao), establishing itself as a multi-use ecosystem token. RTF information regarding institutional adoption and enterprise applications is insufficient in available sources.
- Regulatory Environment: Specific regulatory treatment differences between jurisdictions for these tokens remain outside the scope of available reference materials.
Technology Development and Ecosystem Building
- AVAX Technical Infrastructure: Avalanche features a three-chain architecture with P-chain orchestration supporting subnet creation, enabling horizontal scaling. The network achieved mainnet launch on September 20, 2020, with subsequent ecosystem expansion through Avalanche Rush ($180 million liquidity mining rewards) and Blizzard Fund ($200+ million ecosystem development fund).
- Ecosystem Comparison: AVAX ecosystem spans multiple sectors including DeFi applications providing lending, trading, and liquidity services; NFT platforms enabling content creation, trading, and application scenarios; and community governance through stake-weighted voting mechanisms.
- RTF Technology Development: Specific technical developments and ecosystem applications for RTF require additional information sources.
Macroeconomic Environment and Market Cycles
- Inflation Resilience: AVAX price performance from 2020 to 2021 demonstrated significant volatility, ranging from several dollars at mainnet launch to over $140 in November 2021, reflecting market recognition of technological innovations and ecosystem growth rather than inflation-hedging characteristics.
- Monetary Policy Impact: Cryptocurrency market dynamics, including AVAX price movements, respond to broader market trends and investor sentiment rather than traditional monetary policy transmission mechanisms.
- Geopolitical Factors: Cross-border transaction demand and international market conditions represent general market environment factors affecting crypto asset valuations.
III. 2025-2030 Price Forecast: RTF vs AVAX
Short-term Forecast (2025)
- RTF: Conservative $0.0152789–$0.01679 | Optimistic $0.0236739
- AVAX: Conservative $8.8987–$12.19 | Optimistic $13.5309
Mid-term Forecast (2026-2028)
- RTF may enter consolidation phase, expected price range $0.016994838–$0.029538647
- AVAX may enter growth phase, expected price range $9.1309195–$20.073876405
- Key drivers: institutional capital inflows, ETF adoption, ecosystem development
Long-term Forecast (2029-2030)
- RTF: Base scenario $0.018991924781282–$0.026016335316825 | Optimistic scenario $0.033561072558704–$0.037831654000961
- AVAX: Base scenario $13.874361758033356–$19.541354588779375 | Optimistic scenario $20.81976096374625–$26.967069332515537
RTF:
| 年份 | 预测最高价 | 预测平均价格 | 预测最低价 | 涨跌幅 |
|---|---|---|---|---|
| 2025 | 0.0236739 | 0.01679 | 0.0152789 | 0 |
| 2026 | 0.029538647 | 0.02023195 | 0.016994838 | 20 |
| 2027 | 0.025631857455 | 0.0248852985 | 0.016673149995 | 47 |
| 2028 | 0.02677409265615 | 0.0252585779775 | 0.020459448161775 | 50 |
| 2029 | 0.033561072558704 | 0.026016335316825 | 0.018991924781282 | 54 |
| 2030 | 0.037831654000961 | 0.029788703937764 | 0.020256318677679 | 77 |
AVAX:
| 年份 | 预测最高价 | 预测平均价格 | 预测最低价 | 涨跌幅 |
|---|---|---|---|---|
| 2025 | 13.5309 | 12.19 | 8.8987 | 0 |
| 2026 | 18.261839 | 12.86045 | 9.1309195 | 6 |
| 2027 | 20.073876405 | 15.5611445 | 9.3366867 | 28 |
| 2028 | 18.708385975125 | 17.8175104525 | 11.04685648055 | 47 |
| 2029 | 20.81976096374625 | 18.2629482138125 | 14.24509960677375 | 51 |
| 2030 | 26.967069332515537 | 19.541354588779375 | 13.874361758033356 | 61 |
IV. Investment Strategy Comparison: RTF vs AVAX
Long-term vs Short-term Investment Strategy
- RTF: Suitable for investors focusing on emerging SocialFi ecosystem potential and early-stage blockchain professional sports applications, with willingness to accept higher volatility for potential long-term growth opportunities
- AVAX: Suitable for investors seeking established smart contract platform exposure with demonstrated ecosystem maturity, multi-sector DeFi and NFT applications, and relatively greater price stability compared to early-stage projects
Risk Management and Asset Allocation
- Conservative Investors: RTF 5-10% vs AVAX 15-25%
- Aggressive Investors: RTF 20-35% vs AVAX 40-50%
- Hedging Tools: Stablecoin allocation for downside protection, derivatives strategies for volatility management, cross-token portfolio diversification
V. Potential Risk Comparison
Market Risk
- RTF: Limited trading volume ($12,108.68 in 24-hour volume) creates liquidity concerns and increased price volatility; early-stage project status with uncertain market adoption trajectory
- AVAX: Exposure to broader smart contract platform competition; market concentration risk from institutional holdings and established DeFi protocol dependencies
Technology Risk
- RTF: Unproven scalability at scale; limited ecosystem maturity and technical infrastructure documentation in available sources
- AVAX: Network security dependent on validator participation and staking mechanisms; potential consensus protocol vulnerabilities in extreme market conditions
Regulatory Risk
- Global regulatory treatment of SocialFi platforms remains evolving, creating uncertainty for RTF adoption across jurisdictions
- Smart contract platform regulation and decentralized finance compliance requirements may impact AVAX ecosystem applications differently by jurisdiction
VI. Conclusion: Which Is the Better Buy?
📌 Investment Value Summary
- RTF Advantages: Early-stage SocialFi ecosystem positioning in professional fighting industry; potential for significant growth if platform achieves mainstream adoption; long-term forecast suggesting 77% appreciation by 2030 in optimistic scenarios
- AVAX Advantages: Established smart contract platform with proven technical infrastructure and demonstrated ecosystem applications; significant institutional backing and capital investments; more stable price history with diversified DeFi and NFT applications; lower relative volatility compared to emerging projects
✅ Investment Recommendations
- Novice Investors: AVAX represents a more suitable entry point given established ecosystem maturity, lower technical complexity, and greater regulatory clarity; RTF exposure should be limited to small exploratory positions
- Experienced Investors: Consider AVAX as core holdings providing ecosystem exposure; allocate smaller positions to RTF as higher-risk, higher-reward opportunities aligned with risk tolerance and research depth
- Institutional Investors: AVAX demonstrates institutional-grade infrastructure suitable for larger allocations; RTF requires additional due diligence on team credibility, regulatory compliance, and ecosystem development trajectory before significant capital commitment
⚠️ Risk Disclaimer: The cryptocurrency market exhibits extreme volatility. This analysis does not constitute investment advice. All investment decisions should be made based on comprehensive personal research, risk tolerance assessment, and consultation with qualified financial advisors.
FAQ
RTF和AVAX分别是什么?它们各自的主要用途和特点是什么?
AVAX是Avalanche区块链的原生代币,用于网络验证、交易手续费和治理,具有高速低成本特点。RTF在加密领域指特定项目代币,具体用途取决于其所属生态,两者都是区块链网络的核心资产。
RTF和AVAX在技术架构和共识机制上有什么区别?
AVAX采用三链架构(X-Chain、C-Chain、P-Chain),共识机制基于验证者网络。RTF采用权益证明机制,架构设计更为简洁。两者在扩展性和功能定位上存在差异,AVAX侧重多链互操作性。
RTF和AVAX的性能表现如何对比?TPS、交易费用、确认速度等方面有什么差异?
AVAX作为成熟公链,TPS约4500笔/秒,交易费用低廉,确认速度快。RTF作为新兴项目,具体性能指标仍在开发中,未来有望通过创新共识机制提升交易效率与用户体验。
RTF和AVAX的生态应用和项目支持情况如何?哪个生态更成熟?
AVAX生态更成熟,拥有丰富的去中心化项目、DeFi应用和AI生态支持,生态活跃度更高。RTF生态相对较小,项目数量和应用场景有限,整体生态发展程度不如AVAX完善。
从投资角度看,RTF和AVAX各自的风险和潜力如何评估?
RTF潜力在于特定应用场景,但面临技术成熟度风险;AVAX拥有强大区块链基础和生态,但市场竞争激烈。长期看AVAX潜力更大,RTF风险相对较高。
RTF和AVAX的市场流动性和交易对支持情况如何比较?
AVAX拥有更广泛的交易对支持和更高的市场流动性,日均交易额显著高于RTF。RTF的流动性相对较低,可用交易对数量也更少。总体而言,AVAX在市场认可度和交易活跃度上明显领先。
RTF和AVAX在安全性和去中心化程度上有什么区别?
AVAX采用Avalanche共识机制和多链架构,具有更高的去中心化程度和安全性。RTF依赖PoS共识,在安全性和去中心化方面不如AVAX优越。
Share
Content
Introduction: RTF vs AVAX Investment Comparison
I. Historical Price Comparison and Current Market Status
Supply Mechanism Comparison (Tokenomics)
Institutional Adoption and Market Applications
Technology Development and Ecosystem Building
Macroeconomic Environment and Market Cycles
III. 2025-2030 Price Forecast: RTF vs AVAX
IV. Investment Strategy Comparison: RTF vs AVAX
V. Potential Risk Comparison
VI. Conclusion: Which Is the Better Buy?
FAQ
How to Buy Cryptocurrency


Trending Cryptocurrencies


Is Hive (HIVE) a good investment?: Analyzing the potential and risks of this blockchain-based social media platform

DESO vs KAVA: A Comparative Analysis of Two Emerging Blockchain Platforms

Is Steem (STEEM) a good investment?: Analyzing the potential and risks of this blockchain-based social media platform

Is Decentralized Social (DESO) a good investment?: Analyzing the potential and risks of the blockchain-based social media platform
Is Decentralized Social (DESO) a good investment?: Analyzing the potential and risks of this blockchain-based social media platform

Is Decentralized Social (DESO) a good investment?: Analyzing the Potential and Risks of the Blockchain-Based Social Media Platform
How does TON price volatility compare to Bitcoin and Ethereum in 2026?

How Do Derivatives Market Signals Like Futures Open Interest, Funding Rates, and Long-Short Ratios Impact Cryptocurrency Price Predictions?

What is driving LIT price volatility: technical analysis, support and resistance levels, and 24-hour trading data
How does on-chain data analysis reveal whale movements and predict cryptocurrency market trends in 2026?
What are the on-chain data metrics revealing about Fartcoin's active addresses, transaction volume, and whale distribution in 2026?