PROS vs NEAR: Comparing Two Leading Blockchain Platforms for Decentralized Applications
Introduction: Investment Comparison of PROS vs NEAR
In the cryptocurrency market, the comparison between Prosper (PROS) vs Near (NEAR) has been an unavoidable topic for investors. The two not only have significant differences in market cap ranking, application scenarios, and price performance, but also represent different positioning in crypto assets.
Prosper (PROS): Since its launch in 2021, it has gained market recognition for bridging institutional-grade Bitcoin mining power on-chain.
Near (NEAR): Introduced in 2020, it has been hailed as a highly scalable protocol for supporting DApp operations on mobile devices, becoming one of the cryptocurrencies with significant global trading volume and market capitalization.
This article will comprehensively analyze the investment value comparison between PROS and NEAR, focusing on historical price trends, supply mechanisms, institutional adoption, technological ecosystems, and future predictions, attempting to answer the question most concerning to investors:
"Which is the better buy right now?"
I. Price History Comparison and Current Market Status
PROS (Coin A) and NEAR (Coin B) Historical Price Trends
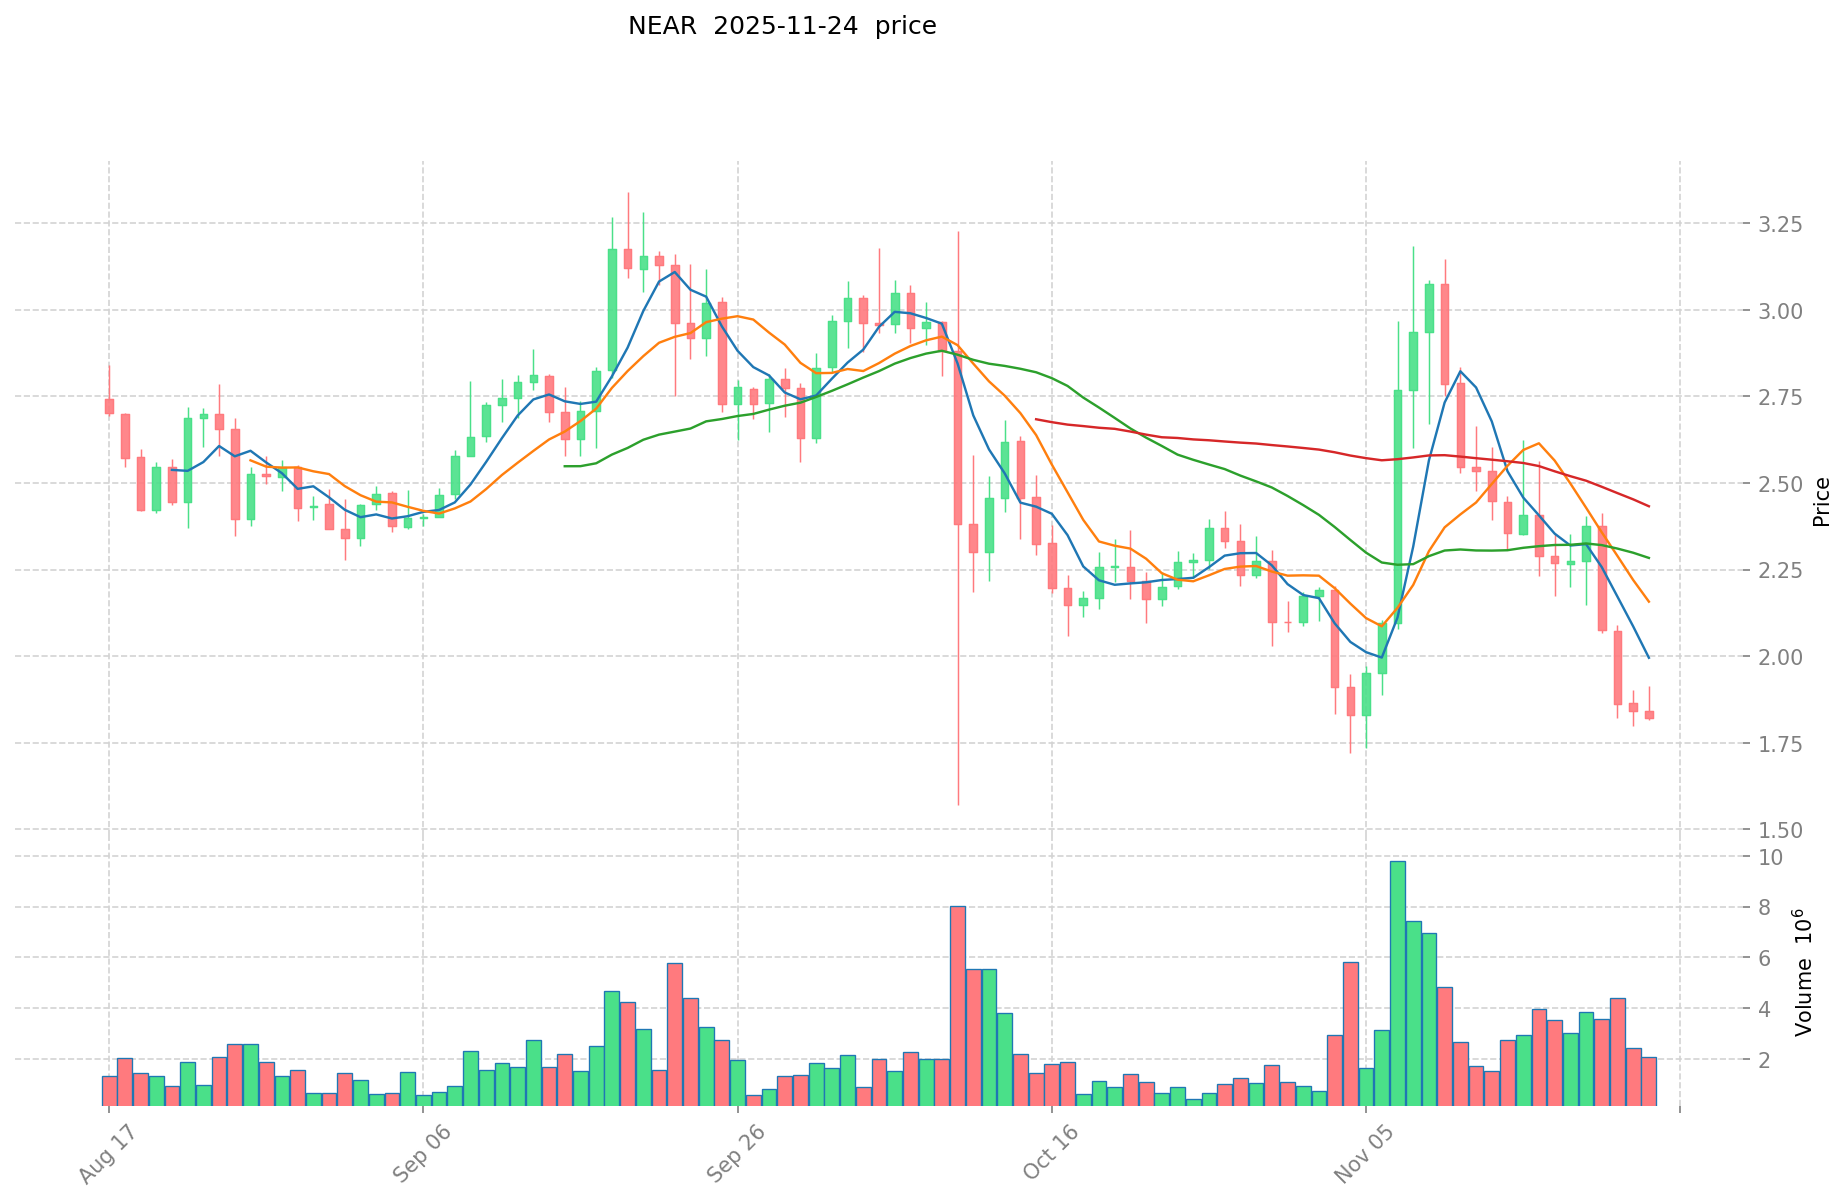
- 2021: NEAR reached its all-time high of $20.44 on January 17, 2022, likely due to increased adoption and market enthusiasm.
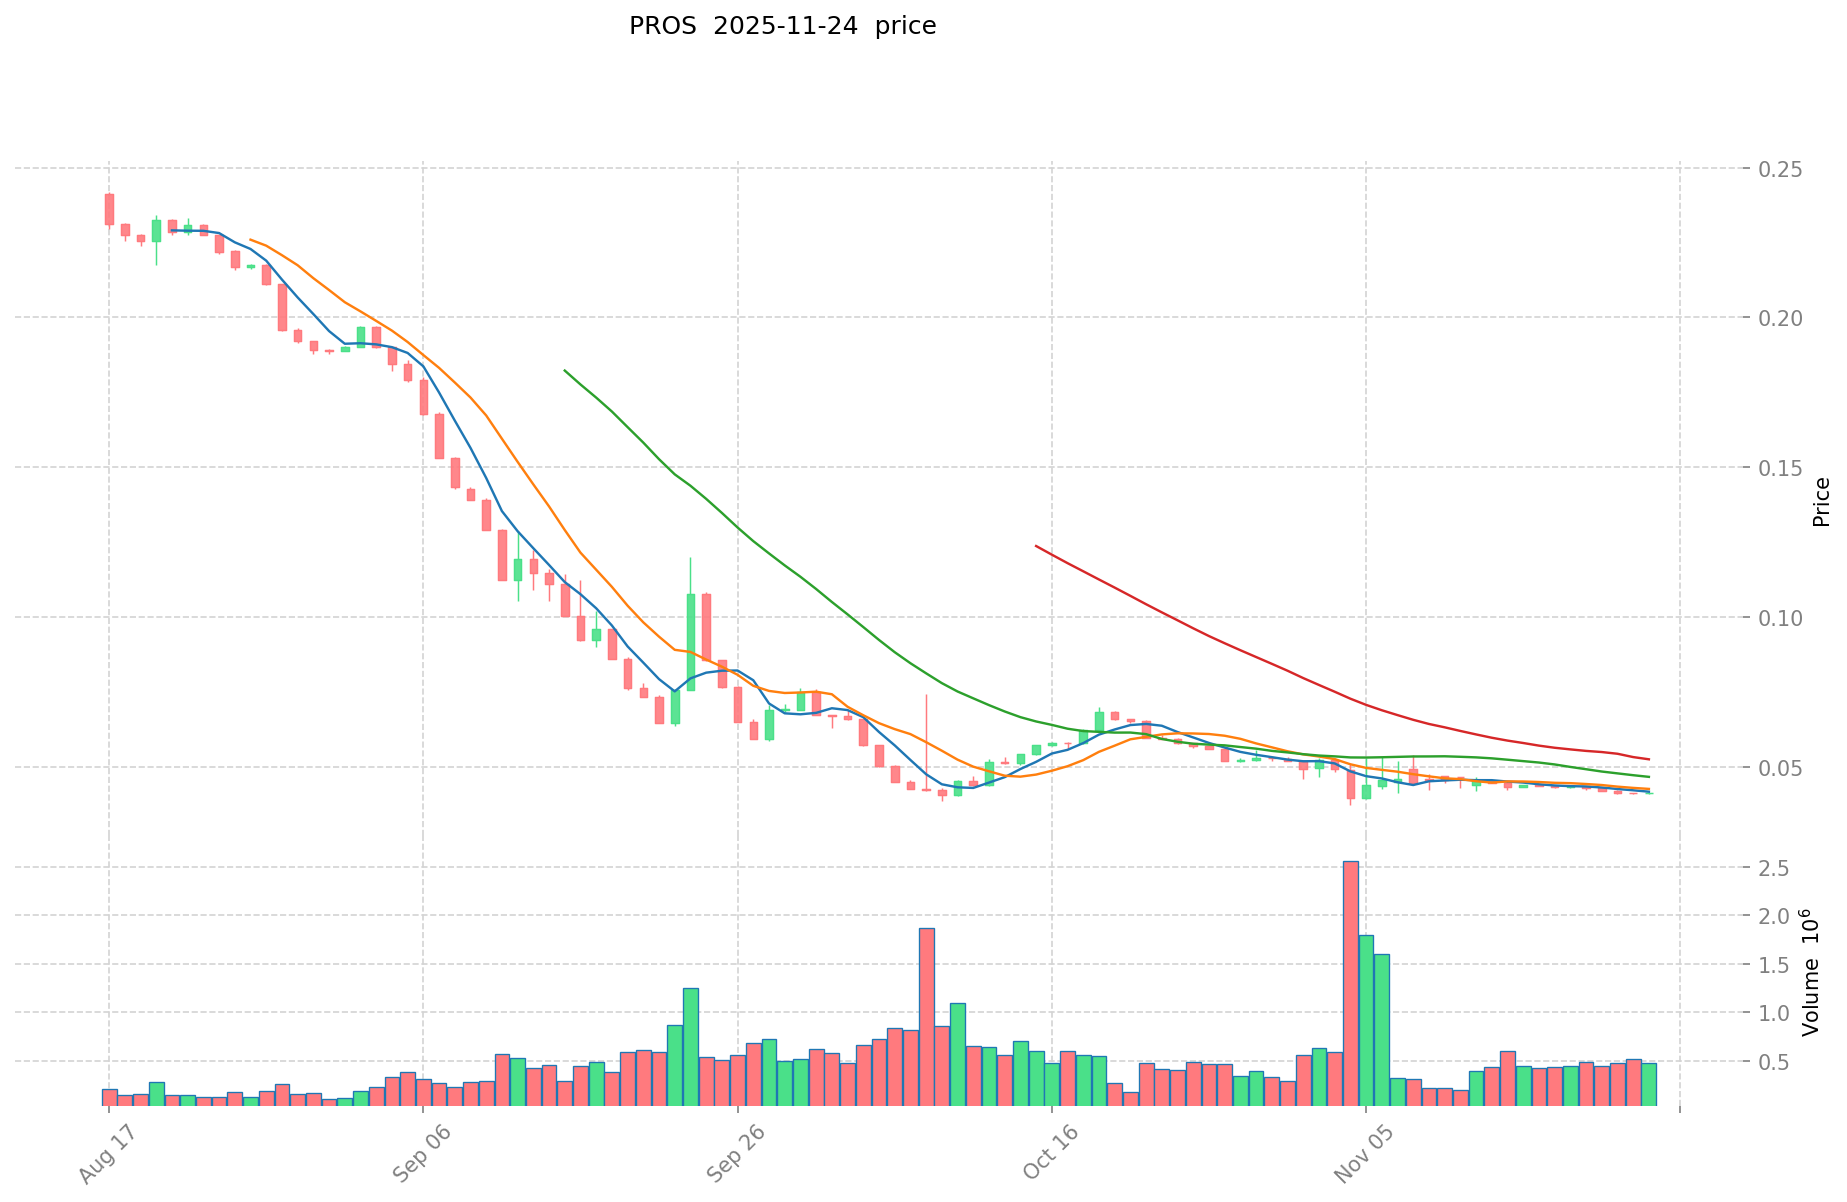
- 2025: PROS hit its all-time low of $0.02573586 on April 15, 2025, possibly due to market-wide corrections or project-specific challenges.
- Comparative analysis: In the current market cycle, PROS has fallen from its all-time high of $9.61 to its current price of $0.04113, representing a significant decline. NEAR has also experienced a substantial drop from its peak of $20.44 to the current $1.859, but has maintained a higher market position.
Current Market Situation (2025-11-24)
- PROS current price: $0.04113
- NEAR current price: $1.859
- 24-hour trading volume: PROS $19,521.34 vs NEAR $3,922,592.09
- Market Sentiment Index (Fear & Greed Index): 19 (Extreme Fear)
Click to view real-time prices:
- View PROS current price Market Price
- View NEAR current price Market Price
II. Core Factors Affecting Investment Value of PROS vs NEAR
Supply Mechanism Comparison (Tokenomics)
- PROS: Fixed supply of 10 million tokens with no further inflation
- NEAR: Inflationary model with 5% annual inflation rate, of which 4.5% goes to validators
- 📌 Historical pattern: Fixed supply tokens like PROS tend to appreciate more in bull markets due to scarcity, while NEAR's continuous emission provides sustainable staking rewards but creates selling pressure
Institutional Adoption and Market Applications
- Institutional holdings: NEAR has attracted more institutional investment with backing from a16z, Coinbase Ventures, and Dragonfly Capital
- Enterprise adoption: NEAR has gained traction in enterprise use cases through partnerships like Sweatcoin and the Open Forest Protocol, while PROS focuses on DeFi applications
- Regulatory stance: Both projects maintain compliance, though NEAR's broader ecosystem faces more regulatory scrutiny due to its wider range of applications
Technical Development and Ecosystem Building
- PROS technical upgrades: ProSwap DEX integration offering liquidity and trading solutions
- NEAR technical development: Nightshade sharding implementation and Fast Finality improvements for scalability and security
- Ecosystem comparison: NEAR has a more diverse ecosystem spanning DeFi, NFTs, and gaming with 1,000+ dApps, while PROS maintains a focused approach on specialized DeFi solutions
Macroeconomic and Market Cycles
- Performance in inflationary environments: PROS fixed supply model theoretically offers better inflation resistance
- Macroeconomic monetary policy: Both tokens show sensitivity to Federal Reserve decisions, with NEAR demonstrating higher correlation to broader crypto market movements
- Geopolitical factors: NEAR's decentralized cloud infrastructure positions it better for cross-border solutions in fragmented regulatory environments
III. Price Prediction 2025-2030: PROS vs NEAR
Short-term Prediction (2025)
- PROS: Conservative $0.032952 - $0.04119 | Optimistic $0.04119 - $0.0514875
- NEAR: Conservative $1.63671 - $1.839 | Optimistic $1.839 - $2.29875
Mid-term Prediction (2027)
- PROS may enter a growth phase, expected price range $0.02469855375 - $0.065546161875
- NEAR may enter a consolidation phase, expected price range $1.5640695 - $2.69367525
- Key drivers: Institutional capital inflow, ETF, ecosystem development
Long-term Prediction (2030)
- PROS: Base scenario $0.077624063390671 - $0.093925116702712 | Optimistic scenario $0.093925116702712+
- NEAR: Base scenario $3.27517891155 - $3.995718272091 | Optimistic scenario $3.995718272091+
Disclaimer: The above predictions are based on historical data and market analysis. Cryptocurrency markets are highly volatile and subject to change. This information should not be considered as financial advice. Always conduct your own research before making investment decisions.
PROS:
| 年份 | 预测最高价 | 预测平均价格 | 预测最低价 | 涨跌幅 |
|---|---|---|---|---|
| 2025 | 0.0514875 | 0.04119 | 0.032952 | 0 |
| 2026 | 0.0486556875 | 0.04633875 | 0.03892455 | 12 |
| 2027 | 0.065546161875 | 0.04749721875 | 0.02469855375 | 15 |
| 2028 | 0.071782546696875 | 0.0565216903125 | 0.0542608227 | 37 |
| 2029 | 0.091096008276656 | 0.064152118504687 | 0.04298191939814 | 55 |
| 2030 | 0.093925116702712 | 0.077624063390671 | 0.05200812247175 | 88 |
NEAR:
| 年份 | 预测最高价 | 预测平均价格 | 预测最低价 | 涨跌幅 |
|---|---|---|---|---|
| 2025 | 2.29875 | 1.839 | 1.63671 | -1 |
| 2026 | 2.2757625 | 2.068875 | 1.51027875 | 11 |
| 2027 | 2.69367525 | 2.17231875 | 1.5640695 | 16 |
| 2028 | 2.87093646 | 2.432997 | 2.04371748 | 30 |
| 2029 | 3.8983910931 | 2.65196673 | 2.386770057 | 42 |
| 2030 | 3.995718272091 | 3.27517891155 | 3.078668176857 | 76 |
IV. Investment Strategy Comparison: PROS vs NEAR
Long-term vs Short-term Investment Strategies
- PROS: Suitable for investors focused on DeFi applications and tokenomics with fixed supply
- NEAR: Suitable for investors looking for ecosystem growth and broader blockchain adoption
Risk Management and Asset Allocation
- Conservative investors: PROS: 20% vs NEAR: 80%
- Aggressive investors: PROS: 40% vs NEAR: 60%
- Hedging tools: Stablecoin allocation, options, cross-currency portfolios
V. Potential Risk Comparison
Market Risk
- PROS: Higher volatility due to lower market cap and trading volume
- NEAR: Susceptible to broader crypto market trends and macroeconomic factors
Technical Risk
- PROS: Scalability, network stability
- NEAR: Validator concentration, potential security vulnerabilities in sharding implementation
Regulatory Risk
- Global regulatory policies may have a more significant impact on NEAR due to its wider range of applications and larger ecosystem
VI. Conclusion: Which Is the Better Buy?
📌 Investment Value Summary:
- PROS advantages: Fixed supply tokenomics, focused DeFi applications
- NEAR advantages: Established ecosystem, institutional backing, scalability solutions
✅ Investment Advice:
- New investors: Consider a higher allocation to NEAR due to its established ecosystem and lower volatility
- Experienced investors: Balanced approach with exposure to both, leveraging PROS for potential higher returns and NEAR for stability
- Institutional investors: Focus on NEAR for its broader adoption and institutional-grade infrastructure
⚠️ Risk Warning: Cryptocurrency markets are highly volatile. This article does not constitute investment advice. None
VII. FAQ
Q1: What are the main differences between PROS and NEAR? A: The main differences are:
- Market cap: NEAR has a significantly larger market cap and trading volume
- Supply mechanism: PROS has a fixed supply of 10 million tokens, while NEAR has an inflationary model with 5% annual inflation
- Ecosystem: NEAR has a more diverse ecosystem with 1,000+ dApps across DeFi, NFTs, and gaming, while PROS focuses on specialized DeFi solutions
- Institutional backing: NEAR has attracted more institutional investment from major venture capital firms
Q2: Which token has performed better historically? A: NEAR has generally maintained a higher market position. While both tokens have experienced significant declines from their all-time highs, NEAR's current price of $1.859 represents a smaller percentage drop compared to PROS' current price of $0.04113.
Q3: What are the key factors affecting the investment value of PROS and NEAR? A: Key factors include:
- Supply mechanism (tokenomics)
- Institutional adoption and market applications
- Technical development and ecosystem building
- Macroeconomic conditions and market cycles
Q4: How do the future price predictions compare for PROS and NEAR? A: By 2030, the base scenario predicts:
- PROS: $0.077624063390671 - $0.093925116702712
- NEAR: $3.27517891155 - $3.995718272091 NEAR is expected to maintain a higher price point, but both tokens are predicted to show growth.
Q5: What are the main risks associated with investing in PROS and NEAR? A: Main risks include:
- Market risk: Both are subject to crypto market volatility, with PROS potentially experiencing higher volatility due to its lower market cap
- Technical risk: PROS faces scalability challenges, while NEAR may have security risks related to its sharding implementation
- Regulatory risk: NEAR may face more regulatory scrutiny due to its wider range of applications
Q6: How should investors allocate their portfolio between PROS and NEAR? A: The allocation depends on the investor's risk profile:
- Conservative investors: 20% PROS, 80% NEAR
- Aggressive investors: 40% PROS, 60% NEAR New investors might consider a higher allocation to NEAR due to its established ecosystem and lower volatility.
Q7: Which token is considered the better buy overall? A: The better buy depends on individual investment goals:
- NEAR may be more suitable for those seeking stability and ecosystem growth
- PROS might appeal to investors looking for potential higher returns in DeFi applications Both tokens have their strengths, and a balanced approach considering both could be beneficial for diversification.
Share
Content
Introduction: Investment Comparison of PROS vs NEAR
I. Price History Comparison and Current Market Status
II. Core Factors Affecting Investment Value of PROS vs NEAR
III. Price Prediction 2025-2030: PROS vs NEAR
IV. Investment Strategy Comparison: PROS vs NEAR
V. Potential Risk Comparison
VI. Conclusion: Which Is the Better Buy?
VII. FAQ

