PIPE vs OP: The Battle for Efficiency in Modern Industrial Systems
Introduction: PIPE vs OP Investment Comparison
In the cryptocurrency market, the comparison between Pipe Network (PIPE) and Optimism (OP) has been a topic of ongoing interest for investors. The two projects not only differ significantly in terms of market cap ranking, application scenarios, and price performance, but also represent distinct positions in the crypto asset landscape.
Pipe Network (PIPE): Launched recently, it has gained market recognition for its innovative approach to decentralized cloud infrastructure, combining CDN, storage, and AI inference.
Optimism (OP): Introduced in 2022, it has been hailed as a solution for Ethereum scaling, offering a low-cost, high-speed Layer 2 blockchain.
This article will comprehensively analyze the investment value comparison between PIPE and OP, focusing on historical price trends, supply mechanisms, institutional adoption, technological ecosystems, and future predictions, aiming to address the question most critical to investors:
"Which is the better buy right now?"
I. Price History Comparison and Current Market Status
PIPE and OP Historical Price Trends
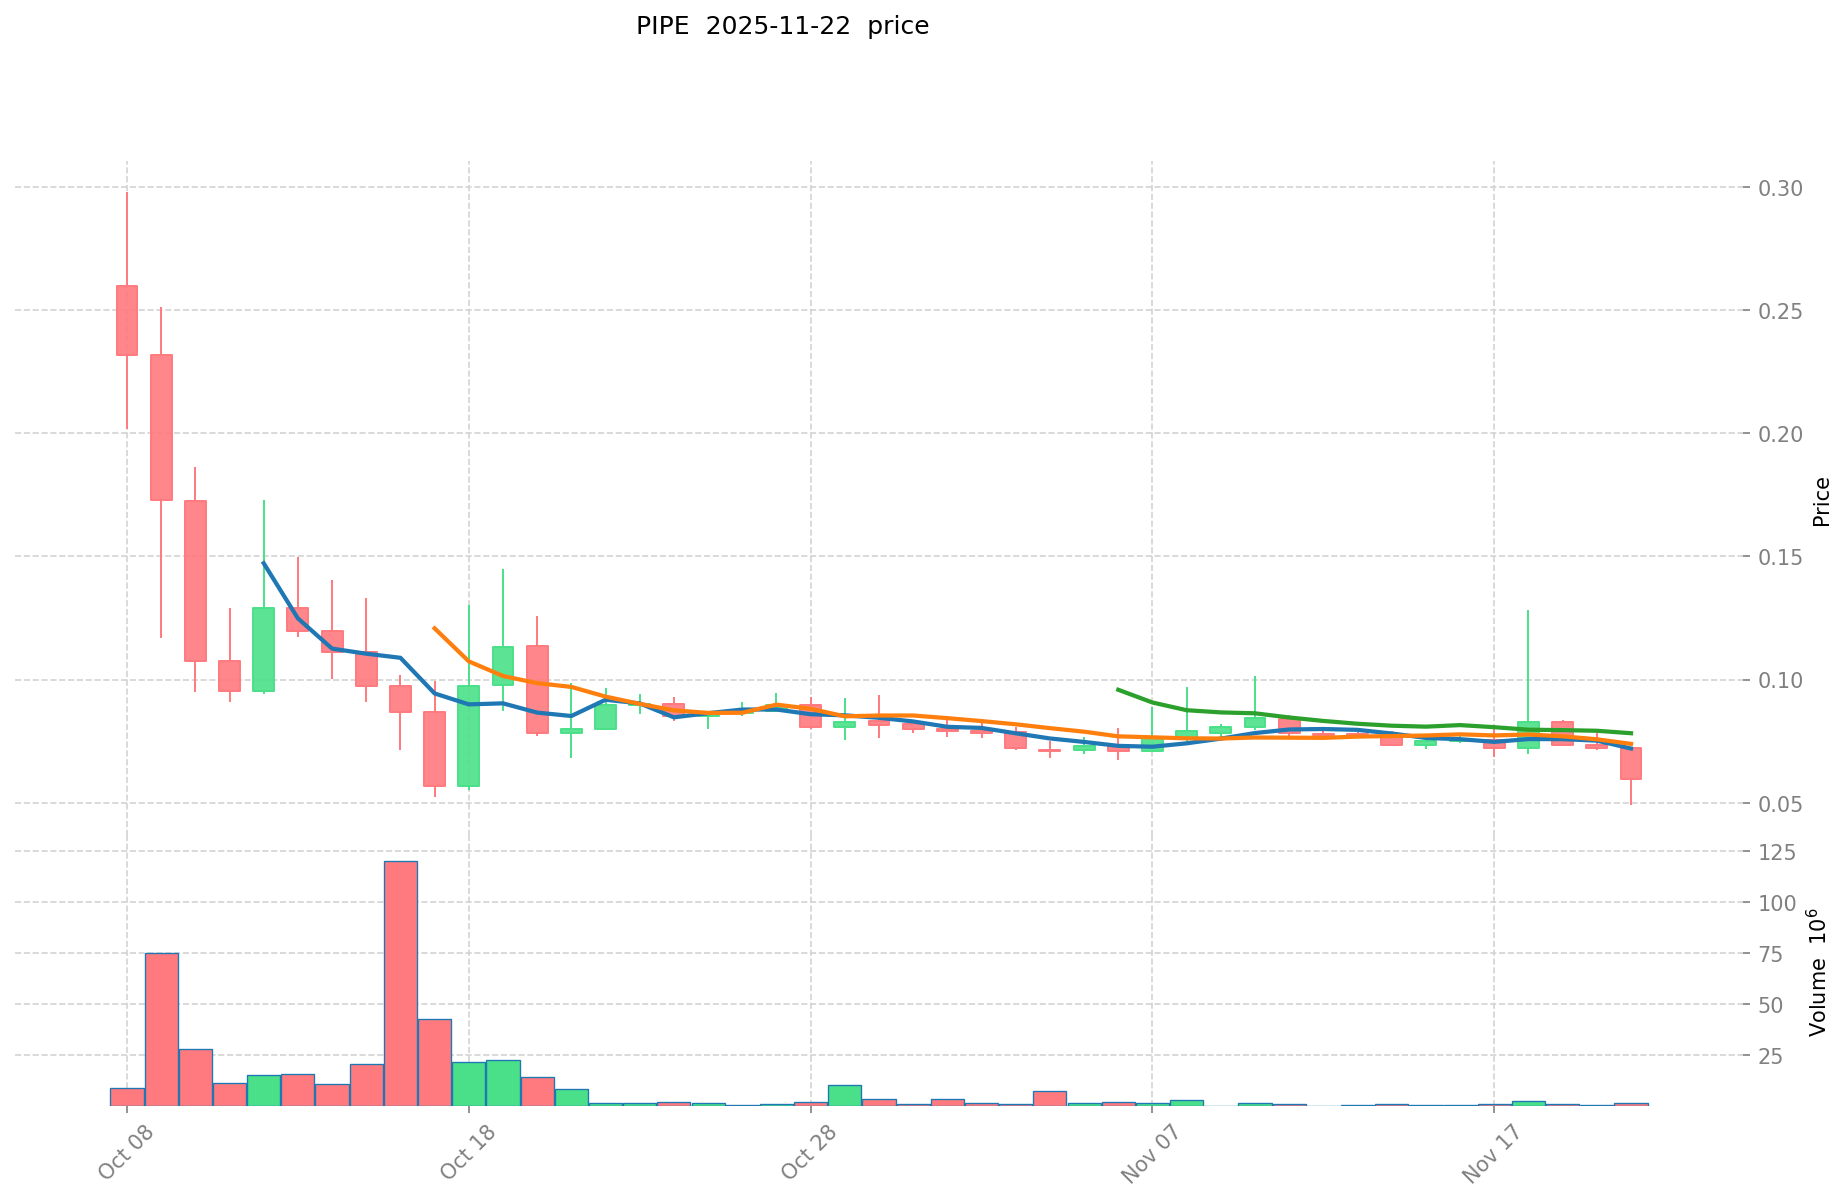
- 2025: PIPE reached its all-time high of $0.29802 on October 8, 2025.
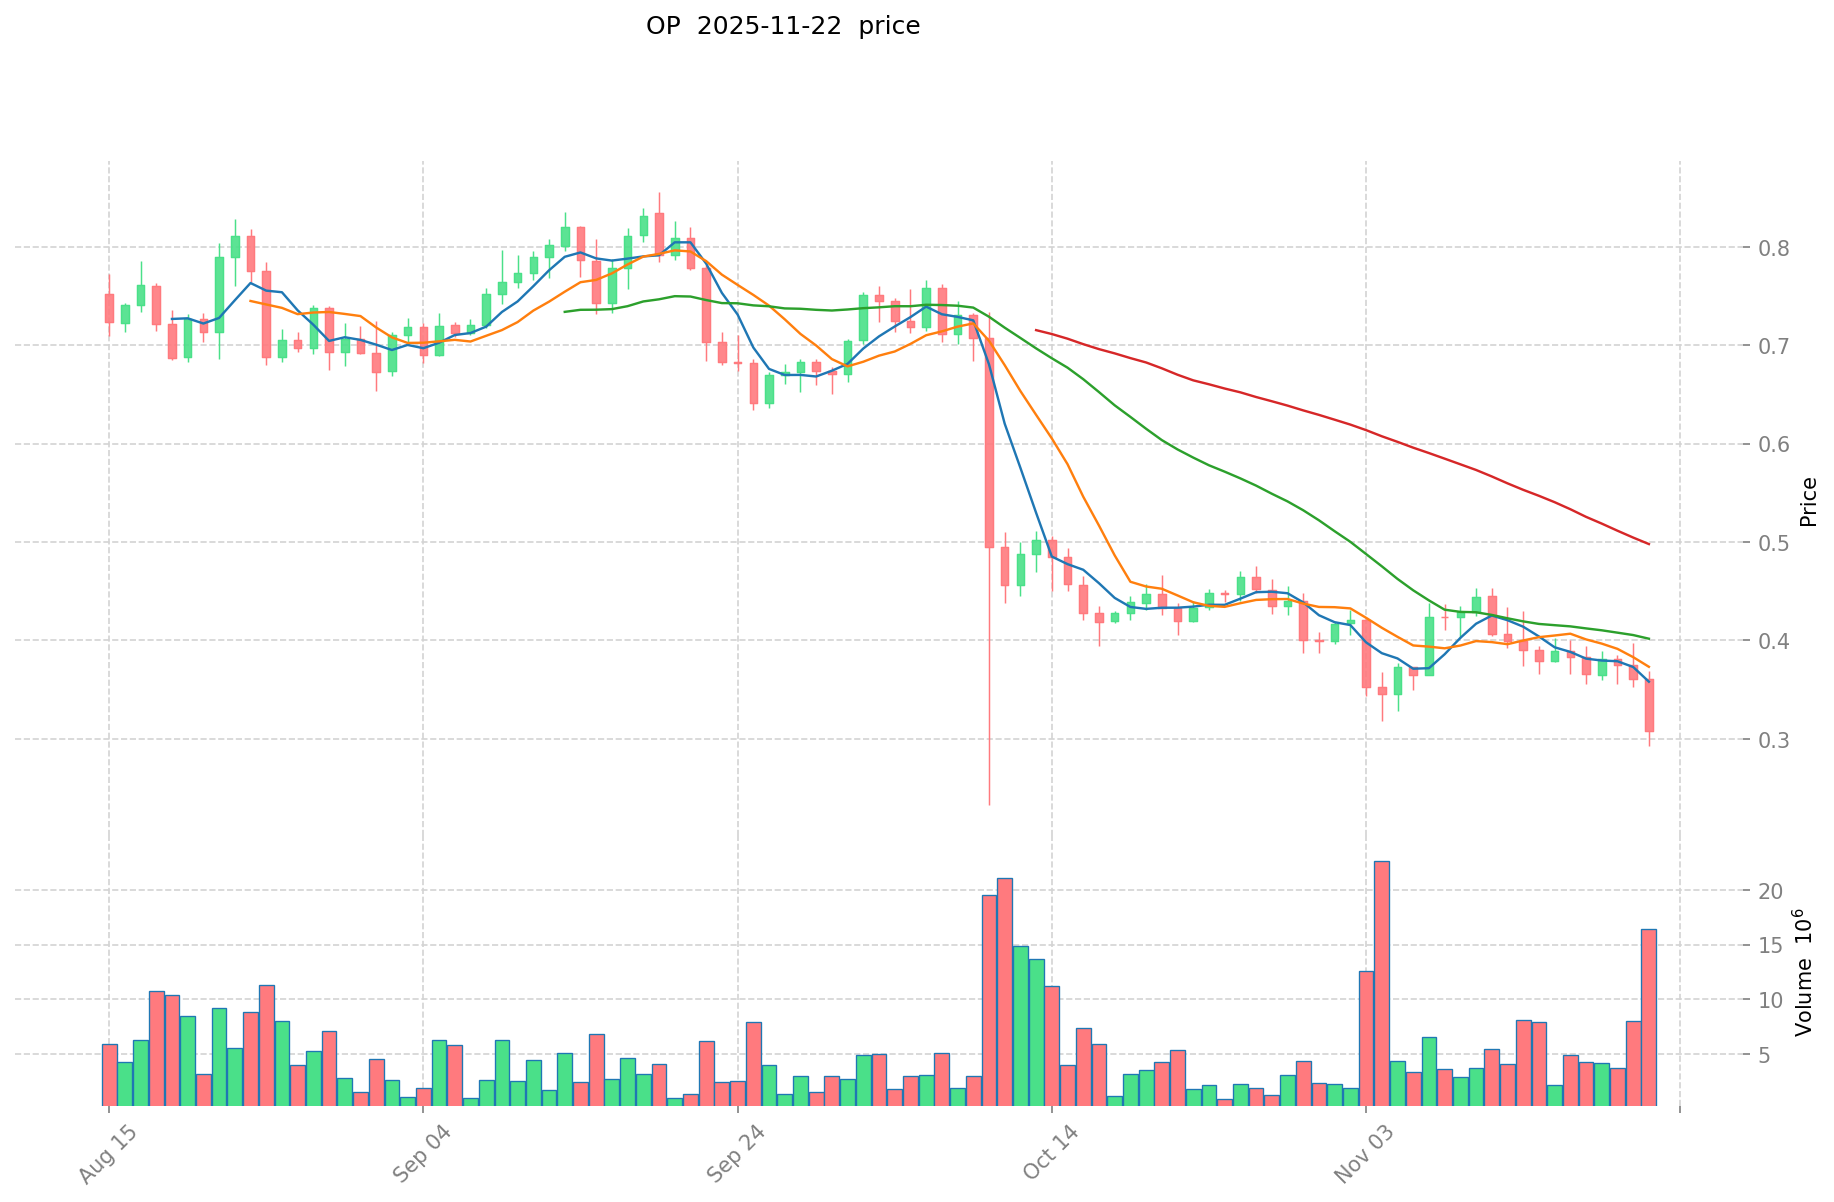
- 2025: OP experienced a significant decline, dropping to its all-time low of $0.294603 on November 22, 2025.
- Comparative analysis: In the recent market cycle, PIPE dropped from its high of $0.29802 to a low of $0.04891, while OP fell from its all-time high of $4.84 to its current price near its all-time low.
Current Market Situation (2025-11-22)
- PIPE current price: $0.06165
- OP current price: $0.2952
- 24-hour trading volume: PIPE $82,056.10 vs OP $5,144,289.33
- Market Sentiment Index (Fear & Greed Index): 11 (Extreme Fear)
Click to view real-time prices:
- View PIPE current price Market Price
- View OP current price Market Price
II. Core Factors Affecting PIPE vs OP Investment Value
Supply Mechanisms Comparison (Tokenomics)
- PIPE: Initial distribution of 2 billion tokens; 51% allocated to the community, 17% to core contributors, 27% to investors, 5% to foundation
- OP: Fixed supply of 4.29 billion tokens; 25.4% allocated to governance fund, 19% to Optimism Foundation, 20% to core contributors, 17% to investors, 19% to ecosystem fund
- 📌 Historical pattern: Supply mechanisms of OP tend to drive more sustainable price movement as it has a fixed maximum supply, while PIPE's distribution model supports broader community engagement.
Institutional Adoption and Market Applications
- Institutional holdings: OP appears to have stronger institutional support through Optimism's established partnerships and ecosystem participants
- Enterprise adoption: OP has gained significant traction in Ethereum scaling solutions for enterprise applications, while PIPE is positioning itself in the content creation and social token space
- Regulatory attitudes: Both tokens operate within the broader regulatory framework for layer-2 solutions, with no specific regulatory distinctions between them noted
Technical Development and Ecosystem Building
- PIPE technical upgrades: Focus on creator economy integrations, token-gated content, and scalable community governance mechanisms
- OP technical development: Continuous improvement of OP Stack technology, implementation of fault proofs, and advancements in the modular blockchain architecture
- Ecosystem comparison: OP has a more established DeFi ecosystem with numerous applications already deployed, while PIPE is building out specialized use cases for content creation and community governance
Macroeconomic and Market Cycles
- Inflation environment performance: Both tokens are relatively new and have limited historical data to evaluate their performance during different inflationary environments
- Macroeconomic monetary policy: As layer-2 solutions, both are affected by broader crypto market trends which correlate with monetary policy changes
- Geopolitical factors: Cross-border transaction demands favor scalable layer-2 solutions, potentially benefiting both tokens in different use cases
III. 2025-2030 Price Prediction: PIPE vs OP
Short-term Prediction (2025)
- PIPE: Conservative $0.0400725 - $0.06165 | Optimistic $0.06165 - $0.0819945
- OP: Conservative $0.208527 - $0.2937 | Optimistic $0.2937 - $0.328944
Mid-term Prediction (2027)
- PIPE may enter a growth phase, with expected prices $0.058642867125 - $0.109852131375
- OP may enter a consolidation phase, with expected prices $0.301359696 - $0.3993015972
- Key drivers: Institutional capital inflow, ETFs, ecosystem development
Long-term Prediction (2030)
- PIPE: Base scenario $0.1205492511033 - $0.135015161235696 | Optimistic scenario $0.135015161235696+
- OP: Base scenario $0.52735102717869 - $0.754111968865526 | Optimistic scenario $0.754111968865526+
Disclaimer: The above predictions are based on historical data and market analysis. Cryptocurrency markets are highly volatile and unpredictable. These projections should not be considered as financial advice. Always conduct your own research before making investment decisions.
PIPE:
| 年份 | 预测最高价 | 预测平均价格 | 预测最低价 | 涨跌幅 |
|---|---|---|---|---|
| 2025 | 0.0819945 | 0.06165 | 0.0400725 | 0 |
| 2026 | 0.093368925 | 0.07182225 | 0.04883913 | 16 |
| 2027 | 0.109852131375 | 0.0825955875 | 0.058642867125 | 33 |
| 2028 | 0.1270154944575 | 0.0962238594375 | 0.058696554256875 | 56 |
| 2029 | 0.1294788252591 | 0.1116196769475 | 0.1026901027917 | 81 |
| 2030 | 0.135015161235696 | 0.1205492511033 | 0.083178983261277 | 95 |
OP:
| 年份 | 预测最高价 | 预测平均价格 | 预测最低价 | 涨跌幅 |
|---|---|---|---|---|
| 2025 | 0.328944 | 0.2937 | 0.208527 | 0 |
| 2026 | 0.44207724 | 0.311322 | 0.26151048 | 5 |
| 2027 | 0.3993015972 | 0.37669962 | 0.301359696 | 27 |
| 2028 | 0.566480888556 | 0.3880006086 | 0.29100045645 | 31 |
| 2029 | 0.57746130577938 | 0.477240748578 | 0.30066167160414 | 61 |
| 2030 | 0.754111968865526 | 0.52735102717869 | 0.395513270384017 | 78 |
IV. Investment Strategy Comparison: PIPE vs OP
Long-term vs Short-term Investment Strategies
- PIPE: Suitable for investors focusing on content creation ecosystems and social token potential
- OP: Suitable for investors seeking established Layer 2 solutions and Ethereum scaling infrastructure
Risk Management and Asset Allocation
- Conservative investors: PIPE: 30% vs OP: 70%
- Aggressive investors: PIPE: 60% vs OP: 40%
- Hedging tools: Stablecoin allocation, options, cross-token portfolio diversification
V. Potential Risk Comparison
Market Risks
- PIPE: Higher volatility due to newer market presence and smaller market cap
- OP: Exposure to broader Ethereum ecosystem fluctuations
Technical Risks
- PIPE: Scalability, network stability in early stages of development
- OP: Potential vulnerabilities in Layer 2 technology, reliance on Ethereum mainnet
Regulatory Risks
- Global regulatory policies may impact both tokens differently, with OP potentially facing more scrutiny due to its larger market presence
VI. Conclusion: Which Is the Better Buy?
📌 Investment Value Summary:
- PIPE advantages: Innovative approach to decentralized cloud infrastructure, potential for growth in content creation and AI sectors
- OP advantages: Established presence in Ethereum scaling solutions, strong institutional support and ecosystem development
✅ Investment Recommendations:
- New investors: Consider a balanced approach with a slight preference for OP due to its more established ecosystem
- Experienced investors: Explore a diversified portfolio including both PIPE and OP, adjusting based on risk tolerance
- Institutional investors: Focus on OP for its institutional adoption and ecosystem maturity, while monitoring PIPE for potential long-term growth opportunities
⚠️ Risk Warning: The cryptocurrency market is highly volatile. This article does not constitute investment advice. None
VII. FAQ
Q1: What are the main differences between PIPE and OP? A: PIPE is a newer project focused on decentralized cloud infrastructure, combining CDN, storage, and AI inference. OP is an established Ethereum Layer 2 scaling solution offering low-cost, high-speed transactions.
Q2: Which token has performed better in recent market conditions? A: PIPE has shown better resilience in recent market conditions. While both tokens have experienced declines, PIPE dropped from its high of $0.29802 to $0.06165, whereas OP fell from its all-time high of $4.84 to near its all-time low of $0.2952.
Q3: How do the supply mechanisms of PIPE and OP differ? A: PIPE has an initial distribution of 2 billion tokens, with 51% allocated to the community. OP has a fixed supply of 4.29 billion tokens, with 25.4% allocated to the governance fund. OP's fixed supply may contribute to more sustainable price movements.
Q4: Which token has stronger institutional support? A: OP appears to have stronger institutional support through Optimism's established partnerships and ecosystem participants. It has gained significant traction in Ethereum scaling solutions for enterprise applications.
Q5: What are the projected price ranges for PIPE and OP in 2030? A: For PIPE, the base scenario projects $0.1205492511033 - $0.135015161235696, with an optimistic scenario above $0.135015161235696. For OP, the base scenario projects $0.52735102717869 - $0.754111968865526, with an optimistic scenario above $0.754111968865526.
Q6: How should investors allocate their portfolio between PIPE and OP? A: Conservative investors might consider allocating 30% to PIPE and 70% to OP, while aggressive investors might allocate 60% to PIPE and 40% to OP. The exact allocation should be based on individual risk tolerance and investment goals.
Q7: What are the primary risks associated with investing in PIPE and OP? A: PIPE faces higher volatility due to its newer market presence and smaller market cap, as well as potential scalability issues. OP is exposed to broader Ethereum ecosystem fluctuations and potential vulnerabilities in Layer 2 technology. Both tokens may be impacted by evolving global regulatory policies.
Share
Content
Introduction: PIPE vs OP Investment Comparison
I. Price History Comparison and Current Market Status
II. Core Factors Affecting PIPE vs OP Investment Value
III. 2025-2030 Price Prediction: PIPE vs OP
IV. Investment Strategy Comparison: PIPE vs OP
V. Potential Risk Comparison
VI. Conclusion: Which Is the Better Buy?
VII. FAQ

