MPT vs BNB: A Comparative Analysis of Two Leading Blockchain Ecosystems
Introduction: MPT vs BNB Investment Comparison
In the cryptocurrency market, the comparison between Miracle Play (MPT) and Binance Coin (BNB) is an unavoidable topic for investors. The two not only show significant differences in market cap ranking, application scenarios, and price performance but also represent different positions in the crypto asset landscape.
Miracle Play (MPT): Launched as an esports online tournament platform built on blockchain technology, allowing users to host and participate in tournaments across various blockchain networks.
Binance Coin (BNB): Since its launch in 2017, BNB has been recognized as a utility token for the Binance ecosystem, becoming one of the cryptocurrencies with the highest global trading volume and market capitalization.
This article will provide a comprehensive analysis of the investment value comparison between MPT and BNB, focusing on historical price trends, supply mechanisms, institutional adoption, technological ecosystems, and future predictions, attempting to answer the question most important to investors:
"Which is the better buy right now?"
I. Price History Comparison and Current Market Status
MPT (Coin A) and BNB (Coin B) Historical Price Trends
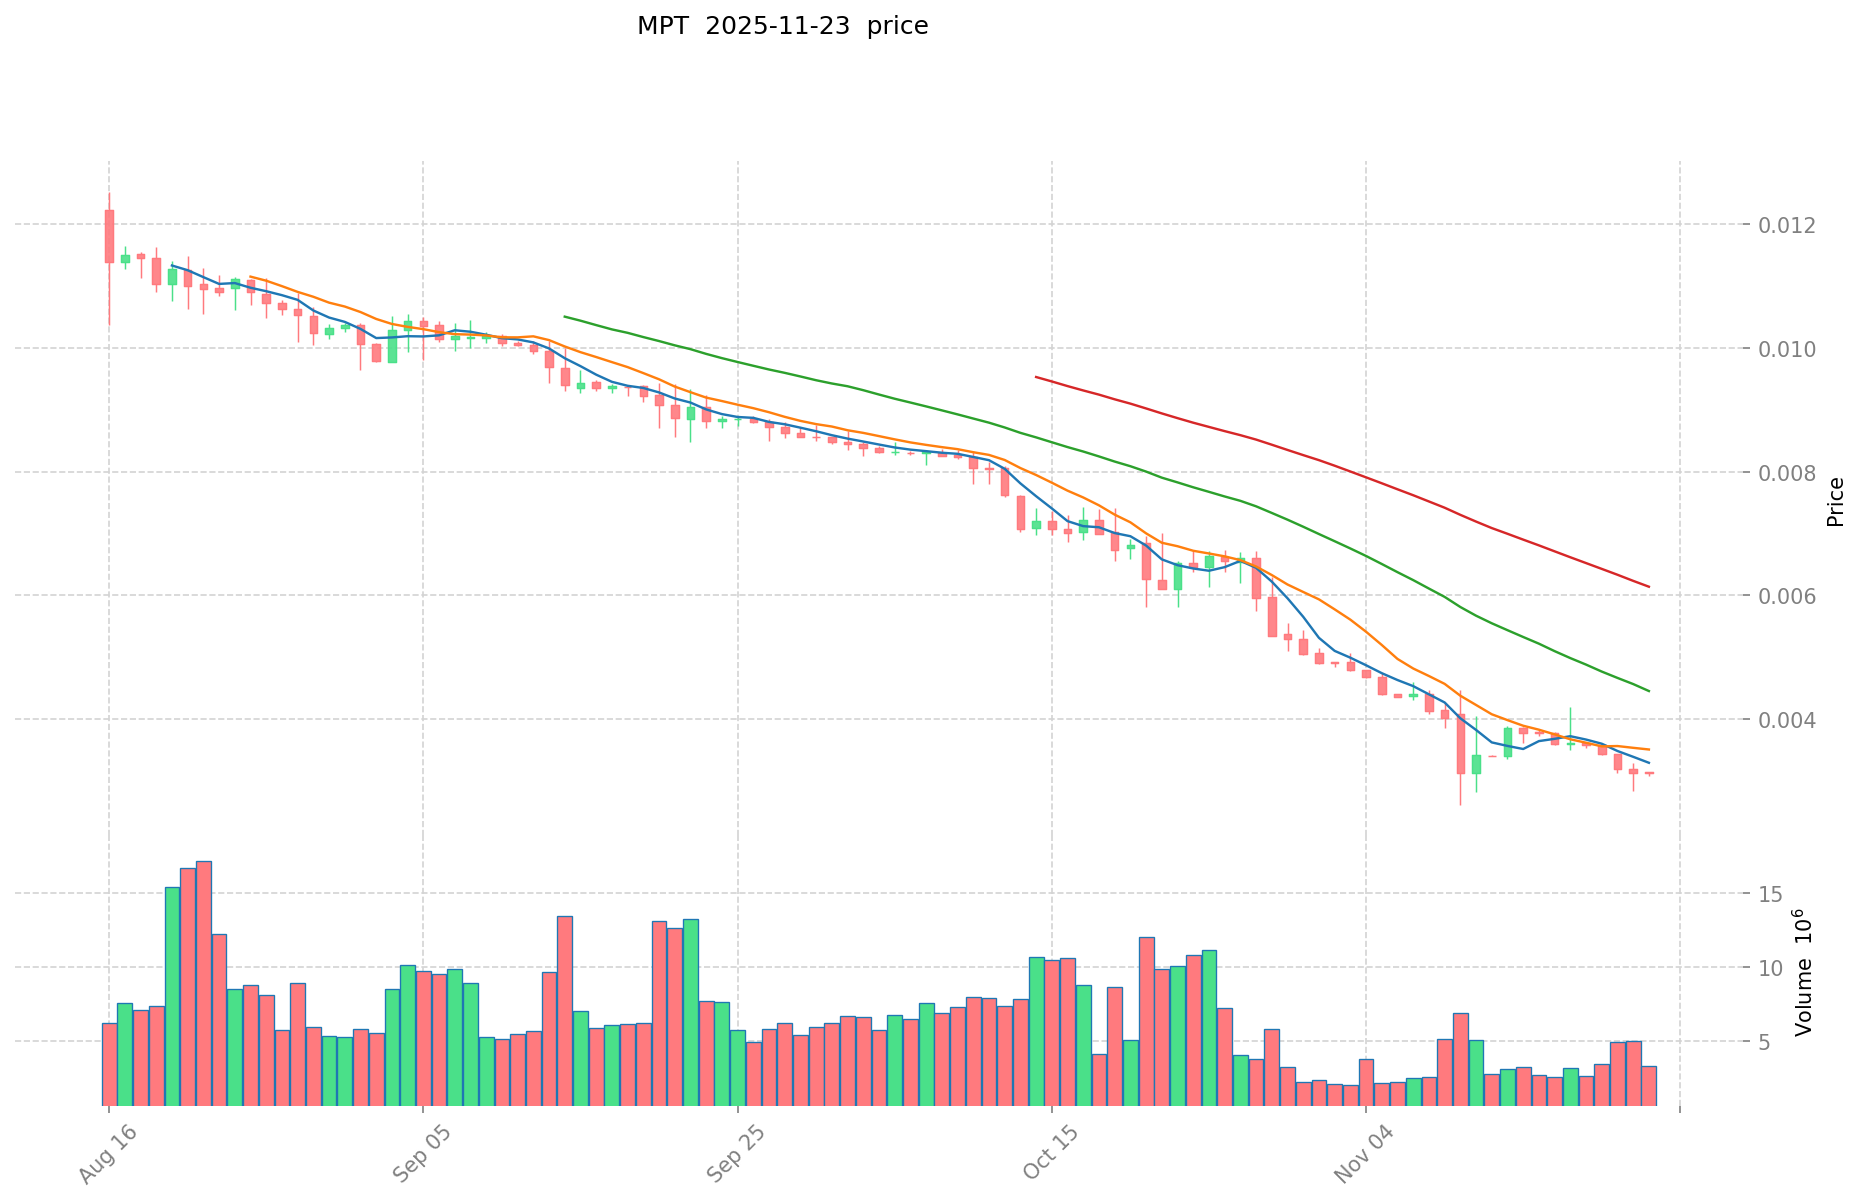
- 2024: MPT reached its all-time high of $0.1313 on April 10, 2024.
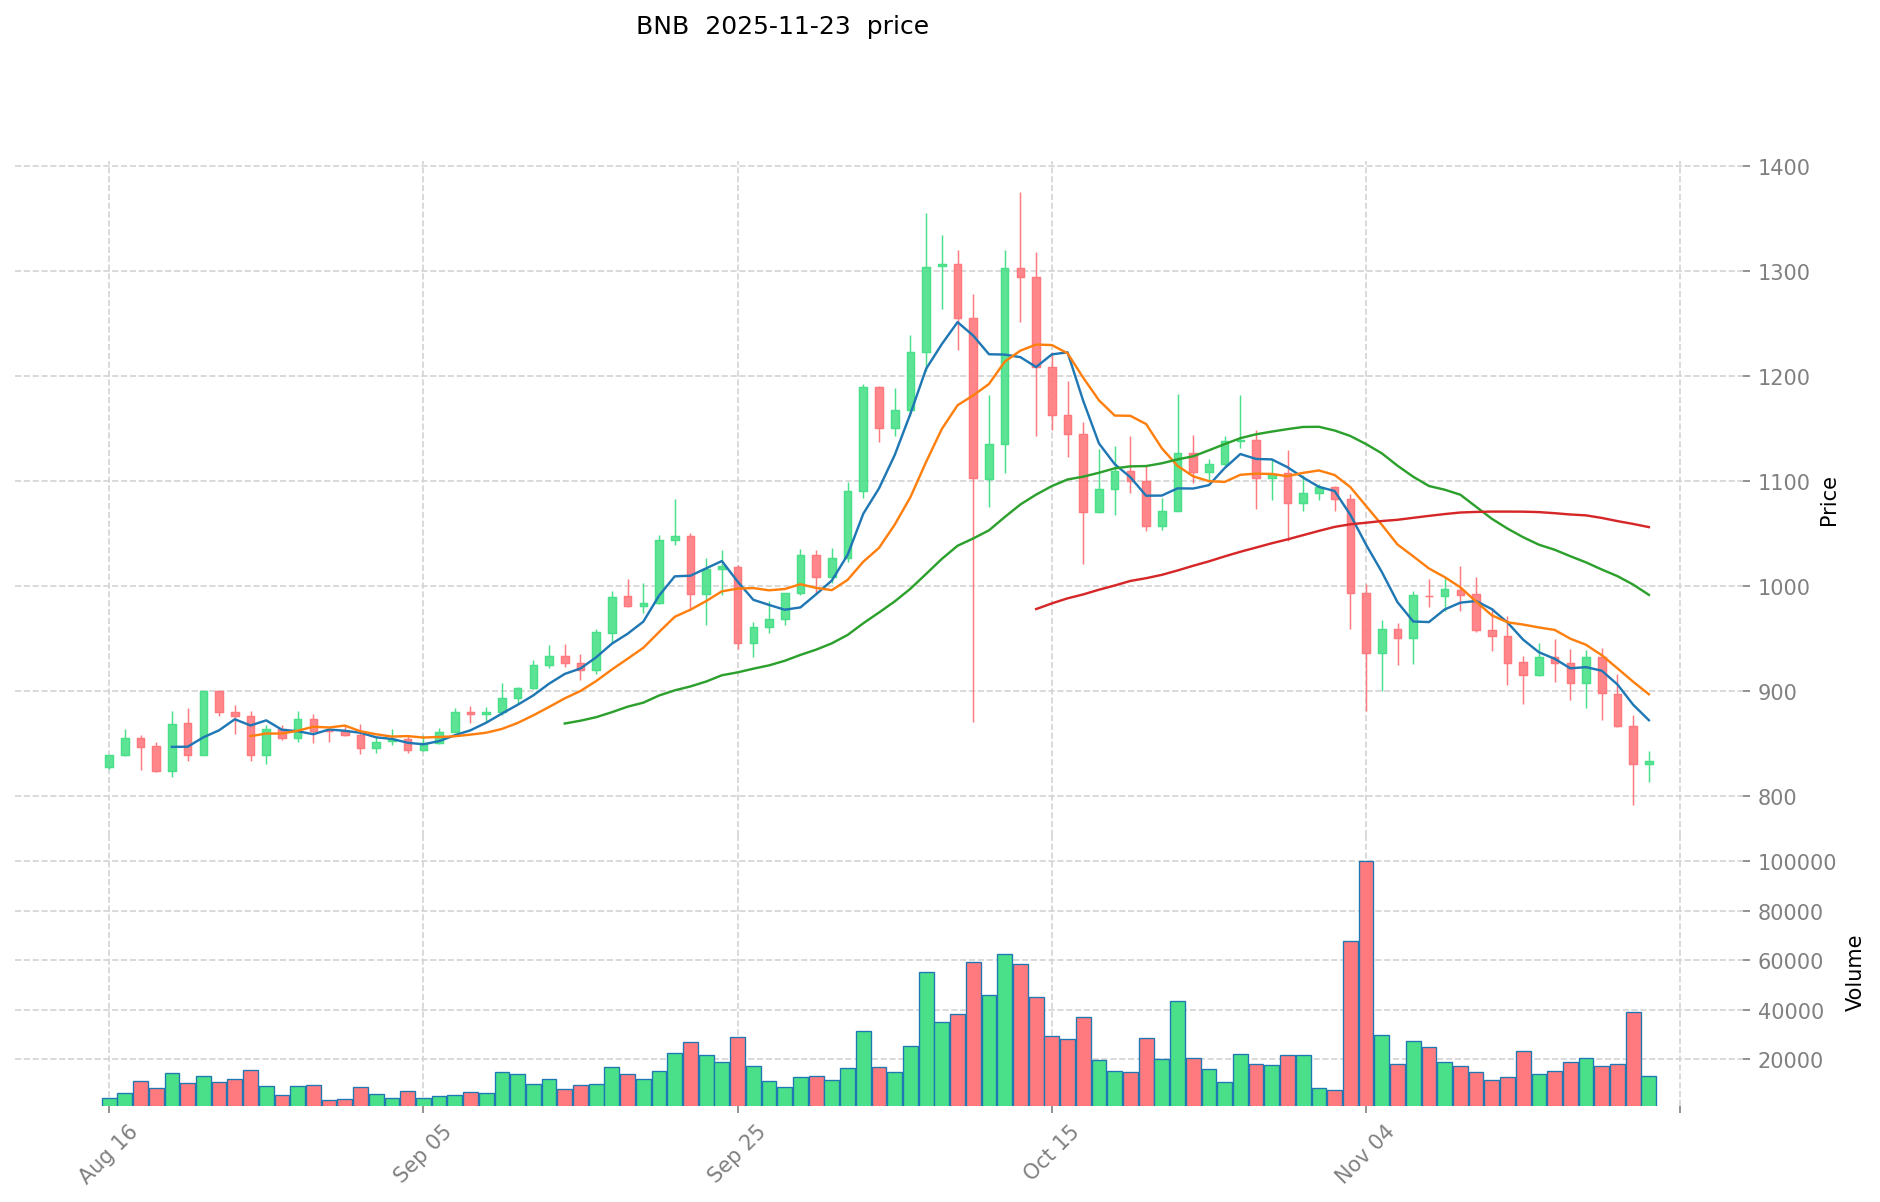
- 2025: BNB hit its all-time high of $1,369.99 on October 13, 2025.
- Comparative analysis: In the current market cycle, MPT has fallen from its high of $0.1313 to a low of $0.0026, while BNB has shown more resilience, currently trading at $843.6.
Current Market Situation (2025-11-23)
- MPT current price: $0.003196
- BNB current price: $843.6
- 24-hour trading volume: MPT $10,381.22 vs BNB $9,225,980.50
- Market Sentiment Index (Fear & Greed Index): 13 (Extreme Fear)
Click to view real-time prices:
- View MPT current price Market Price
- View BNB current price Market Price
II. Core Factors Affecting MPT vs BNB Investment Value
Supply Mechanism Comparison (Tokenomics)
- MPT: Fixed maximum supply of 1 billion tokens, with 25% allocated to the team and foundation
- BNB: Regular token burns that reduce total supply, with quarterly burns based on trading volume on Binance
- 📌 Historical Pattern: Deflationary mechanisms like BNB's token burning have historically supported price stability during market downturns.
Institutional Adoption and Market Applications
- Institutional Holdings: BNB has stronger institutional backing through the Binance ecosystem and corporate treasury allocations
- Enterprise Adoption: BNB has wider application in the Binance ecosystem for fee discounts, while MPT focuses on privacy applications
- Regulatory Attitudes: BNB faces regulatory scrutiny in several jurisdictions due to its connection with Binance, while privacy-focused MPT may encounter regulatory challenges related to AML/KYC requirements
Technical Development and Ecosystem Building
- MPT Technical Upgrades: Focus on privacy-enhancing features and cross-chain interoperability
- BNB Technical Development: Continuous improvement of the BNB Smart Chain with regular updates to enhance throughput and security
- Ecosystem Comparison: BNB has a significantly larger ecosystem spanning DeFi, NFTs, gaming and enterprise applications, while MPT is building its ecosystem with emphasis on privacy-focused applications
Macroeconomic Factors and Market Cycles
- Performance in Inflationary Environments: BNB's deflationary mechanism provides better hedge against inflation
- Macroeconomic Monetary Policy: Interest rate hikes tend to negatively impact both assets, though BNB shows more resilience due to utility value
- Geopolitical Factors: Increased regulatory pressure on centralized exchanges could impact BNB, while growing privacy concerns may benefit MPT
III. 2025-2030 Price Prediction: MPT vs BNB
Short-term Prediction (2025)
- MPT: Conservative $0.00274856 - $0.003196 | Optimistic $0.003196 - $0.00437852
- BNB: Conservative $600.66 - $846 | Optimistic $846 - $1108.26
Mid-term Prediction (2027)
- MPT may enter a growth phase, with projected prices of $0.00370583391 - $0.005344202586
- BNB may enter a bullish market, with projected prices of $922.3618635 - $1335.834423
- Key drivers: Institutional capital inflow, ETF, ecosystem development
Long-term Prediction (2030)
- MPT: Base scenario $0.005709414955879 - $0.007250956993966 | Optimistic scenario $0.007250956993966+
- BNB: Base scenario $1377.83157299865 - $1432.944835918596 | Optimistic scenario $1432.944835918596+
Disclaimer: The above predictions are based on historical data and market analysis. Cryptocurrency markets are highly volatile and subject to change. This information should not be considered as financial advice. Always conduct your own research before making investment decisions.
MPT:
| 年份 | 预测最高价 | 预测平均价格 | 预测最低价 | 涨跌幅 |
|---|---|---|---|---|
| 2025 | 0.00437852 | 0.003196 | 0.00274856 | 0 |
| 2026 | 0.0040144956 | 0.00378726 | 0.0023859738 | 18 |
| 2027 | 0.005344202586 | 0.0039008778 | 0.00370583391 | 22 |
| 2028 | 0.00651778167213 | 0.004622540193 | 0.00429896237949 | 44 |
| 2029 | 0.005848668979193 | 0.005570160932565 | 0.004846040011331 | 74 |
| 2030 | 0.007250956993966 | 0.005709414955879 | 0.003482743123086 | 78 |
BNB:
| 年份 | 预测最高价 | 预测平均价格 | 预测最低价 | 涨跌幅 |
|---|---|---|---|---|
| 2025 | 1108.26 | 846 | 600.66 | 0 |
| 2026 | 1143.2421 | 977.13 | 693.7623 | 15 |
| 2027 | 1335.834423 | 1060.18605 | 922.3618635 | 25 |
| 2028 | 1341.77146488 | 1198.0102365 | 718.8061419 | 42 |
| 2029 | 1485.7722953073 | 1269.89085069 | 977.8159550313 | 50 |
| 2030 | 1432.944835918596 | 1377.83157299865 | 730.2507336892845 | 63 |
IV. Investment Strategy Comparison: MPT vs BNB
Long-term vs Short-term Investment Strategies
- MPT: Suitable for investors focusing on privacy applications and potential ecosystem growth
- BNB: Suitable for investors seeking stability and utility within a large ecosystem
Risk Management and Asset Allocation
- Conservative investors: MPT: 10% vs BNB: 90%
- Aggressive investors: MPT: 30% vs BNB: 70%
- Hedging tools: Stablecoin allocation, options, cross-currency portfolios
V. Potential Risk Comparison
Market Risk
- MPT: High volatility due to lower market cap and trading volume
- BNB: Exposure to overall crypto market sentiment and Binance exchange performance
Technical Risk
- MPT: Scalability, network stability
- BNB: Hash power concentration, security vulnerabilities
Regulatory Risk
- Global regulatory policies may have different impacts on both, with BNB potentially facing more scrutiny due to its association with Binance
VI. Conclusion: Which Is the Better Buy?
📌 Investment Value Summary:
- MPT advantages: Privacy-focused, potential for significant growth in niche market
- BNB advantages: Established ecosystem, deflationary mechanism, wide utility
✅ Investment Advice:
- New investors: Consider a smaller allocation to MPT, larger allocation to BNB for stability
- Experienced investors: Balanced approach, potentially higher allocation to MPT for growth
- Institutional investors: Focus on BNB for liquidity and established market presence
⚠️ Risk Warning: The cryptocurrency market is highly volatile. This article does not constitute investment advice. None
VII. FAQ
Q1: What are the main differences between MPT and BNB? A: MPT is a newer, privacy-focused token with a fixed supply, while BNB is an established utility token for the Binance ecosystem with a deflationary mechanism. BNB has a larger market cap, higher trading volume, and wider adoption.
Q2: Which coin has performed better historically? A: BNB has shown better historical performance and price stability. It reached its all-time high of $1,369.99 in October 2025 and is currently trading at $843.6. MPT, on the other hand, peaked at $0.1313 in April 2024 but has since fallen to $0.003196.
Q3: How do the supply mechanisms of MPT and BNB differ? A: MPT has a fixed maximum supply of 1 billion tokens, with 25% allocated to the team and foundation. BNB implements regular token burns that reduce the total supply, based on quarterly trading volume on Binance.
Q4: What are the key factors affecting the investment value of MPT and BNB? A: Key factors include supply mechanisms, institutional adoption, market applications, technical development, ecosystem building, and macroeconomic factors such as inflation and regulatory environments.
Q5: What are the long-term price predictions for MPT and BNB? A: By 2030, MPT is predicted to reach between $0.005709414955879 and $0.007250956993966 in a base scenario. BNB is expected to reach between $1377.83157299865 and $1432.944835918596 in a base scenario.
Q6: How should investors allocate their assets between MPT and BNB? A: Conservative investors might consider allocating 10% to MPT and 90% to BNB, while aggressive investors might opt for 30% MPT and 70% BNB. The exact allocation depends on individual risk tolerance and investment goals.
Q7: What are the main risks associated with investing in MPT and BNB? A: Both face market risks due to crypto volatility. MPT has higher volatility due to its lower market cap. BNB faces potential regulatory scrutiny due to its association with Binance. Technical risks include scalability for MPT and security vulnerabilities for BNB.
Share
Content
Introduction: MPT vs BNB Investment Comparison
I. Price History Comparison and Current Market Status
II. Core Factors Affecting MPT vs BNB Investment Value
III. 2025-2030 Price Prediction: MPT vs BNB
IV. Investment Strategy Comparison: MPT vs BNB
V. Potential Risk Comparison
VI. Conclusion: Which Is the Better Buy?
VII. FAQ

