MAY vs ETH: The Battle for Crypto Dominance in Decentralized Finance
Introduction: Investment Comparison between MAY and ETH
In the cryptocurrency market, the comparison between Mayflower (MAY) vs Ethereum (ETH) has always been an unavoidable topic for investors. The two not only have significant differences in market cap ranking, application scenarios, and price performance, but also represent different positioning in crypto assets.
Mayflower (MAY): Since its launch, it has gained market recognition for its AI-driven assistant layer that enhances onchain actions and transforms DeFi interactions.
Ethereum (ETH): Since its inception in 2015, it has been hailed as the foundation for decentralized applications and smart contracts, becoming one of the cryptocurrencies with the highest global trading volume and market capitalization.
This article will comprehensively analyze the investment value comparison between MAY and ETH, focusing on historical price trends, supply mechanisms, institutional adoption, technical ecosystems, and future predictions, attempting to answer the question investors care most about:
"Which is the better buy right now?"
I. Price History Comparison and Current Market Status
MAY and ETH Historical Price Trends
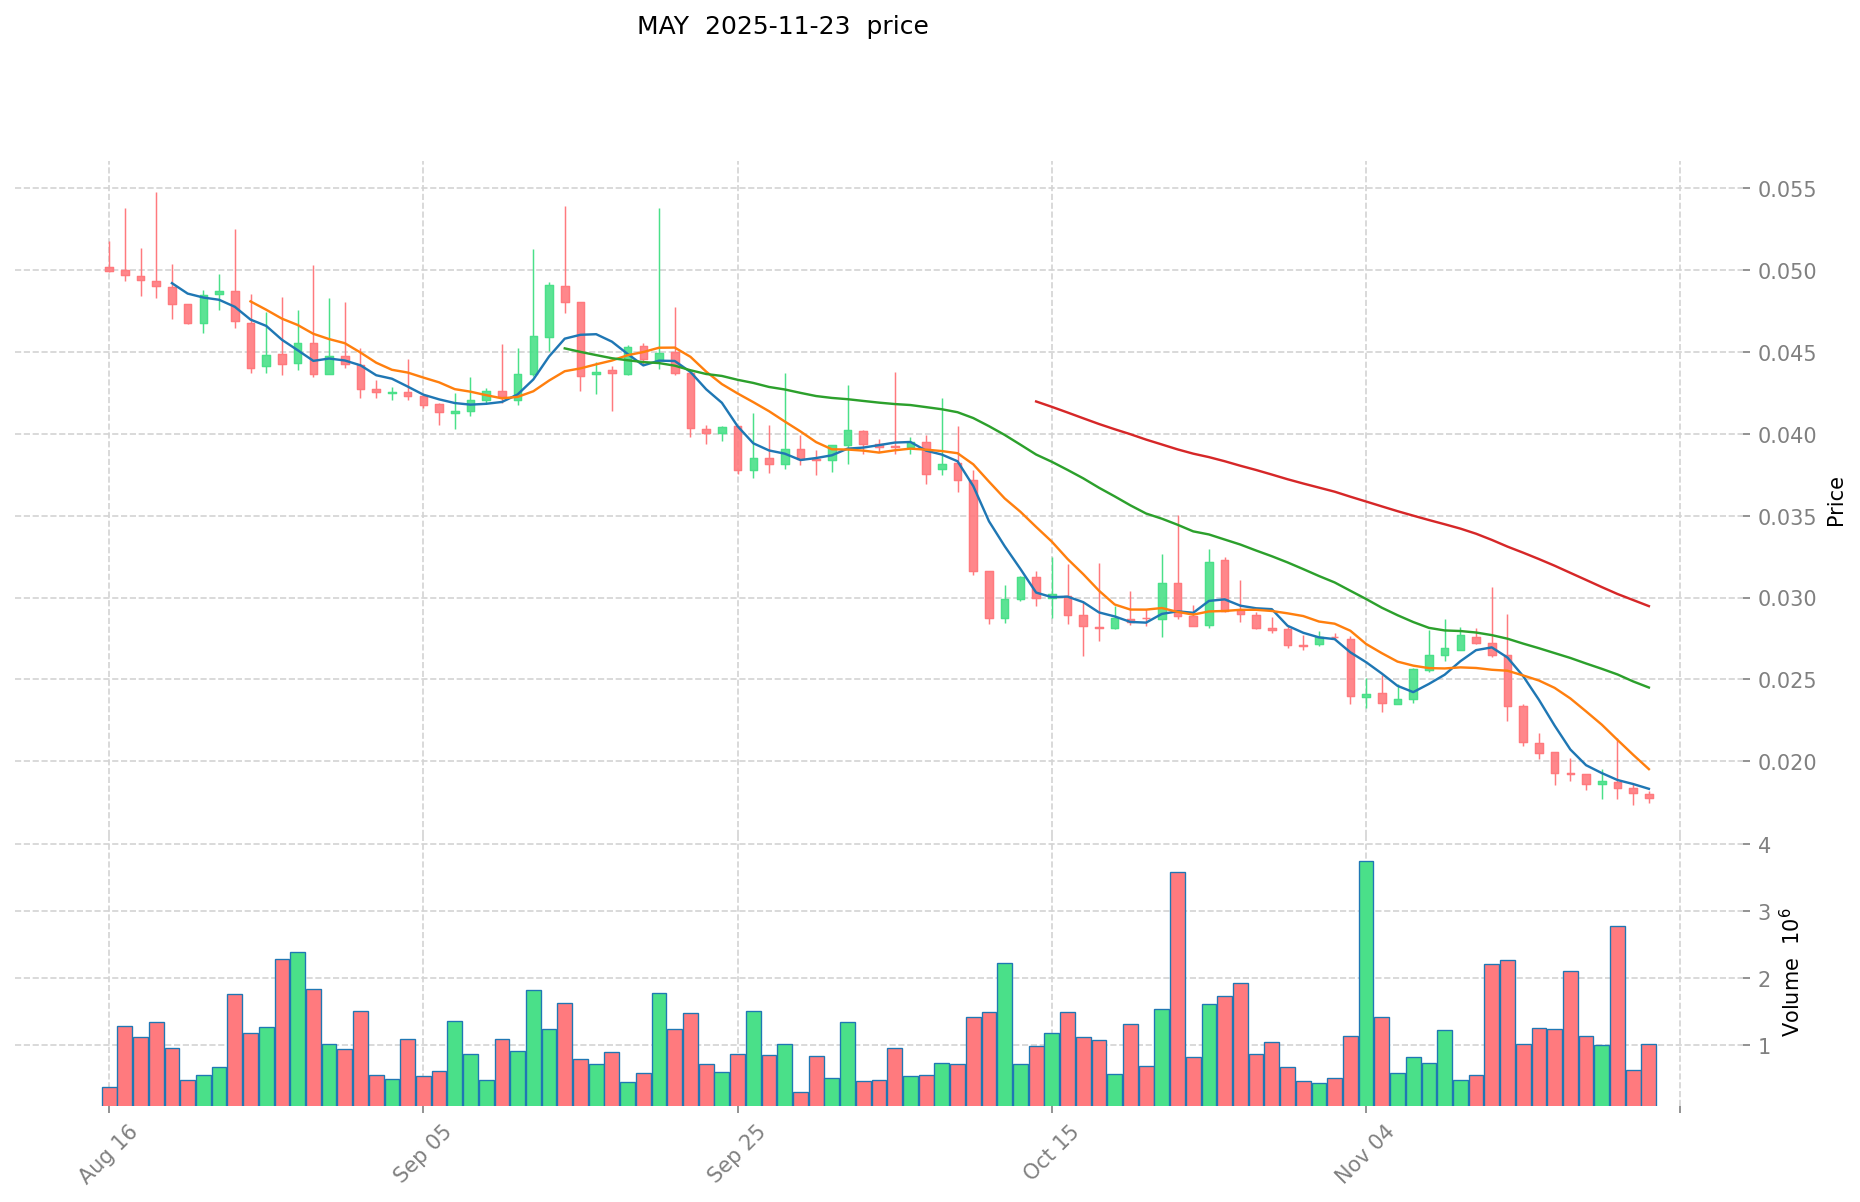
- 2025: MAY reached its all-time high of $0.07318 on July 4, 2025, but has since experienced a significant decline.
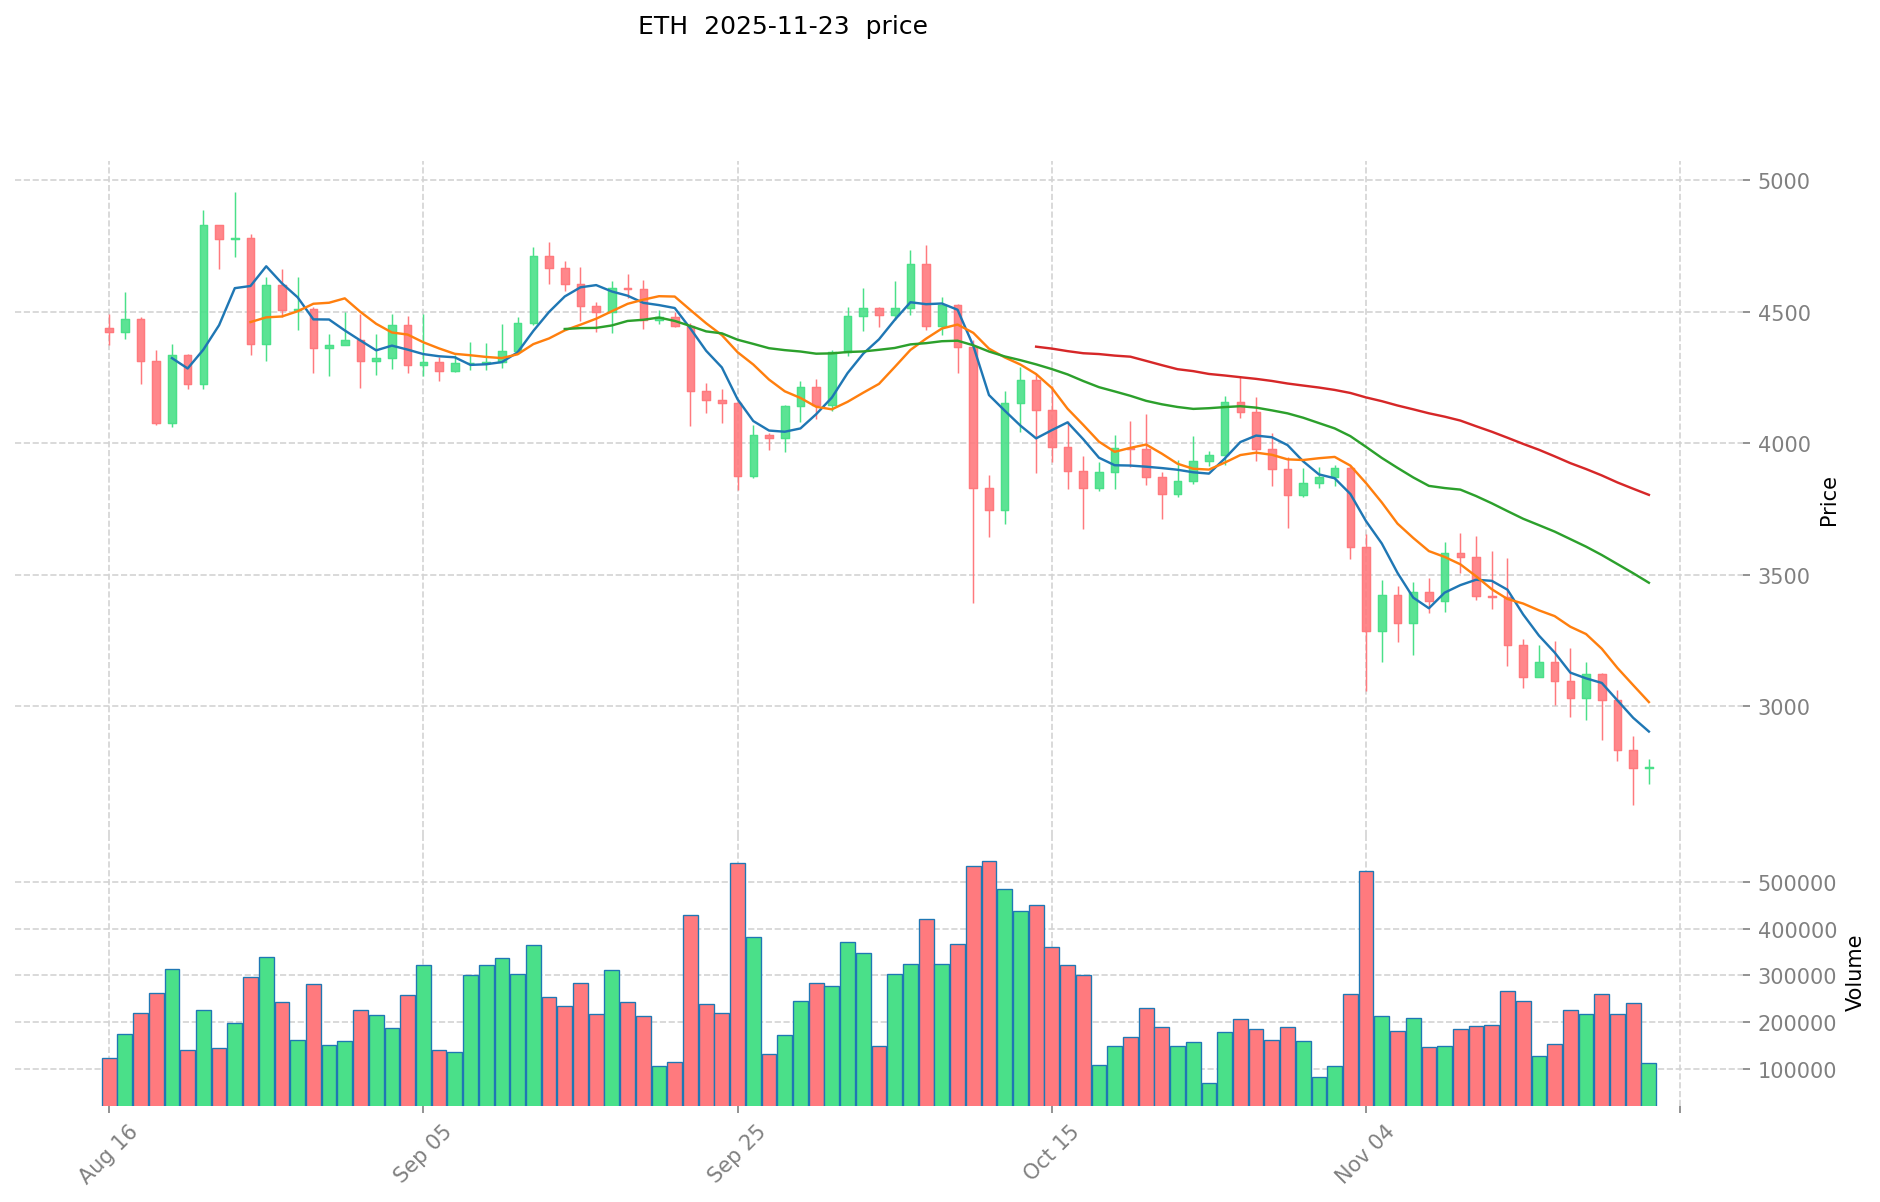
- 2025: ETH achieved a new all-time high of $4,946.05 on August 25, 2025, showcasing strong market performance.
- Comparative Analysis: In the recent market cycle, MAY has dropped from its peak of $0.07318 to a low of $0.01731, while ETH has shown more resilience, maintaining a higher price level despite market fluctuations.
Current Market Situation (2025-11-23)
- MAY current price: $0.01789
- ETH current price: $2,828.14
- 24-hour trading volume: MAY $21,984.50 vs ETH $344,617,212.17
- Market Sentiment Index (Fear & Greed Index): 13 (Extreme Fear)
Click to view real-time prices:
- Check MAY current price Market Price
- Check ETH current price Market Price
II. Core Factors Affecting MAY vs ETH Investment Value
Supply Mechanism Comparison (Tokenomics)
- MAY: Limited total supply of 1 billion tokens with deflationary mechanism through regular token burns
- ETH: Post-EIP-1559 implementation, Ethereum has become deflationary with transaction fee burning mechanism
- 📌 Historical Pattern: Deflationary models have historically created upward price pressure during high network usage periods, with ETH showing stronger correlation between fee burning and price movement due to longer market presence.
Institutional Adoption and Market Applications
- Institutional Holdings: ETH has stronger institutional backing with multiple ETFs and significant corporate treasury holdings, while MAY has limited institutional presence as a newer asset
- Enterprise Adoption: ETH dominates in enterprise blockchain solutions, payment systems and settlement infrastructure; MAY is still developing its commercial applications
- National Policies: ETH faces clearer regulatory frameworks across jurisdictions; MAY's regulatory status remains less defined in most countries
Technical Development and Ecosystem Building
- MAY Technical Upgrades: Focused on scalability improvements and enhanced transaction throughput
- ETH Technical Development: Continued development post-Merge with focus on sharding and layer-2 scaling solutions
- Ecosystem Comparison: ETH maintains dominant position in DeFi (~$20B+ TVL), NFTs, and dApps ecosystem; MAY ecosystem is earlier in development with fewer active projects and lower TVL
Macroeconomic Factors and Market Cycles
- Performance During Inflation: ETH has demonstrated moderate inflation-resistant properties, though less than BTC; MAY lacks sufficient historical data to evaluate
- Macroeconomic Monetary Policy: Both assets show sensitivity to Federal Reserve decisions and dollar strength, with ETH typically displaying higher correlation to traditional market movements
- Geopolitical Factors: ETH has established use cases in cross-border transactions; MAY's utility in international settlement remains theoretical at current adoption levels
III. 2025-2030 Price Prediction: MAY vs ETH
Short-term Prediction (2025)
- MAY: Conservative $0.0139 - $0.0179 | Optimistic $0.0179 - $0.0238
- ETH: Conservative $1,808 - $2,825 | Optimistic $2,825 - $2,966
Mid-term Prediction (2027)
- MAY may enter a growth phase, with an estimated price range of $0.0190 - $0.0238
- ETH may enter a bullish market, with an estimated price range of $2,867 - $3,568
- Key drivers: Institutional capital inflow, ETF, ecosystem development
Long-term Prediction (2030)
- MAY: Base scenario $0.0270 - $0.0325 | Optimistic scenario $0.0325 - $0.0409
- ETH: Base scenario $2,305 - $4,349 | Optimistic scenario $4,349 - $5,045
Disclaimer: The above predictions are based on historical data and market analysis. Cryptocurrency markets are highly volatile and subject to various unpredictable factors. These projections should not be considered as financial advice. Always conduct your own research before making investment decisions.
MAY:
| 年份 | 预测最高价 | 预测平均价格 | 预测最低价 | 涨跌幅 |
|---|---|---|---|---|
| 2025 | 0.0237804 | 0.01788 | 0.0139464 | 0 |
| 2026 | 0.02291322 | 0.0208302 | 0.017497368 | 16 |
| 2027 | 0.0238401639 | 0.02187171 | 0.0190283877 | 22 |
| 2028 | 0.0299412774045 | 0.02285593695 | 0.0157705964955 | 27 |
| 2029 | 0.038541966478785 | 0.02639860717725 | 0.02428671860307 | 47 |
| 2030 | 0.040912561403302 | 0.032470286828017 | 0.026950338067254 | 81 |
ETH:
| 年份 | 预测最高价 | 预测平均价格 | 预测最低价 | 涨跌幅 |
|---|---|---|---|---|
| 2025 | 2966.3445 | 2825.09 | 1808.0576 | 0 |
| 2026 | 3474.8607 | 2895.71725 | 1824.3018675 | 2 |
| 2027 | 3567.523652 | 3185.288975 | 2866.7600775 | 12 |
| 2028 | 4254.27195501 | 3376.4063135 | 1789.495346155 | 19 |
| 2029 | 4883.6340918464 | 3815.339134255 | 3357.4984381444 | 34 |
| 2030 | 5045.404471138812 | 4349.4866130507 | 2305.227904916871 | 53 |
IV. Investment Strategy Comparison: MAY vs ETH
Long-term vs Short-term Investment Strategies
- MAY: Suitable for investors focused on AI-driven DeFi innovations and ecosystem potential
- ETH: Suitable for investors seeking stability, smart contract functionality, and established ecosystem
Risk Management and Asset Allocation
- Conservative investors: MAY: 5-10% vs ETH: 90-95%
- Aggressive investors: MAY: 20-30% vs ETH: 70-80%
- Hedging tools: Stablecoin allocation, options, cross-currency portfolio
V. Potential Risk Comparison
Market Risk
- MAY: Higher volatility due to lower market cap and liquidity
- ETH: Susceptible to overall crypto market trends and macroeconomic factors
Technical Risk
- MAY: Scalability challenges, network stability concerns
- ETH: Network congestion, gas fee fluctuations
Regulatory Risk
- Global regulatory policies may have differing impacts on both assets, with ETH likely facing more immediate scrutiny due to its larger market presence
VI. Conclusion: Which Is the Better Buy?
📌 Investment Value Summary:
- MAY advantages: AI-driven innovation, potential for high growth, deflationary mechanism
- ETH advantages: Established ecosystem, institutional adoption, proven track record
✅ Investment Advice:
- Novice investors: Consider allocating a larger portion to ETH for stability, with a small exposure to MAY for potential growth
- Experienced investors: Balanced portfolio with both ETH and MAY, adjusting based on risk tolerance
- Institutional investors: Focus on ETH for liquidity and regulatory clarity, consider small MAY allocation for diversification
⚠️ Risk Warning: The cryptocurrency market is highly volatile. This article does not constitute investment advice. None
VII. FAQ
Q1: What are the main differences between MAY and ETH in terms of investment potential? A: MAY is a newer asset focused on AI-driven DeFi innovations with higher growth potential but also higher risk. ETH is a more established cryptocurrency with a larger ecosystem, stronger institutional adoption, and a proven track record, offering more stability but potentially lower growth rates.
Q2: How do the supply mechanisms of MAY and ETH compare? A: MAY has a limited total supply of 1 billion tokens with a deflationary mechanism through regular token burns. ETH, after implementing EIP-1559, has become deflationary with a transaction fee burning mechanism, creating upward price pressure during high network usage periods.
Q3: Which cryptocurrency has better institutional adoption? A: ETH has stronger institutional backing with multiple ETFs and significant corporate treasury holdings. MAY, being a newer asset, has limited institutional presence at this time.
Q4: What are the price predictions for MAY and ETH by 2030? A: For MAY, the base scenario predicts $0.0270 - $0.0325, with an optimistic scenario of $0.0325 - $0.0409. For ETH, the base scenario predicts $2,305 - $4,349, with an optimistic scenario of $4,349 - $5,045. However, these predictions are subject to market volatility and various unpredictable factors.
Q5: How should investors allocate their portfolio between MAY and ETH? A: Conservative investors might consider allocating 5-10% to MAY and 90-95% to ETH. More aggressive investors could allocate 20-30% to MAY and 70-80% to ETH. The exact allocation should be based on individual risk tolerance and investment goals.
Q6: What are the main risks associated with investing in MAY and ETH? A: MAY faces higher volatility due to lower market cap and liquidity, as well as potential scalability challenges. ETH is susceptible to overall crypto market trends, macroeconomic factors, and issues like network congestion and gas fee fluctuations. Both face regulatory risks, with ETH likely to face more immediate scrutiny due to its larger market presence.
Share
Content
Introduction: Investment Comparison between MAY and ETH
I. Price History Comparison and Current Market Status
II. Core Factors Affecting MAY vs ETH Investment Value
III. 2025-2030 Price Prediction: MAY vs ETH
IV. Investment Strategy Comparison: MAY vs ETH
V. Potential Risk Comparison
VI. Conclusion: Which Is the Better Buy?
VII. FAQ

