LVVA vs XTZ: Comparing Two Emerging Blockchain Platforms for Enterprise Solutions
Introduction: LVVA vs XTZ Investment Comparison
In the cryptocurrency market, the comparison between LVVA and XTZ has always been an unavoidable topic for investors. The two not only show significant differences in market cap ranking, application scenarios, and price performance but also represent different positions in crypto assets.
Levva Protocol Token (LVVA): Since its launch, it has gained market recognition for its innovative relayer mechanism and keychain aggregation approach.
Tezos (XTZ): Since its inception in 2017, it has been hailed as a self-amending blockchain platform, and is one of the cryptocurrencies with significant global trading volume and market capitalization.
This article will comprehensively analyze the investment value comparison between LVVA and XTZ, focusing on historical price trends, supply mechanisms, institutional adoption, technological ecosystems, and future predictions, attempting to answer the question that investors are most concerned about:
"Which is the better buy right now?"
I. Price History Comparison and Current Market Status
LVVA and XTZ Historical Price Trends
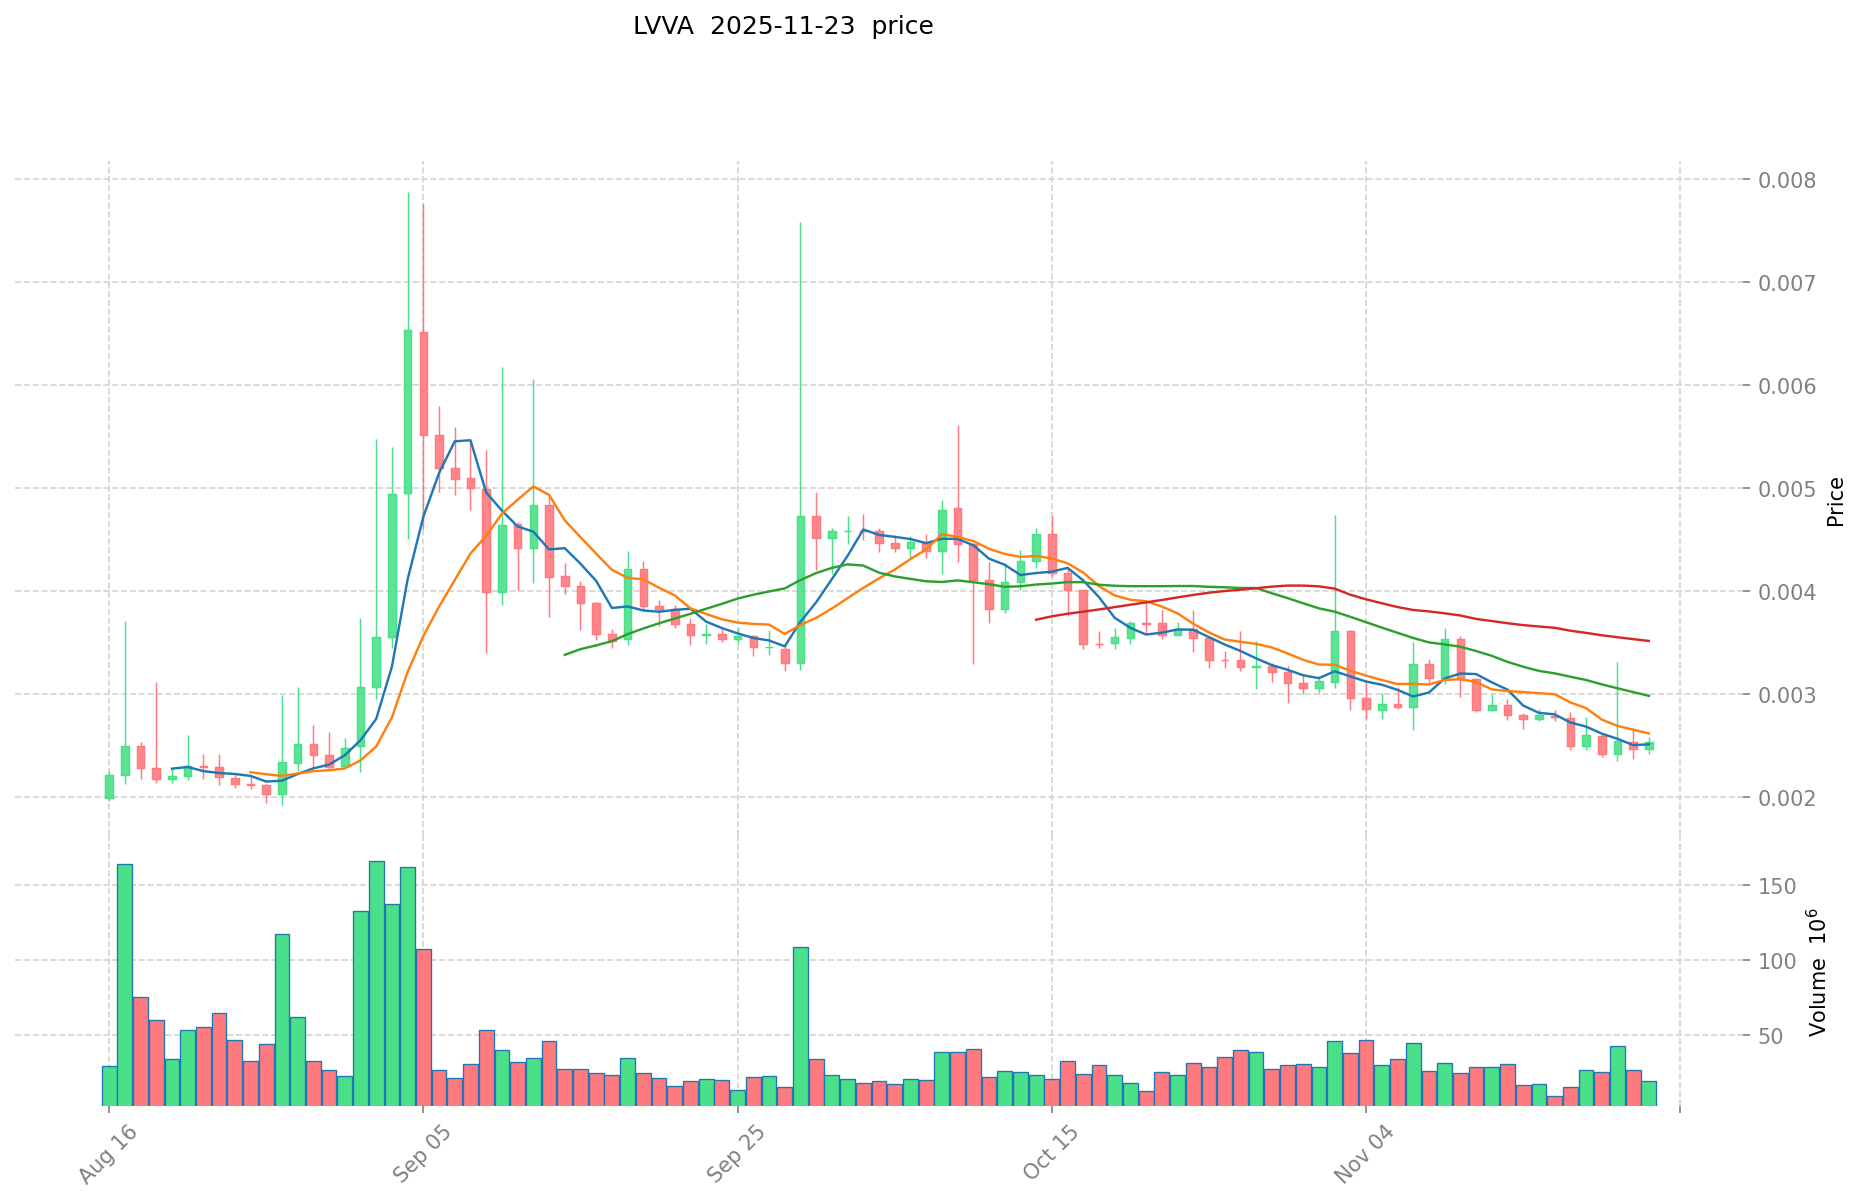
- 2025: LVVA reached its all-time high of $0.016799 on March 14, 2025, followed by a significant drop to its all-time low of $0.001754 on July 7, 2025.
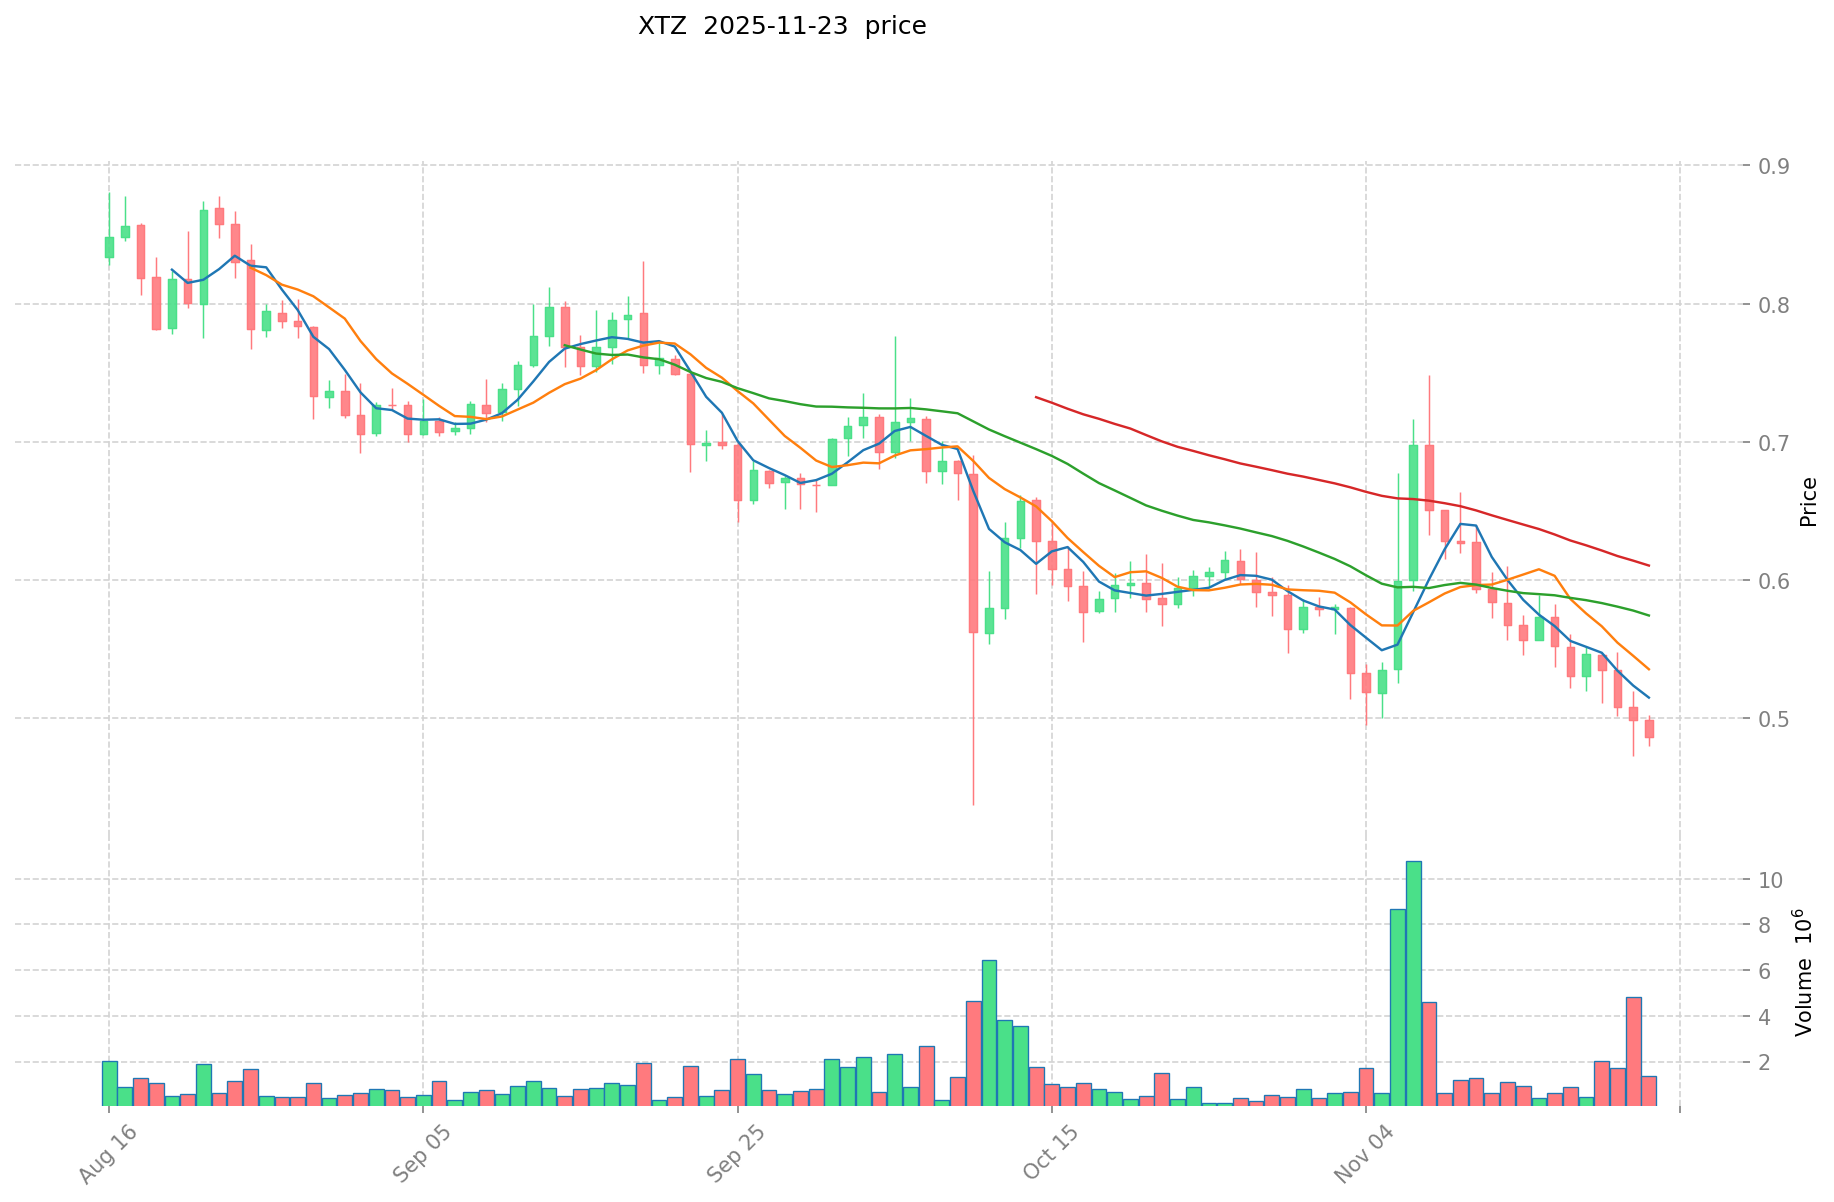
- 2021: XTZ hit its all-time high of $9.12 on October 4, 2021, demonstrating strong growth during the bull market.
- Comparative analysis: In the current market cycle, LVVA has experienced high volatility within a short period in 2025, while XTZ has shown a long-term downtrend from its 2021 peak to the current price levels.
Current Market Situation (2025-11-23)
- LVVA current price: $0.002563
- XTZ current price: $0.4913
- 24-hour trading volume: LVVA $50,333.64 vs XTZ $357,274.26
- Market Sentiment Index (Fear & Greed Index): 13 (Extreme Fear)
Click to view real-time prices:
- View LVVA current price Market Price
- View XTZ current price Market Price
II. Core Factors Affecting LVVA vs XTZ Investment Value
Supply Mechanism Comparison (Tokenomics)
- LVVA: Fixed supply with deflationary model, creating scarcity as demand increases
- XTZ: Inflationary model with baking rewards, balanced by governance-based adjustment mechanisms
- 📌 Historical pattern: Deflationary tokens like LVVA tend to show more price volatility during bull markets, while XTZ's more balanced supply mechanism has provided greater stability in bearish conditions.
Institutional Adoption and Market Applications
- Institutional holdings: XTZ has gained more institutional traction through Tezos Foundation partnerships with major financial institutions
- Enterprise adoption: XTZ leads in enterprise solutions with notable implementations in settlement systems and corporate blockchain infrastructure, while LVVA remains primarily in speculative portfolios
- Regulatory attitudes: XTZ benefits from clearer regulatory standing in European markets, while LVVA faces more uncertain regulatory classification in major jurisdictions
Technical Development and Ecosystem Building
- LVVA technical upgrades: Recent integration of zero-knowledge proofs enhancing privacy features
- XTZ technical development: Continuous improvement through on-chain governance and regular protocol upgrades
- Ecosystem comparison: XTZ has stronger DeFi and NFT ecosystem maturity with established projects, while LVVA shows promising early-stage smart contract implementations but less developed application ecosystem
Macroeconomic Conditions and Market Cycles
- Performance during inflation: XTZ has demonstrated more stability during inflationary periods
- Macroeconomic monetary policy: Rising interest rates have historically put more downward pressure on LVVA compared to XTZ
- Geopolitical factors: XTZ's formal governance structure provides better adaptation mechanisms to changing international regulations
III. 2025-2030 Price Prediction: LVVA vs XTZ
Short-term Prediction (2025)
- LVVA: Conservative $0.00233597 - $0.002567 | Optimistic $0.002567 - $0.00377349
- XTZ: Conservative $0.275016 - $0.4911 | Optimistic $0.4911 - $0.569676
Mid-term Prediction (2027)
- LVVA may enter a growth phase, with an estimated price range of $0.00300459969875 - $0.00526688653075
- XTZ may enter a consolidation phase, with an estimated price range of $0.3282040944 - $0.6816546576
- Key drivers: Institutional capital inflow, ETFs, ecosystem development
Long-term Prediction (2030)
- LVVA: Base scenario $0.002966537040935 - $0.005204450949009 | Optimistic scenario $0.005204450949009 - $0.006193296629321
- XTZ: Base scenario $0.824785914839796 - $0.8502947575668 | Optimistic scenario $0.8502947575668 - $0.952330128474816
Disclaimer: The above predictions are based on historical data and market analysis. Cryptocurrency markets are highly volatile and subject to change. This information should not be considered as financial advice. Always conduct your own research before making investment decisions.
LVVA:
| 年份 | 预测最高价 | 预测平均价格 | 预测最低价 | 涨跌幅 |
|---|---|---|---|---|
| 2025 | 0.00377349 | 0.002567 | 0.00233597 | 0 |
| 2026 | 0.00389940135 | 0.003170245 | 0.001902147 | 23 |
| 2027 | 0.00526688653075 | 0.003534823175 | 0.00300459969875 | 37 |
| 2028 | 0.005237017274921 | 0.004400854852875 | 0.003344649688185 | 71 |
| 2029 | 0.005589965834121 | 0.004818936063898 | 0.004337042457508 | 88 |
| 2030 | 0.006193296629321 | 0.005204450949009 | 0.002966537040935 | 103 |
XTZ:
| 年份 | 预测最高价 | 预测平均价格 | 预测最低价 | 涨跌幅 |
|---|---|---|---|---|
| 2025 | 0.569676 | 0.4911 | 0.275016 | 0 |
| 2026 | 0.73193544 | 0.530388 | 0.41900652 | 7 |
| 2027 | 0.6816546576 | 0.63116172 | 0.3282040944 | 28 |
| 2028 | 0.925535546208 | 0.6564081888 | 0.610459615584 | 33 |
| 2029 | 0.9096176476296 | 0.790971867504 | 0.52995115122768 | 60 |
| 2030 | 0.952330128474816 | 0.8502947575668 | 0.824785914839796 | 73 |
IV. Investment Strategy Comparison: LVVA vs XTZ
Long-term vs Short-term Investment Strategies
- LVVA: Suitable for investors focused on innovative blockchain solutions and potential for high growth
- XTZ: Suitable for investors seeking stability and governance participation
Risk Management and Asset Allocation
- Conservative investors: LVVA: 20% vs XTZ: 80%
- Aggressive investors: LVVA: 60% vs XTZ: 40%
- Hedging tools: Stablecoin allocation, options, cross-currency portfolios
V. Potential Risk Comparison
Market Risk
- LVVA: High volatility and susceptibility to market sentiment
- XTZ: Relatively lower volatility but still subject to overall crypto market trends
Technical Risk
- LVVA: Scalability, network stability
- XTZ: Governance risks, potential smart contract vulnerabilities
Regulatory Risk
- Global regulatory policies may have different impacts on both assets
VI. Conclusion: Which Is the Better Buy?
📌 Investment Value Summary:
- LVVA advantages: Innovative technology, potential for high growth
- XTZ advantages: Established ecosystem, governance features, institutional adoption
✅ Investment Advice:
- New investors: Consider a smaller allocation to LVVA and a larger portion to XTZ for stability
- Experienced investors: Balanced portfolio with both assets, adjusting based on risk tolerance
- Institutional investors: Focus on XTZ for its regulatory clarity and established use cases
⚠️ Risk Warning: The cryptocurrency market is highly volatile. This article does not constitute investment advice. None
VII. FAQ
Q1: What are the main differences between LVVA and XTZ in terms of investment potential? A: LVVA offers innovative technology and high growth potential, while XTZ provides a more established ecosystem, governance features, and institutional adoption. LVVA is more volatile and suitable for risk-tolerant investors, whereas XTZ offers greater stability and is preferred by conservative investors.
Q2: How do the supply mechanisms of LVVA and XTZ differ? A: LVVA has a fixed supply with a deflationary model, creating scarcity as demand increases. XTZ, on the other hand, has an inflationary model with baking rewards, balanced by governance-based adjustment mechanisms.
Q3: Which asset has shown better performance during inflationary periods? A: XTZ has demonstrated more stability during inflationary periods compared to LVVA. Rising interest rates have historically put more downward pressure on LVVA compared to XTZ.
Q4: What are the long-term price predictions for LVVA and XTZ by 2030? A: For LVVA, the base scenario predicts a range of $0.002966537040935 - $0.005204450949009, with an optimistic scenario of $0.005204450949009 - $0.006193296629321. For XTZ, the base scenario predicts a range of $0.824785914839796 - $0.8502947575668, with an optimistic scenario of $0.8502947575668 - $0.952330128474816.
Q5: How do institutional adoption and market applications compare between LVVA and XTZ? A: XTZ has gained more institutional traction through Tezos Foundation partnerships with major financial institutions and leads in enterprise solutions. LVVA remains primarily in speculative portfolios and faces more uncertain regulatory classification in major jurisdictions.
Q6: What are the recommended asset allocations for conservative and aggressive investors? A: For conservative investors, a suggested allocation is 20% LVVA and 80% XTZ. For aggressive investors, a recommended allocation is 60% LVVA and 40% XTZ.
Q7: What are the main risks associated with investing in LVVA and XTZ? A: LVVA faces high volatility, market sentiment risks, scalability issues, and network stability concerns. XTZ has relatively lower volatility but is subject to governance risks, potential smart contract vulnerabilities, and overall crypto market trends. Both assets are exposed to regulatory risks, which may have different impacts on each.
Share
Content
Introduction: LVVA vs XTZ Investment Comparison
I. Price History Comparison and Current Market Status
II. Core Factors Affecting LVVA vs XTZ Investment Value
III. 2025-2030 Price Prediction: LVVA vs XTZ
IV. Investment Strategy Comparison: LVVA vs XTZ
V. Potential Risk Comparison
VI. Conclusion: Which Is the Better Buy?
VII. FAQ

