LOBO vs OP: The Ultimate Showdown Between Lone Wolf and Overpowered Heroes
Introduction: LOBO vs OP Investment Comparison
In the cryptocurrency market, the comparison between LOBO vs OP has always been an unavoidable topic for investors. The two not only show significant differences in market cap ranking, application scenarios, and price performance, but also represent different crypto asset positioning.
LOBO (LOBO): Launched as a meme coin on Bitcoin's Runes Protocol, it has gained market recognition as one of the top 10 runes (Rune #9) since its inception.
Optimism (OP): Since its launch in 2022, it has been hailed as a low-cost, lightning-fast Ethereum Layer 2 blockchain, addressing the practical needs of developers and users.
This article will provide a comprehensive analysis of the investment value comparison between LOBO vs OP, focusing on historical price trends, supply mechanisms, institutional adoption, technological ecosystems, and future predictions, attempting to answer the question investors care most about:
"Which is the better buy right now?"
I. Price History Comparison and Current Market Status
LOBO and OP Historical Price Trends
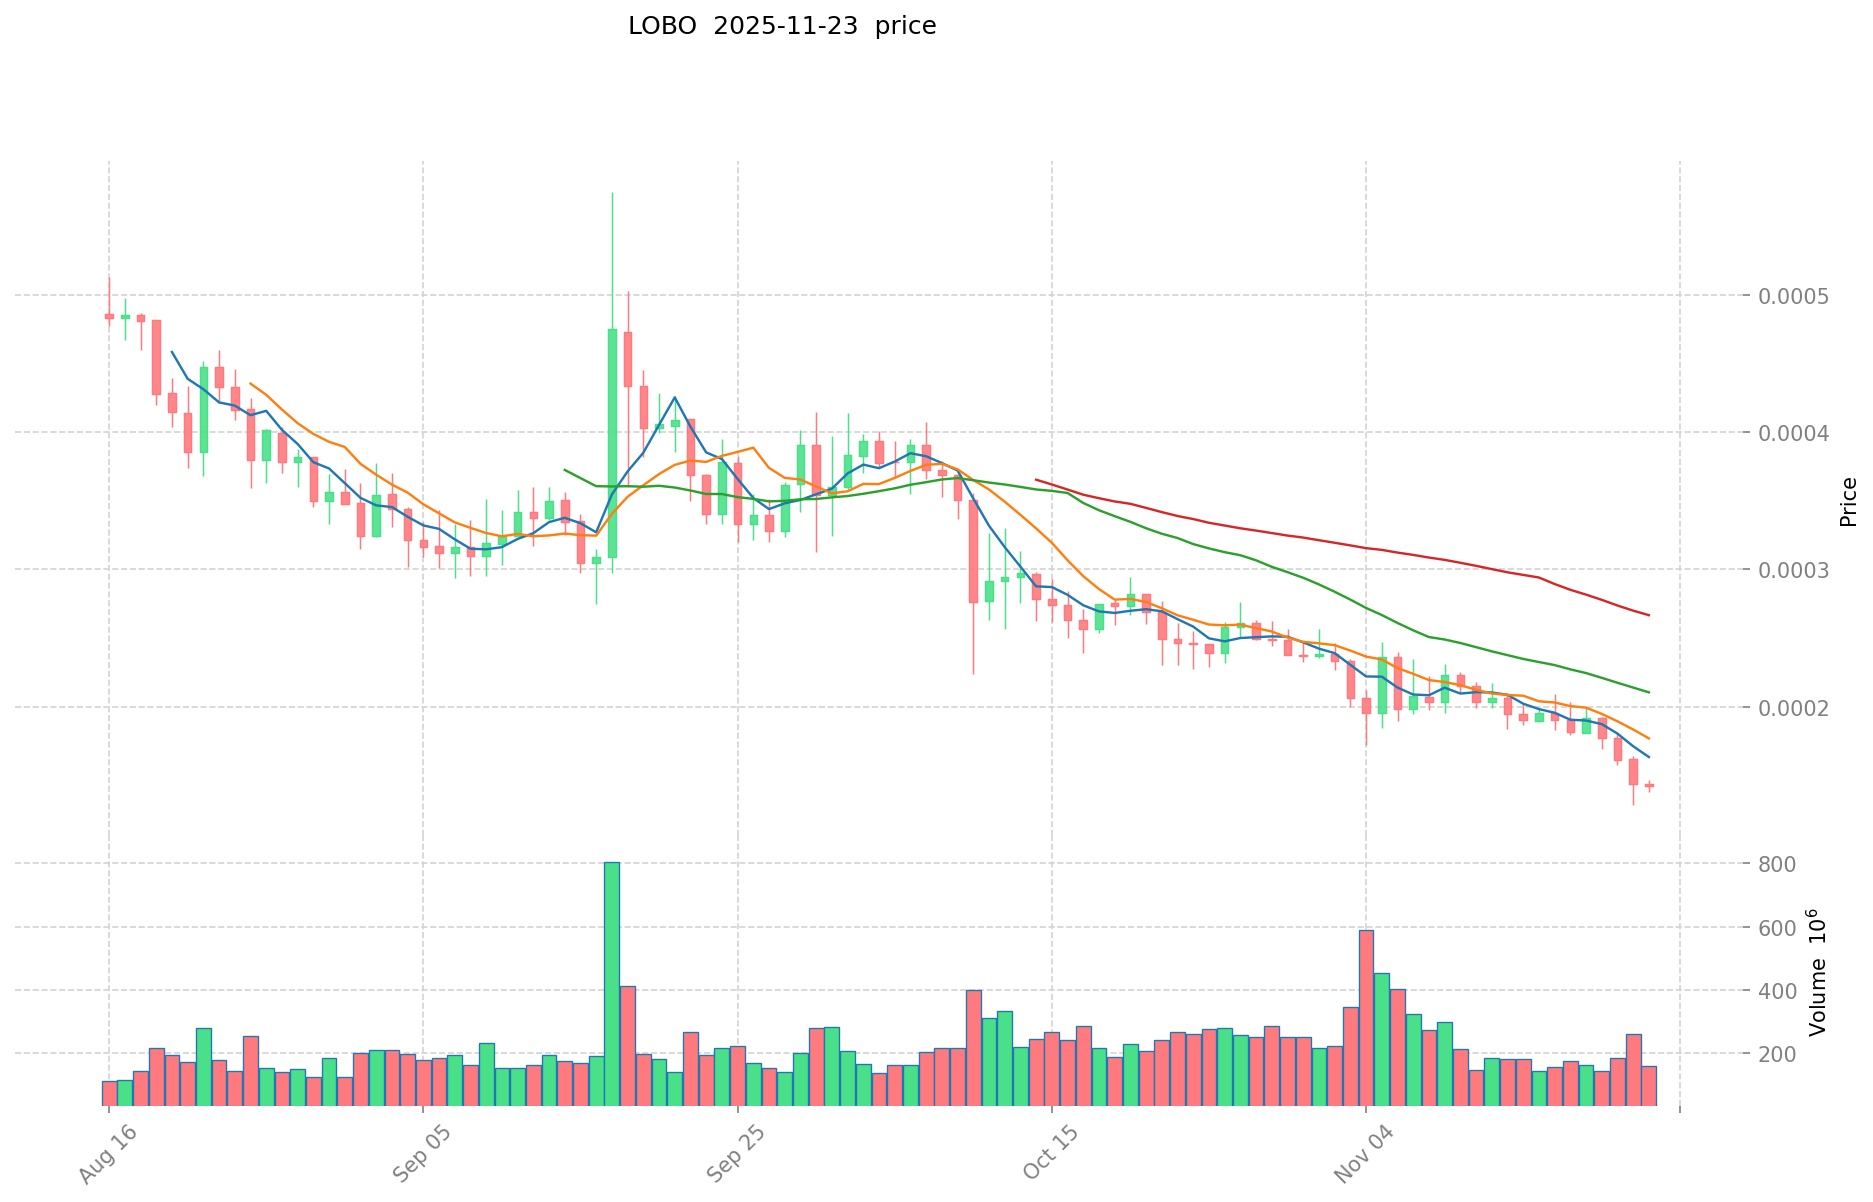
- 2024: LOBO reached its all-time high of $0.00414 on June 5, 2024.
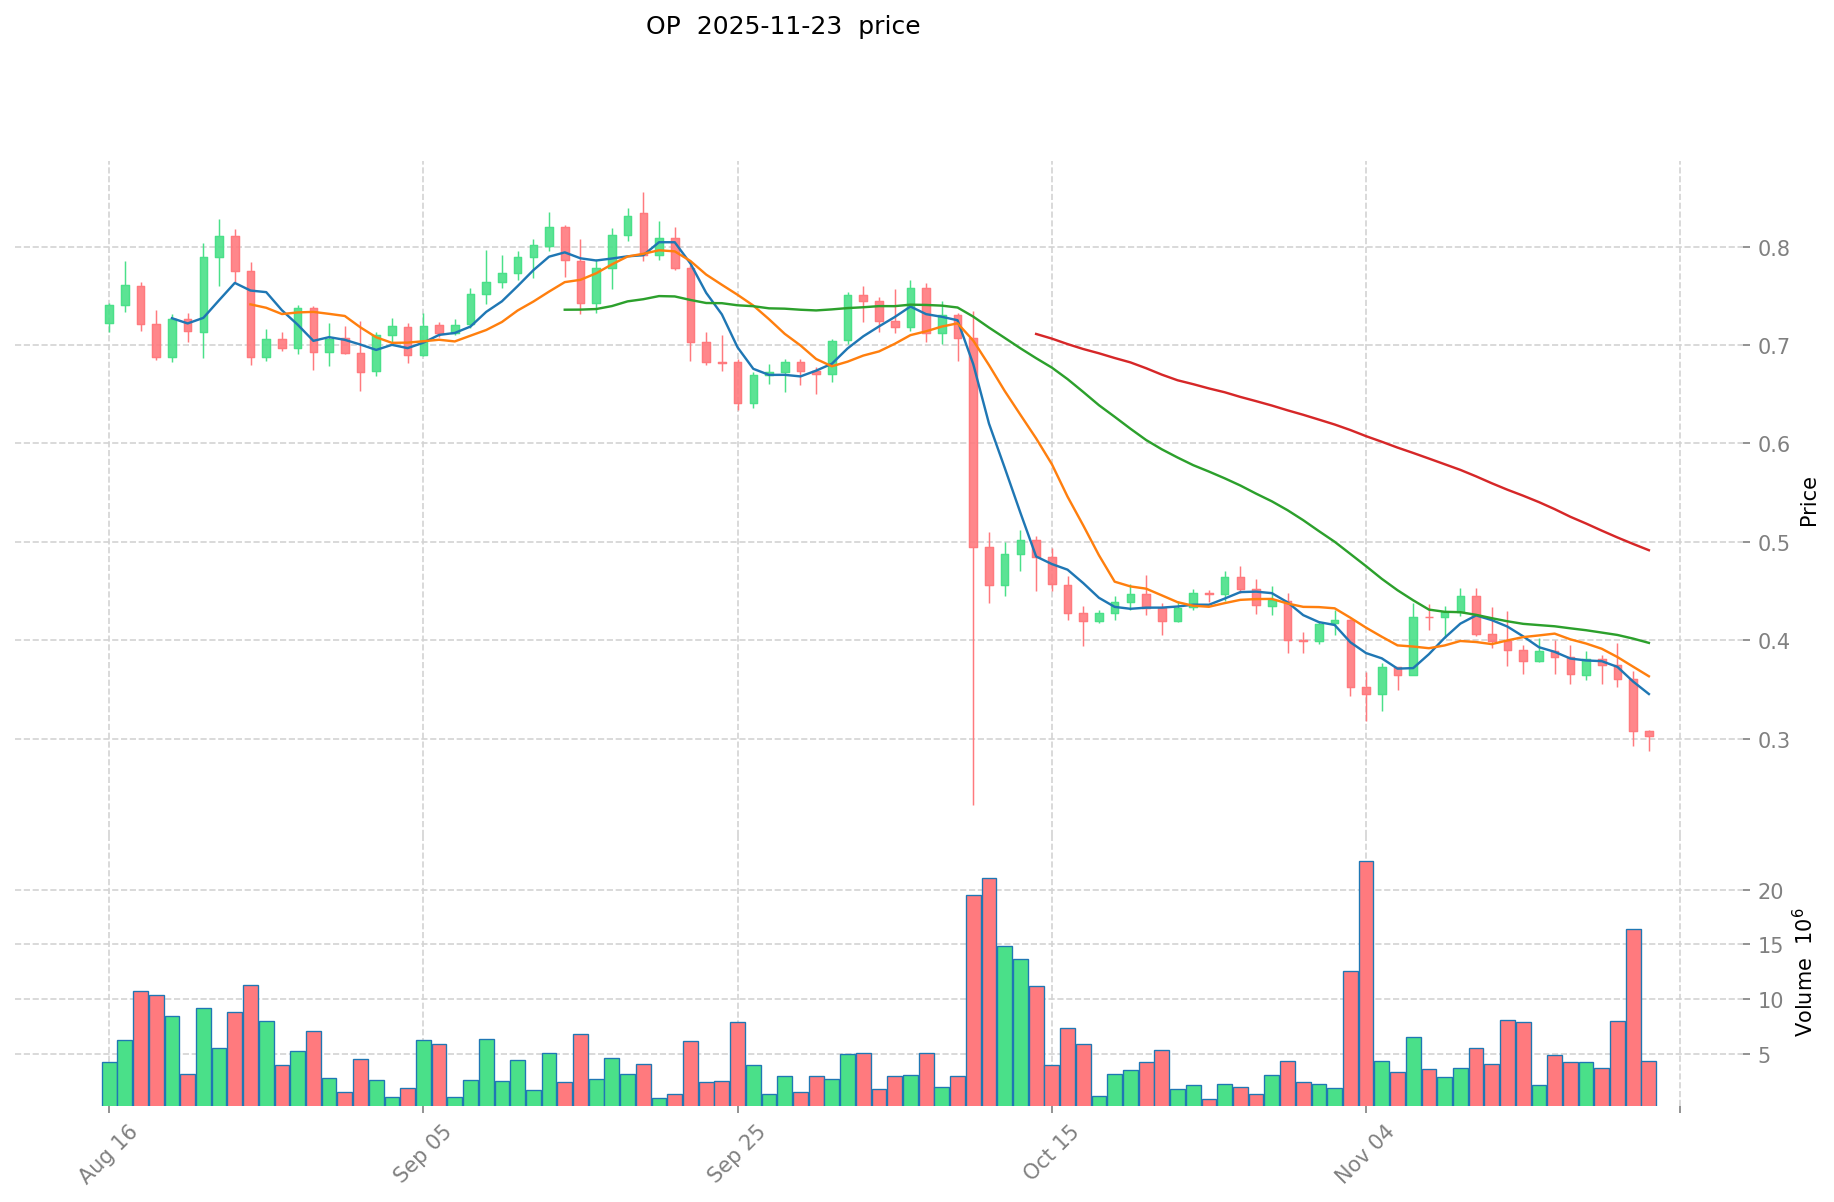
- 2025: OP hit its all-time low of $0.288846 on November 22, 2025.
- Comparative analysis: LOBO has fallen from its peak of $0.00414 to its current price of $0.0001444, while OP has declined from its all-time high of $4.84 to $0.3045.
Current Market Situation (2025-11-24)
- LOBO current price: $0.0001444
- OP current price: $0.3045
- 24-hour trading volume: LOBO $19,340.51 vs OP $906,064.34
- Market Sentiment Index (Fear & Greed Index): 13 (Extreme Fear)
Click to view real-time prices:
- Check LOBO's current price Market Price
- Check OP's current price Market Price
II. Core Factors Affecting LOBO vs OP Investment Value
Supply Mechanism Comparison (Tokenomics)
- LOBO: Fixed supply of 100 million tokens with 25% allocated to the community
- OP: Initial supply of 4.29 billion tokens, with gradual inflation and distribution across ecosystem participants
- 📌 Historical pattern: Fixed supply models like LOBO's tend to create potential scarcity value, while OP's gradual distribution approach focuses on sustainable ecosystem development.
Institutional Adoption and Market Applications
- Institutional holdings: OP currently enjoys broader institutional support with Optimism Foundation backing
- Enterprise adoption: OP has established stronger enterprise relationships through the Optimism Collective's governance model
- Regulatory attitudes: Both projects operate in uncertain regulatory environments, though OP's established presence in the L2 ecosystem gives it a slight advantage in regulatory clarity
Technical Development and Ecosystem Building
- LOBO technical upgrades: Recently launched mainnet with EVM compatibility
- OP technical development: Established L2 solution with significant transaction volume and proven scaling capabilities
- Ecosystem comparison: OP has a mature DeFi ecosystem with established protocols, while LOBO's ecosystem is in early development stages with focus on gaming and social applications
Macroeconomic Environment and Market Cycles
- Performance in inflationary environments: Neither token has been tested through complete economic cycles
- Macroeconomic monetary policy: Both tokens face similar sensitivities to broader crypto market conditions and risk sentiment
- Geopolitical factors: As L2 solutions, both aim to reduce Ethereum's transaction costs, potentially increasing cross-border transaction appeal in restrictive jurisdictions
III. 2025-2030 Price Prediction: LOBO vs OP
Short-term Prediction (2025)
- LOBO: Conservative $0.000077814 - $0.0001441 | Optimistic $0.0001441 - $0.000170038
- OP: Conservative $0.292224 - $0.3044 | Optimistic $0.3044 - $0.398764
Mid-term Prediction (2027)
- LOBO may enter a growth phase, with estimated price range $0.0001106865243 - $0.0002786246991
- OP may enter a bullish market, with estimated price range $0.2622098556 - $0.5482569708
- Key drivers: Institutional capital inflow, ETF, ecosystem development
Long-term Prediction (2030)
- LOBO: Base scenario $0.000249425975667 - $0.000311782469584 | Optimistic scenario $0.000311782469584 - $0.000399081561067
- OP: Base scenario $0.39009566577903 - $0.709264846870965 | Optimistic scenario $0.709264846870965 - $0.900766355526125
Disclaimer: The above predictions are based on historical data and market analysis. Cryptocurrency markets are highly volatile and subject to rapid changes. These projections should not be considered as financial advice or guarantees of future performance. Always conduct your own research before making investment decisions.
LOBO:
| 年份 | 预测最高价 | 预测平均价格 | 预测最低价 | 涨跌幅 |
|---|---|---|---|---|
| 2025 | 0.000170038 | 0.0001441 | 0.000077814 | 0 |
| 2026 | 0.00022460867 | 0.000157069 | 0.00010366554 | 8 |
| 2027 | 0.0002786246991 | 0.000190838835 | 0.0001106865243 | 32 |
| 2028 | 0.000307498614835 | 0.00023473176705 | 0.000119713201195 | 62 |
| 2029 | 0.000352449748225 | 0.000271115190942 | 0.000216892152754 | 87 |
| 2030 | 0.000399081561067 | 0.000311782469584 | 0.000249425975667 | 115 |
OP:
| 年份 | 预测最高价 | 预测平均价格 | 预测最低价 | 涨跌幅 |
|---|---|---|---|---|
| 2025 | 0.398764 | 0.3044 | 0.292224 | 0 |
| 2026 | 0.44299332 | 0.351582 | 0.25665486 | 15 |
| 2027 | 0.5482569708 | 0.39728766 | 0.2622098556 | 30 |
| 2028 | 0.704430749946 | 0.4727723154 | 0.420767360706 | 55 |
| 2029 | 0.82992816106893 | 0.588601532673 | 0.38847701156418 | 93 |
| 2030 | 0.900766355526125 | 0.709264846870965 | 0.39009566577903 | 132 |
IV. Investment Strategy Comparison: LOBO vs OP
Long-term vs Short-term Investment Strategy
- LOBO: Suitable for investors focused on meme coin potential and community-driven growth
- OP: Suitable for investors interested in Layer 2 scaling solutions and Ethereum ecosystem development
Risk Management and Asset Allocation
- Conservative investors: LOBO: 5% vs OP: 15%
- Aggressive investors: LOBO: 15% vs OP: 30%
- Hedging tools: Stablecoin allocation, options, cross-currency portfolio
V. Potential Risk Comparison
Market Risk
- LOBO: High volatility due to meme coin status and speculative nature
- OP: Dependent on Ethereum's success and adoption of Layer 2 solutions
Technical Risk
- LOBO: Scalability, network stability, and EVM compatibility issues
- OP: Rollup technology risks, potential vulnerabilities in smart contracts
Regulatory Risk
- Global regulatory policies may impact both tokens differently, with OP potentially facing more scrutiny due to its role in the Ethereum ecosystem
VI. Conclusion: Which Is the Better Buy?
📌 Investment Value Summary:
- LOBO advantages: Fixed supply, potential for rapid community-driven growth
- OP advantages: Established Layer 2 solution, strong institutional backing, developed ecosystem
✅ Investment Advice:
- New investors: Consider a small allocation to OP as part of a diversified crypto portfolio
- Experienced investors: Balance between LOBO and OP based on risk tolerance and belief in respective ecosystems
- Institutional investors: Focus on OP due to its established position in the Ethereum scaling landscape
⚠️ Risk Warning: The cryptocurrency market is highly volatile, and this article does not constitute investment advice. None
VII. FAQ
Q1: What are the main differences between LOBO and OP? A: LOBO is a meme coin on Bitcoin's Runes Protocol with a fixed supply, while OP is an Ethereum Layer 2 scaling solution with a gradually inflating supply. LOBO focuses on community-driven growth, while OP aims to provide practical solutions for developers and users in the Ethereum ecosystem.
Q2: Which token has performed better historically? A: Both tokens have experienced significant price declines from their all-time highs. LOBO has fallen from $0.00414 to $0.0001444, while OP has declined from $4.84 to $0.3045. However, OP currently has a higher trading volume and more established market presence.
Q3: How do the supply mechanisms of LOBO and OP differ? A: LOBO has a fixed supply of 100 million tokens with 25% allocated to the community. OP has an initial supply of 4.29 billion tokens with gradual inflation and distribution across ecosystem participants.
Q4: Which token has stronger institutional adoption? A: OP currently enjoys broader institutional support, backed by the Optimism Foundation and has established stronger enterprise relationships through its governance model.
Q5: What are the key factors affecting the future price of LOBO and OP? A: Key factors include institutional capital inflow, potential ETF approval, ecosystem development, technical upgrades, regulatory environment, and overall market sentiment in the crypto space.
Q6: What are the main risks associated with investing in LOBO and OP? A: Both tokens face market risks due to crypto volatility. LOBO has higher speculative risk due to its meme coin status. OP faces technical risks related to Layer 2 scaling solutions. Both are subject to evolving regulatory risks in the crypto space.
Q7: Which token is considered a better investment for different types of investors? A: For new investors, OP may be more suitable due to its established position in the Ethereum ecosystem. Experienced investors might consider balancing between LOBO and OP based on risk tolerance. Institutional investors may prefer OP for its stronger backing and developed ecosystem.
Share
Content
Introduction: LOBO vs OP Investment Comparison
I. Price History Comparison and Current Market Status
II. Core Factors Affecting LOBO vs OP Investment Value
III. 2025-2030 Price Prediction: LOBO vs OP
IV. Investment Strategy Comparison: LOBO vs OP
V. Potential Risk Comparison
VI. Conclusion: Which Is the Better Buy?
VII. FAQ

