Is Dvision Network (DVI) a good investment?: A Comprehensive Analysis of Market Potential, Risk Factors, and Future Outlook
Introduction: Dvision Network (DVI)'s Investment Position and Market Prospects
Dvision Network (DVI) is a blockchain-based VR content ecosystem token that presents a virtual reality world where users can engage in digital experiences. As of January 5, 2026, DVI is ranked #5,528 in the cryptocurrency market with a current price of $0.0002404, a market capitalization of approximately $240,400, and a circulating supply of 246,769,890 tokens out of a total supply of 1,000,000,000 tokens. The token is deployed across multiple blockchain networks, including Ethereum (ETH) and Binance Smart Chain (BSC), with 2,166 active token holders.
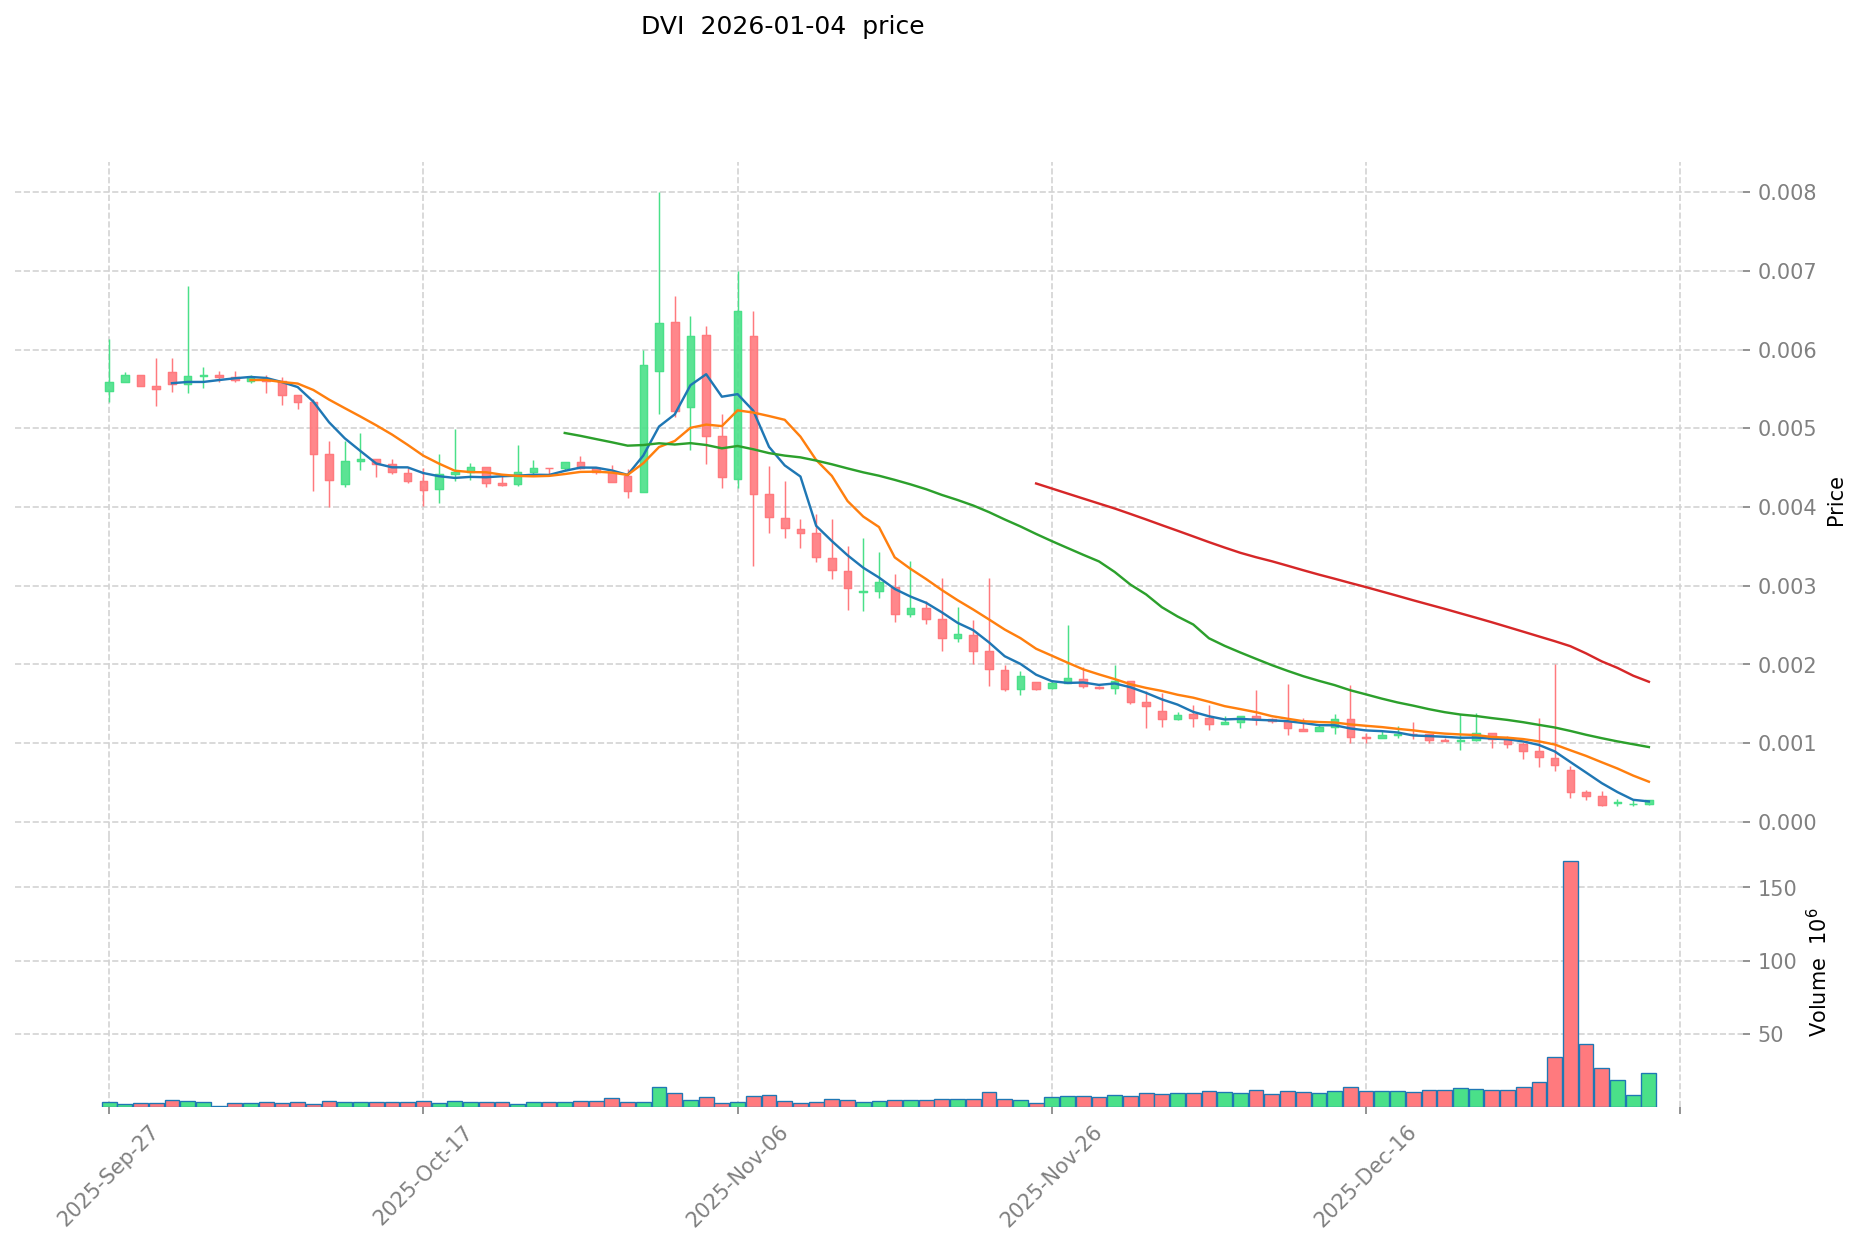
DVI has experienced significant market volatility, reaching an all-time high of $3.05 on November 21, 2021, while recently touching an all-time low of $0.00022399 on December 29, 2025. Over the past year, the token has declined by 98.38%, reflecting considerable downward pressure in both sentiment and valuation. Despite these challenging market conditions, DVI maintains a presence as a specialized project targeting the virtual reality and blockchain convergence space.
This article will provide a comprehensive analysis of DVI's investment value proposition, historical price trends, risk factors, and future market outlook to assist potential investors in making informed decisions regarding this asset.
Dvision Network (DVI) Research Report
I. DVI Price History Review and Current Investment Status
DVI Historical Price Performance
Based on available data, DVI has experienced significant price volatility:
- All-Time High (ATH): $3.05 USD, reached on November 21, 2021
- All-Time Low (ATL): $0.00022399 USD, reached on December 29, 2025
- Cumulative Decline: Approximately -98.38% over the past 12 months
The token demonstrates a severe downtrend from its peak valuation, with the most recent performance showing:
- 1-hour change: +9.56%
- 24-hour change: -3.8%
- 7-day change: -80.69%
- 30-day change: -82.03%
Current DVI Market Status (January 5, 2026)
| Metric | Value |
|---|---|
| Current Price | $0.0002404 USD |
| 24-Hour Trading Volume | $2,691.60 |
| Market Capitalization | $59,323.48 |
| Fully Diluted Valuation | $240,400.00 |
| Market Dominance | 0.0000072% |
| Circulating Supply | 246,769,890 DVI |
| Total Supply | 1,000,000,000 DVI |
| Token Holders | 2,166 |
| Circulating/Total Supply Ratio | 24.68% |
Market Emotion Indicator: Neutral (value: 1)
For real-time DVI market price updates, visit Gate.com DVI Market
II. Project Overview
Project Name: Dvision Network
Ticker Symbol: DVI
Blockchain Networks:
- Ethereum (ETH) - Contract: 0x10633216e7e8281e33c86f02bf8e565a635d9770
- Binance Smart Chain (BSC) - Contract: 0x758fb037a375f17c7e195cc634d77da4f554255b
Project Description
Dvision Network is a blockchain-based VR content ecosystem designed to create an immersive virtual reality world. The platform positions itself at the intersection of blockchain technology and virtual reality, enabling users to experience enriched digital environments. The project conceptually aligns with the fourth industrial revolution centered on information and communications technology (ICT).
Official Resources
- Website: https://dvision.network/
- Twitter: https://twitter.com/Dvision_network
- Facebook: https://www.facebook.com/Dvision-Network-119255129870212
- GitHub: https://github.com/Dvision-Network
- Block Explorers:
III. Market Analysis
Liquidity and Exchange Presence
DVI is currently listed on 1 exchange platform with a 24-hour trading volume of $2,691.60 USD. The relatively low trading volume indicates limited liquidity in the current market environment.
Token Distribution Status
- Circulating Supply: 246,769,890 DVI (24.68% of total supply)
- Remaining Supply: 753,230,110 DVI locked or not yet in circulation
- Active Token Holders: 2,166 addresses
The significant gap between circulating and total supply suggests potential dilution risk if remaining tokens enter circulation.
Price Performance Summary
The token exhibits characteristics of extreme underperformance relative to its historical peak:
| Period | Change |
|---|---|
| 1 Year | -98.38% |
| 30 Days | -82.03% |
| 7 Days | -80.69% |
| 24 Hours | -3.8% |
| 1 Hour | +9.56% |
Report Generated: January 5, 2026
Data Source: Gate.com Cryptocurrency Data
Disclaimer: This report is for informational purposes only and does not constitute investment advice.
Dvision Network (DVI) Investment Analysis Report
Report Date: January 5, 2026
I. Project Overview
Project Definition
Dvision Network is a blockchain-based Virtual Reality (VR) content ecosystem. The platform presents a new virtual reality world where users can lead enriched lives while participating in the fourth industrial revolution centered on Information and Communication Technology (ICT).
Basic Information
| Metric | Value |
|---|---|
| Token Symbol | DVI |
| Current Price | $0.0002404 |
| Market Capitalization | $59,323.48 |
| Fully Diluted Valuation | $240,400.00 |
| Circulating Supply | 246,769,890 DVI |
| Total Supply | 1,000,000,000 DVI |
| Circulating Supply Ratio | 24.68% |
| Market Rank | 5,528 |
| Token Holders | 2,166 |
| Last Updated | January 5, 2026 |
Blockchain Infrastructure
DVI operates on multiple blockchain networks:
- Ethereum (ETH): Contract Address - 0x10633216e7e8281e33c86f02bf8e565a635d9770
- Binance Smart Chain (BSC): Contract Address - 0x758fb037a375f17c7e195cc634d77da4f554255b
II. Core Factors Influencing Whether Dvision Network (DVI) is a Good Investment
Supply Mechanism and Scarcity
- Current Supply Status: The token maintains a total supply of 1 billion DVI, with approximately 246.77 million tokens currently in circulation, representing 24.68% of total supply.
- Scarcity Implications: With 75.32% of tokens remaining in reserve, future supply dynamics will significantly influence price discovery and investment value.
- Investment Significance: The gradual token release schedule could potentially support long-term valuation as supply-demand mechanics evolve.
Market Positioning and Adoption
- Ecosystem Focus: Dvision Network targets the VR content sector, representing a specialized niche within the broader blockchain ecosystem.
- Token Holder Base: The project currently maintains 2,166 token holders, indicating a relatively concentrated investor base.
- Market Penetration: As a rank 5,528 asset by market capitalization, DVI remains in the micro-cap segment of the cryptocurrency market.
Macroeconomic Context for DVI Investment
- Market Volatility: The cryptocurrency sector exhibits significant price volatility. DVI's 24-hour trading volume of $2,691.60 reflects relatively modest liquidity compared to larger-cap assets.
- Long-term Price Trajectory: The token has experienced substantial value compression, declining 98.38% over the past 12 months, indicating severe market headwinds.
- Historical Price Context: DVI reached its all-time high of $3.05 on November 21, 2021, and recently touched a new low of $0.00022399 on December 29, 2025, demonstrating extreme volatility.
Technology and Ecosystem Development
- VR/Metaverse Sector: Dvision Network operates within the virtual reality and metaverse domain, which represents an emerging but competitive segment of blockchain applications.
- Multi-chain Presence: The project's deployment across Ethereum and Binance Smart Chain provides accessibility across major DeFi ecosystems.
- Project Documentation: Official resources are available through the project website (https://dvision.network/) and GitHub repository (https://github.com/Dvision-Network).
III. Price Performance Analysis
Short-term Price Movements
| Time Period | Price Change | Change Amount |
|---|---|---|
| 1 Hour | +9.56% | +$0.000020977 |
| 24 Hours | -3.80% | -$0.000009496 |
| 7 Days | -80.69% | -$0.001004551 |
| 30 Days | -82.03% | -$0.001097385 |
| 1 Year | -98.38% | -$0.014599106 |
Trading Range (24-hour)
- High: $0.0002749
- Low: $0.0002293
- Current: $0.0002404
IV. Key Investment Considerations
Note: The following represents factual market data analysis and should not be construed as investment advice.
Risk Factors
- Significant Value Decline: The 98.38% annual decline represents severe investor losses and indicates substantial market challenges.
- Concentrated Holder Base: With only 2,166 token holders, the project demonstrates limited distribution and potential liquidity constraints.
- Volatile Market Conditions: Recent 7-day and 30-day declines of approximately 80% suggest pronounced market instability.
- Micro-cap Status: The modest $59,323 market capitalization places DVI among the smallest cryptocurrency assets, increasing volatility and liquidity risks.
Positive Indicators
- Multi-chain Deployment: Presence on both Ethereum and BSC provides ecosystem flexibility.
- Emerging Sector Focus: VR and metaverse technologies represent areas of ongoing blockchain development.
- Project Infrastructure: Active GitHub presence and official website indicate ongoing development efforts.
V. Market Data Sources
- Official Website: https://dvision.network/
- Social Media: Twitter (@Dvision_network), Facebook (Dvision-Network)
- Blockchain Explorers: Etherscan, BSCScan
- Development Repository: GitHub (/Dvision-Network)
VI. Disclaimer
This analysis is based solely on the data provided as of January 5, 2026. Cryptocurrency markets are characterized by high volatility and technical risk. Past performance does not guarantee future results. Investors should conduct their own comprehensive due diligence before making any investment decisions. This report does not constitute investment advice, recommendation, or endorsement of any particular investment strategy.
III. DVI Future Investment Prediction and Price Outlook (Is Dvision Network(DVI) worth investing in 2026-2031?)
Short-term Investment Prediction (2026, short-term DVI investment outlook)
- Conservative forecast: $0.000252864 to $0.00028974
- Neutral forecast: $0.0002634
- Optimistic forecast: $0.00028974 with potential upside to $0.0003
Mid-term Investment Outlook (2027-2029, mid-term Dvision Network(DVI) investment forecast)
- Market phase expectation: Potential recovery phase with gradual adoption of VR content ecosystem technologies
- Investment return prediction:
- 2027: $0.0001908333 to $0.0003291183
- 2028: $0.00024227532 to $0.000357356097
- 2029: $0.000260779097565 to $0.000412625154375
- Key catalysts: VR ecosystem development, blockchain integration expansion, community engagement initiatives
Long-term Investment Outlook (Is DVI a good long-term investment?)
- Base case: $0.000226531209751 to $0.000451874059059 (corresponding to stable ecosystem growth and consistent user adoption)
- Optimistic case: $0.000226531209751 to $0.000451874059059 (corresponding to accelerated VR market penetration and mainstream technology partnerships)
- Risk scenario: $0.00015 to $0.0001969 (extreme market downturn or project development delays)
Click to view DVI long-term investment and price forecasts: Price Prediction
2026-01-05 to 2031 Long-term Outlook
- Base case: $0.000226531 - $0.000401072 USD (corresponding to steady progress in VR ecosystem adoption and mainstream application development)
- Optimistic case: $0.000356729 - $0.000451874 USD (corresponding to large-scale VR adoption and favorable market environment)
- Transformative case: $0.0005+ USD (if ecosystem achieves breakthrough progress and mainstream adoption)
- 2031-12-31 predicted high: $0.000451874 USD (based on optimistic development assumptions)
Disclaimer: This analysis is for informational purposes only and should not be construed as investment advice. Cryptocurrency markets are highly volatile and unpredictable. Past performance does not guarantee future results. Investors should conduct their own research and consult with qualified financial advisors before making investment decisions.
| 年份 | 预测最高价 | 预测平均价格 | 预测最低价 | 涨跌幅 |
|---|---|---|---|---|
| 2026 | 0.00028974 | 0.0002634 | 0.000252864 | 9 |
| 2027 | 0.0003291183 | 0.00027657 | 0.0001908333 | 15 |
| 2028 | 0.000357356097 | 0.00030284415 | 0.00024227532 | 25 |
| 2029 | 0.000412625154375 | 0.0003301001235 | 0.000260779097565 | 37 |
| 2030 | 0.000401071650052 | 0.000371362638937 | 0.000226531209751 | 54 |
| 2031 | 0.000451874059059 | 0.000386217144495 | 0.000196970743692 | 60 |
Dvision Network (DVI) Investment Analysis Report
I. Project Overview
Basic Information
Project Name: Dvision Network
Token Symbol: DVI
Current Price: $0.0002404 (as of January 5, 2026)
Market Capitalization: $59,323.48
Fully Diluted Valuation: $240,400.00
Circulating Supply: 246,769,890 DVI
Total Supply: 1,000,000,000 DVI
Circulation Ratio: 24.68%
Project Description
Dvision Network is a new Virtual Reality (VR) Content Ecosystem built on blockchain technology. The project presents a new virtual reality world where individuals can live prosperous lives while participating in the fourth industrial revolution centered on Information and Communication Technology (ICT).
Official Channels
- Website: https://dvision.network/
- Twitter: https://twitter.com/Dvision_network
- GitHub: https://github.com/Dvision-Network
- Facebook: https://www.facebook.com/Dvision-Network-119255129870212
II. Token Distribution & Network Data
Smart Contract Information
| Chain | Contract Address | Explorer |
|---|---|---|
| Ethereum (ETH) | 0x10633216e7e8281e33c86f02bf8e565a635d9770 | Etherscan |
| Binance Smart Chain (BSC) | 0x758fb037a375f17c7e195cc634d77da4f554255b | BSCScan |
Holder Statistics
- Total Token Holders: 2,166
- Market Dominance: 0.0000072%
III. Price Performance & Market Analysis
Current Market Status
| Metric | Value |
|---|---|
| 24-Hour Change | -3.80% |
| 7-Day Change | -80.69% |
| 30-Day Change | -82.03% |
| 1-Year Change | -98.38% |
| 24-Hour Volume | $2,691.60 |
Historical Price Milestones
- All-Time High (ATH): $3.05 (November 21, 2021)
- All-Time Low (ATL): $0.00022399 (December 29, 2025)
- 24-Hour Range: $0.0002293 - $0.0002749
Price Trend Analysis
| Timeframe | Price Change (%) | Change Amount |
|---|---|---|
| 1 Hour | +9.56% | +$0.000020976852866009 |
| 24 Hours | -3.80% | -$0.000009496049896050 |
| 7 Days | -80.69% | -$0.001004550802692905 |
| 30 Days | -82.03% | -$0.001097385197551475 |
| 1 Year | -98.38% | -$0.014599106172839512 |
Observation: DVI has experienced severe price depreciation over extended timeframes, declining approximately 98.38% year-over-year. However, the token exhibited a +9.56% intraday recovery, suggesting short-term technical rebound potential.
IV. Investment Strategy & Risk Management
Investment Methodology
Long-Term Holdings (HODL Strategy)
Suitable for risk-tolerant investors with extended time horizons:
- Accumulation during price downturns
- Focus on project fundamentals and ecosystem development
- Requires patience through volatility cycles
Active Trading
Dependent on technical analysis and market micro-cycles:
- Capitalize on intraday volatility (recent +9.56% hourly movement)
- Utilize resistance and support levels
- Demands continuous market monitoring and analytical skills
Risk Management Framework
Portfolio Allocation Recommendations
- Conservative Investors: 0-1% of total portfolio
- Moderate Investors: 1-3% of total portfolio
- Aggressive Investors: 3-5% of total portfolio
- Professional Traders: Position-sizing based on risk tolerance models
Risk Hedging Strategies
- Diversified Asset Composition: Combine DVI with stable cryptocurrencies and traditional assets
- Hedging Instruments: Utilize stablecoin pairs and derivatives for downside protection
- Position Sizing: Apply Kelly Criterion or fixed fractional methods
Secure Storage Solutions
- Hot Wallets: MetaMask, Trust Wallet (for frequent trading)
- Cold Wallets: Ledger Nano S/X, Trezor (for long-term holdings)
- Multi-Signature Wallets: Enhanced security for institutional holdings
V. Investment Risks & Challenges
Market Risk
- Extreme Volatility: 98.38% year-over-year decline indicates pronounced price instability
- Liquidity Concerns: 24-hour volume of $2,691.60 suggests limited trading liquidity
- Price Manipulation Risk: Smaller market cap may be susceptible to whale activity
Regulatory Risk
- Jurisdictional Uncertainty: Crypto regulations vary significantly across countries
- VR/Metaverse Classification: Uncertain regulatory treatment of VR-based crypto projects
- Compliance Changes: Potential regulatory shifts may impact project viability
Technology Risk
- Smart Contract Vulnerabilities: Blockchain-based projects face security audit concerns
- Ecosystem Development: Uncertainty regarding VR content ecosystem adoption rates
- Network Security: Dependency on Ethereum and BSC network security
Project-Specific Risk
- Adoption Challenges: VR content ecosystem requires substantial user acquisition
- Competition: Facing established VR platforms and competing metaverse projects
- Team Execution: Project success depends on development team capability
VI. Conclusion: Is Dvision Network a Good Investment?
Investment Value Summary
Dvision Network represents a speculative opportunity within the VR content ecosystem sector. While the project's technological vision aligns with emerging Web3 infrastructure trends, the token has experienced severe depreciation (98.38% year-over-year), indicating significant market skepticism. The project's current utility and adoption metrics remain limited relative to valuation volatility.
Investor Recommendations
✅ Beginner Investors:
- Implement dollar-cost averaging strategy if risk tolerance permits
- Allocate only capital they can afford to lose completely
- Utilize secure hardware wallet storage for any holdings
✅ Experienced Traders:
- Employ technical analysis for wave cycle trading opportunities
- Maintain strict stop-loss discipline given volatility history
- Diversify DVI holdings within broader crypto portfolio
✅ Institutional Investors:
- Conduct comprehensive due diligence on ecosystem development metrics
- Evaluate team credentials and project roadmap delivery history
- Consider strategic allocation only after substantial project maturation signals
Risk Disclosure
⚠️ Important Notice: Cryptocurrency investments carry substantial risk including potential total capital loss. DVI's extreme price volatility and limited trading volume amplify these risks. This report is provided for informational purposes only and does not constitute investment advice, financial recommendation, or an offer to buy or sell securities. Investors should conduct independent research and consult qualified financial advisors before making investment decisions.
Report Date: January 5, 2026
Data Source: Gate.com Market Data
Dvision Network (DVI) FAQ Guide
I. General Project Information
Q1: What is Dvision Network (DVI) and what problem does it solve?
A: Dvision Network is a blockchain-based Virtual Reality (VR) content ecosystem token built on Ethereum and Binance Smart Chain. The project creates an immersive virtual reality world where users can engage in enriched digital experiences while participating in the fourth industrial revolution centered on Information and Communication Technology (ICT). It positions itself at the intersection of blockchain technology and VR, enabling decentralized virtual reality content creation and consumption.
Q2: Where can I find official information about Dvision Network?
A: You can access Dvision Network through multiple official channels: website (https://dvision.network/), Twitter (@Dvision_network), GitHub (https://github.com/Dvision-Network), and Facebook (Dvision-Network). Smart contract addresses are available on Etherscan (0x10633216e7e8281e33c86f02bf8e565a635d9770 for Ethereum) and BSCScan (0x758fb037a375f17c7e195cc634d77da4f554255b for Binance Smart Chain).
II. Token Supply & Market Structure
Q3: What is the current supply status of DVI tokens?
A: As of January 5, 2026, DVI has a circulating supply of 246,769,890 tokens (24.68% of total supply) with a total supply of 1,000,000,000 tokens. This means 753,230,110 tokens remain locked or not yet in circulation. The project maintains 2,166 active token holders and a market capitalization of approximately $59,323.48, ranking 5,528 in the broader cryptocurrency market.
Q4: What risks does the token supply structure present?
A: The significant gap between circulating (24.68%) and total supply (100%) creates potential dilution risk if the remaining 75.32% of locked tokens enter circulation. This supply mechanism could exert downward pressure on token price if large quantities are released without corresponding ecosystem adoption or demand growth. Investors should monitor token release schedules and vesting arrangements closely.
III. Price Performance & Investment Considerations
Q5: Why has DVI experienced such severe price depreciation?
A: DVI has declined 98.38% over the past twelve months, falling from historical peaks of $3.05 (November 21, 2021) to recent lows of $0.00022399 (December 29, 2025). This extreme depreciation reflects multiple factors: limited ecosystem adoption, reduced market sentiment toward VR/metaverse projects, concentrated token holder base (only 2,166 holders), constrained trading liquidity (24-hour volume $2,691.60), and broader cryptocurrency market headwinds. The token's micro-cap status amplifies volatility and price discovery challenges.
Q6: Should I invest in DVI given its current market conditions?
A: Dvision Network represents a high-risk, speculative investment suitable only for risk-tolerant investors who can afford complete capital loss. Conservative investors should allocate 0-1% of portfolios, moderate investors 1-3%, and aggressive investors 3-5%. The project requires substantial ecosystem development, user adoption improvements, and favorable market conditions for price recovery. Conduct comprehensive due diligence on VR technology trends, competitive positioning, and team execution capabilities before investing. This analysis is informational only and does not constitute investment advice.
IV. Technical & Market Analysis
Q7: What are the key risk factors associated with DVI investment?
A: Primary risk factors include: extreme price volatility (98.38% annual decline, 80.69% seven-day decline), limited trading liquidity threatening position entry/exit, concentrated holder base suggesting weak distribution, micro-cap market cap increasing manipulation vulnerability, regulatory uncertainty surrounding crypto and VR projects, smart contract security concerns, unproven VR ecosystem adoption metrics, and competition from established metaverse platforms. Additionally, project success depends entirely on team execution and market adoption timelines that remain uncertain.
Q8: What are the projected price scenarios for DVI through 2031?
A: Conservative 2026 outlook: $0.000252864 to $0.00028974. Mid-term projections (2027-2029) suggest gradual recovery potential ranging from $0.0001908333 to $0.000412625. Long-term 2031 scenarios project: base case $0.000226531-$0.000401072, optimistic case $0.000356729-$0.000451874, and transformative case exceeding $0.0005+ if breakthrough adoption occurs. These forecasts depend entirely on ecosystem development, VR market penetration, mainstream technology partnerships, and favorable macroeconomic conditions. Past performance does not guarantee future results, and all projections carry substantial uncertainty.
Disclaimer: This FAQ is provided for informational purposes only and does not constitute investment advice, financial recommendation, or endorsement. Cryptocurrency markets are highly volatile and unpredictable. Investors should conduct independent research and consult qualified financial advisors before making investment decisions. Past performance does not guarantee future results.
Report Date: January 5, 2026
Data Source: Gate.com Cryptocurrency Market Data
Share
How to Buy Cryptocurrency


Trending Cryptocurrencies


Is ZTX (ZTX) a good investment?: Analyzing the potential and risks of this emerging cryptocurrency

Is Metahero (HERO) a Good Investment?: Analyzing the Potential and Risks of this Metaverse Token in 2023

2025 HQ Price Prediction: Analyzing Market Trends and Factors Shaping the Future Value

2025 BAG Price Prediction: Analyzing Market Trends and Potential Growth Factors

OXT vs MANA: Comparing Two Cryptocurrencies in the Digital Asset Space
2025 ZTX Price Prediction: Analyzing Market Trends and Expert Forecasts for the Emerging Cryptocurrency
2026 Bitcoin Price Forecast Fully Explained: Will BTC Challenge the $250,000 Level?

How do crypto derivatives market signals predict price movements with futures open interest, funding rates, and liquidation data?

Tap2Earn Gaming Revolution: From Click-to-Earn Tokens to Comprehensive Ecosystem Incentives

How to Use MACD, RSI, and KDJ Technical Indicators for Crypto Trading Signals

What is CHEX token holdings and capital flow: Exchange inflows, staking rates, and institutional positions in 2025?