GLQ vs ENJ: Comparing Two Leading Gaming Cryptocurrencies in the Metaverse Economy
Introduction: Investment Comparison of GLQ vs ENJ
In the cryptocurrency market, the comparison between GraphLinq Protocol (GLQ) vs Enjin Coin (ENJ) has been an unavoidable topic for investors. The two not only show significant differences in market cap ranking, application scenarios, and price performance but also represent different crypto asset positioning.
GraphLinq Protocol (GLQ): Launched in 2021, it has gained market recognition for its automation of decentralized DeFi data monitoring and external execution through multi-chain applications.
Enjin Coin (ENJ): Since its inception in 2017, it has been hailed as a leading platform for the gaming industry, becoming one of the most prominent cryptocurrencies in the gaming and NFT sectors.
This article will comprehensively analyze the investment value comparison between GLQ and ENJ, focusing on historical price trends, supply mechanisms, institutional adoption, technological ecosystems, and future predictions, attempting to answer the question investors care about most:
"Which is the better buy right now?"
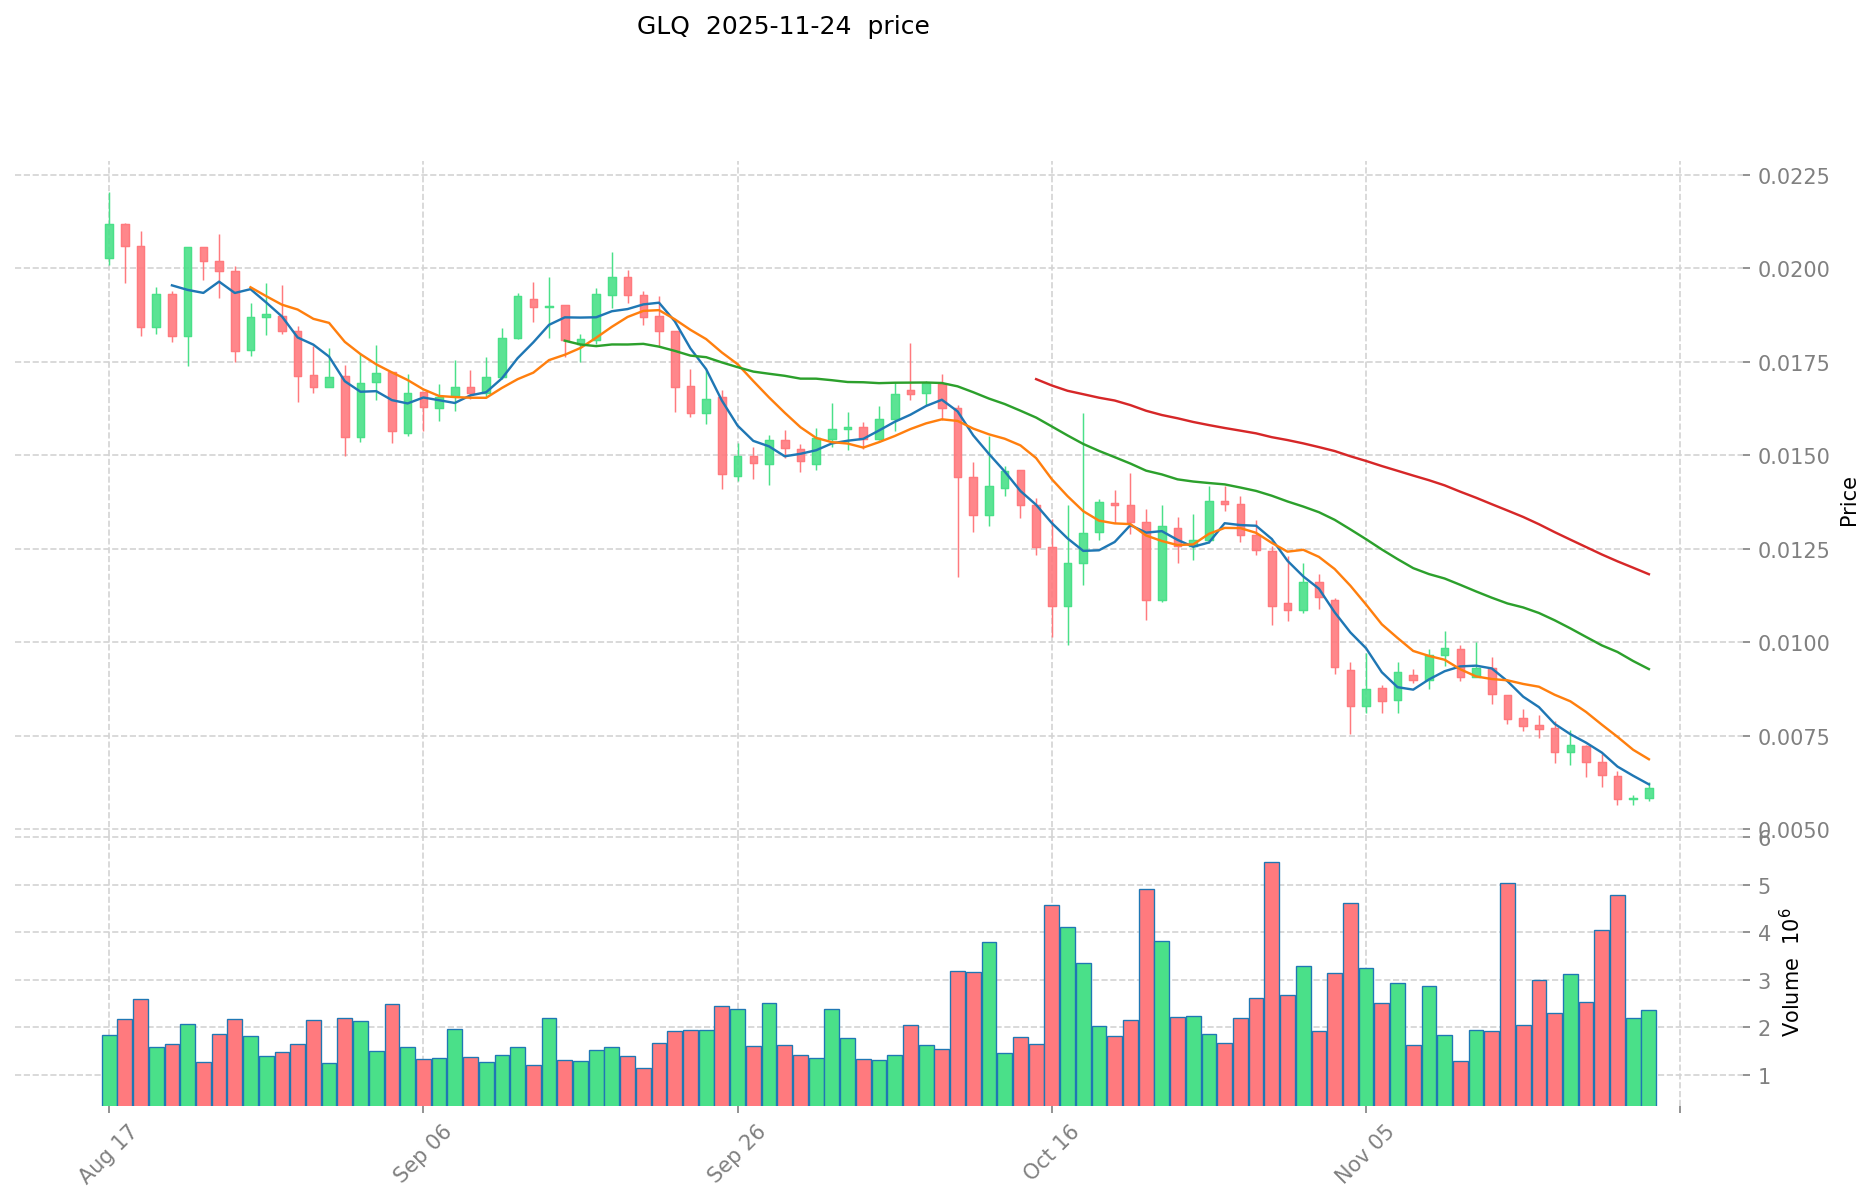
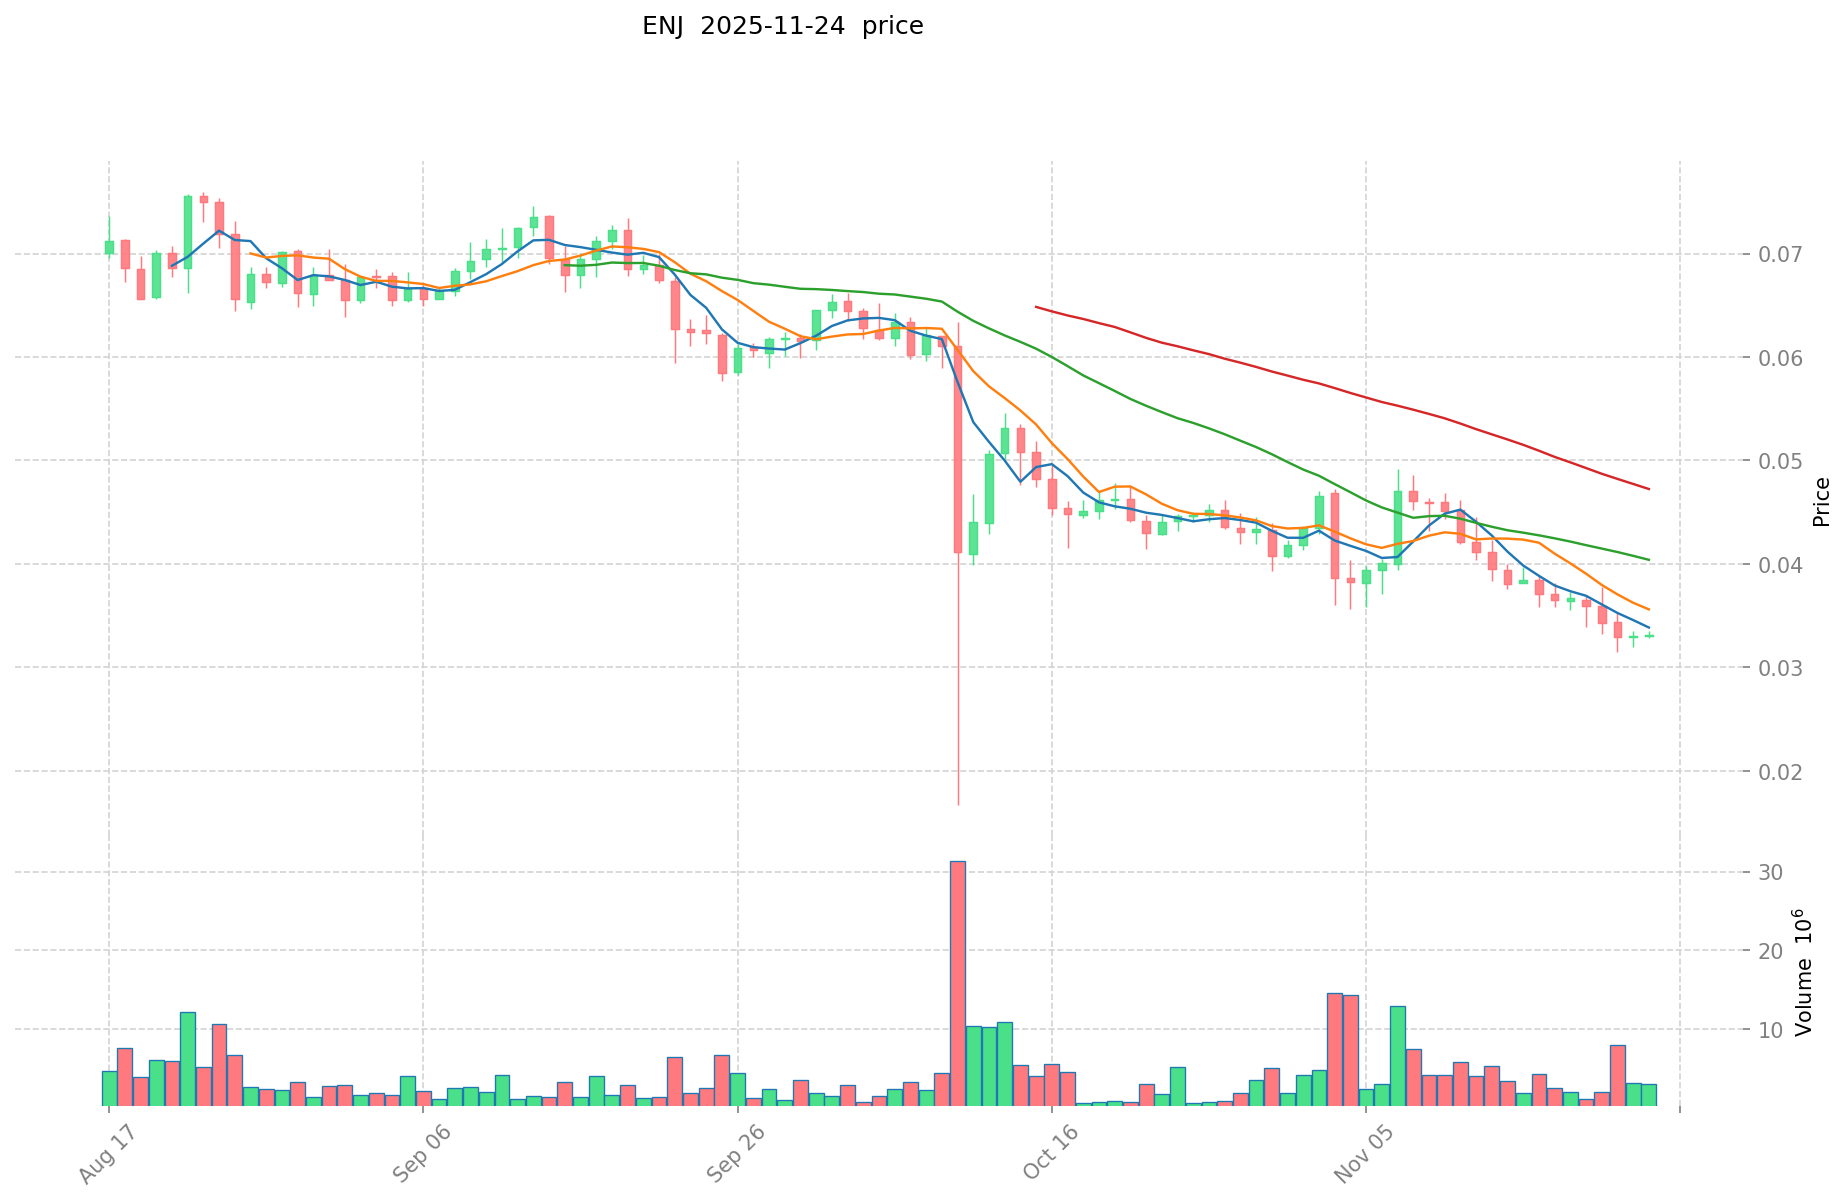
I. Price History Comparison and Current Market Status
GLQ and ENJ Historical Price Trends
- 2022: GLQ reached its all-time low of $0.00118009 on June 19, 2022, during the crypto market downturn.
- 2021: ENJ hit its all-time high of $4.82 on November 25, 2021, amid the broader crypto bull market.
- Comparative analysis: During the recent market cycle, GLQ dropped from its all-time high of $0.19361 to its current price of $0.006001, while ENJ declined from its peak of $4.82 to the current $0.03263.
Current Market Situation (2025-11-24)
- GLQ current price: $0.006001
- ENJ current price: $0.03263
- 24-hour trading volume: GLQ $14,279.08 vs ENJ $71,689.33
- Market Sentiment Index (Fear & Greed Index): 19 (Extreme Fear)
Click to view real-time prices:
- Check GLQ current price Market Price
- Check ENJ current price Market Price
II. Core Factors Affecting the Investment Value of GLQ vs ENJ
Supply Mechanism Comparison (Tokenomics)
- GLQ: Fixed maximum supply of 100 billion tokens with issuance mechanism based on network activity
- ENJ: Fixed supply of 1 billion tokens with deflationary model through token burning when creating NFTs
- 📌 Historical pattern: ENJ's deflationary mechanism has historically created upward price pressure during NFT adoption waves, while GLQ's larger supply requires more substantial adoption for similar price movement.
Institutional Adoption and Market Applications
- Institutional holdings: ENJ has attracted more institutional interest due to its established position in the gaming NFT space and partnerships with major gaming companies
- Enterprise adoption: ENJ has stronger integration with gaming platforms for digital asset creation, while GLQ focuses on providing DeFi and gaming infrastructure
- National policies: Both tokens face similar regulatory frameworks as utility tokens in the gaming and NFT spaces
Technical Development and Ecosystem Building
- GLQ technical upgrades: Development of GraphLinq Protocol for no-code blockchain automation and integration with multiple chains
- ENJ technical development: Focus on Efinity parachain on Polkadot for scalable NFT infrastructure and JumpNet for fee-less transactions
- Ecosystem comparison: ENJ has a more mature NFT ecosystem specifically tailored for gaming, while GLQ provides broader blockchain data automation tools across DeFi applications
Macroeconomic and Market Cycles
- Performance in inflationary environments: ENJ has demonstrated stronger correlation with broader crypto market movements in high inflation periods
- Macroeconomic monetary policy: Both tokens show sensitivity to interest rate changes, with ENJ historically showing higher volatility
- Geopolitical factors: ENJ's gaming focus makes it less susceptible to cross-border transaction restrictions compared to GLQ's automation infrastructure
III. 2025-2030 Price Prediction: GLQ vs ENJ
Short-term Prediction (2025)
- GLQ: Conservative $0.00429905 - $0.006055 | Optimistic $0.006055 - $0.00793205
- ENJ: Conservative $0.021268 - $0.03272 | Optimistic $0.03272 - $0.0337016
Mid-term Prediction (2027)
- GLQ may enter a growth phase, with estimated price range $0.0068816286 - $0.0124729518375
- ENJ may enter a steady growth phase, with estimated price range $0.02120177472 - $0.05451884928
- Key drivers: Institutional capital inflow, ETF developments, ecosystem growth
Long-term Prediction (2030)
- GLQ: Base scenario $0.007945481070363 - $0.013466917068412 | Optimistic scenario $0.013466917068412 - $0.014005593751149
- ENJ: Base scenario $0.030328263406546 - $0.049718464600896 | Optimistic scenario $0.049718464600896 - $0.060159342167084
Disclaimer
GLQ:
| 年份 | 预测最高价 | 预测平均价格 | 预测最低价 | 涨跌幅 |
|---|---|---|---|---|
| 2025 | 0.00793205 | 0.006055 | 0.00429905 | 0 |
| 2026 | 0.0102105465 | 0.006993525 | 0.00566475525 | 16 |
| 2027 | 0.0124729518375 | 0.00860203575 | 0.0068816286 | 43 |
| 2028 | 0.011907367986937 | 0.01053749379375 | 0.009378369476437 | 75 |
| 2029 | 0.015711403246481 | 0.011222430890343 | 0.007070131460916 | 87 |
| 2030 | 0.014005593751149 | 0.013466917068412 | 0.007945481070363 | 124 |
ENJ:
| 年份 | 预测最高价 | 预测平均价格 | 预测最低价 | 涨跌幅 |
|---|---|---|---|---|
| 2025 | 0.0337016 | 0.03272 | 0.021268 | 0 |
| 2026 | 0.042509824 | 0.0332108 | 0.032214476 | 1 |
| 2027 | 0.05451884928 | 0.037860312 | 0.02120177472 | 16 |
| 2028 | 0.0498847470912 | 0.04618958064 | 0.0406468309632 | 41 |
| 2029 | 0.051399765336192 | 0.0480371638656 | 0.035547501260544 | 47 |
| 2030 | 0.060159342167084 | 0.049718464600896 | 0.030328263406546 | 52 |
IV. Investment Strategy Comparison: GLQ vs ENJ
Long-term vs Short-term Investment Strategy
- GLQ: Suitable for investors focused on DeFi automation and multi-chain infrastructure potential
- ENJ: Suitable for investors interested in gaming NFTs and established blockchain gaming ecosystems
Risk Management and Asset Allocation
- Conservative investors: GLQ: 20% vs ENJ: 80%
- Aggressive investors: GLQ: 40% vs ENJ: 60%
- Hedging tools: Stablecoin allocation, options, cross-currency portfolios
V. Potential Risk Comparison
Market Risk
- GLQ: Higher volatility due to lower market cap and trading volume
- ENJ: Exposure to fluctuations in gaming and NFT market trends
Technical Risk
- GLQ: Scalability, network stability
- ENJ: Dependency on gaming industry adoption, potential competition from other gaming-focused blockchains
Regulatory Risk
- Global regulatory policies may have different impacts on both tokens, with ENJ potentially facing more scrutiny due to its focus on gaming and NFTs
VI. Conclusion: Which Is the Better Buy?
📌 Investment Value Summary:
- GLQ advantages: Potential for growth in DeFi automation, multi-chain integration
- ENJ advantages: Established position in gaming NFTs, strong partnerships with gaming companies
✅ Investment Advice:
- Novice investors: Consider a smaller allocation to ENJ as part of a diversified crypto portfolio
- Experienced investors: Balanced approach with both GLQ and ENJ, focusing on their respective strengths
- Institutional investors: Larger allocation to ENJ due to its more established market position and ecosystem
⚠️ Risk Warning: The cryptocurrency market is highly volatile, and this article does not constitute investment advice. None
VII. FAQ
Q1: What are the main differences between GLQ and ENJ? A: GLQ focuses on DeFi automation and multi-chain infrastructure, while ENJ specializes in gaming NFTs and blockchain gaming ecosystems. ENJ has a more established market position and larger trading volume, whereas GLQ offers potential for growth in the DeFi sector.
Q2: Which token has performed better historically? A: ENJ has historically shown better performance, reaching an all-time high of $4.82 in November 2021. GLQ, being newer, has a lower all-time high of $0.19361 but also experienced significant declines during market downturns.
Q3: How do the supply mechanisms of GLQ and ENJ differ? A: GLQ has a fixed maximum supply of 100 billion tokens with issuance based on network activity. ENJ has a fixed supply of 1 billion tokens with a deflationary model through token burning when creating NFTs.
Q4: Which token is more suitable for long-term investment? A: ENJ may be more suitable for long-term investment due to its established position in the gaming NFT space and stronger institutional adoption. However, GLQ could offer potential for long-term growth in the DeFi automation sector.
Q5: What are the main risks associated with investing in GLQ and ENJ? A: For GLQ, main risks include higher volatility due to lower market cap, and technical risks related to scalability and network stability. For ENJ, risks include exposure to fluctuations in the gaming and NFT markets, and potential regulatory scrutiny due to its focus on gaming.
Q6: How might macroeconomic factors affect GLQ and ENJ differently? A: ENJ has shown stronger correlation with broader crypto market movements during high inflation periods and higher volatility in response to interest rate changes. GLQ's performance may be more influenced by specific developments in the DeFi sector.
Q7: What allocation strategy would you recommend for these tokens? A: For conservative investors, a suggested allocation could be 20% GLQ and 80% ENJ. For aggressive investors, this could shift to 40% GLQ and 60% ENJ. However, individual allocation should be based on personal risk tolerance and investment goals.
Share
Content
Introduction: Investment Comparison of GLQ vs ENJ
I. Price History Comparison and Current Market Status
II. Core Factors Affecting the Investment Value of GLQ vs ENJ
III. 2025-2030 Price Prediction: GLQ vs ENJ
IV. Investment Strategy Comparison: GLQ vs ENJ
V. Potential Risk Comparison
VI. Conclusion: Which Is the Better Buy?
VII. FAQ

