FITFI vs LTC: Comparing the Potential of Fitness Finance and Litecoin in the Cryptocurrency Market
Introduction: FITFI vs LTC Investment Comparison
In the cryptocurrency market, FITFI vs LTC comparison has always been an unavoidable topic for investors. The two not only have significant differences in market cap ranking, application scenarios, and price performance, but also represent different crypto asset positioning.
FITFI (FITFI): Since its launch, it has gained market recognition for its focus on fitness finance and geo-located "x to earn" products.
LTC (LTC): Since 2011, it has been hailed as the "silver to Bitcoin's gold" and is one of the most traded and highest market cap cryptocurrencies globally.
This article will comprehensively analyze the investment value comparison between FITFI and LTC, focusing on historical price trends, supply mechanisms, institutional adoption, technical ecosystems, and future predictions, and attempt to answer the question investors care about most:
"Which is the better buy right now?"
I. Price History Comparison and Current Market Situation
FITFI (Coin A) and LTC (Coin B) Historical Price Trends
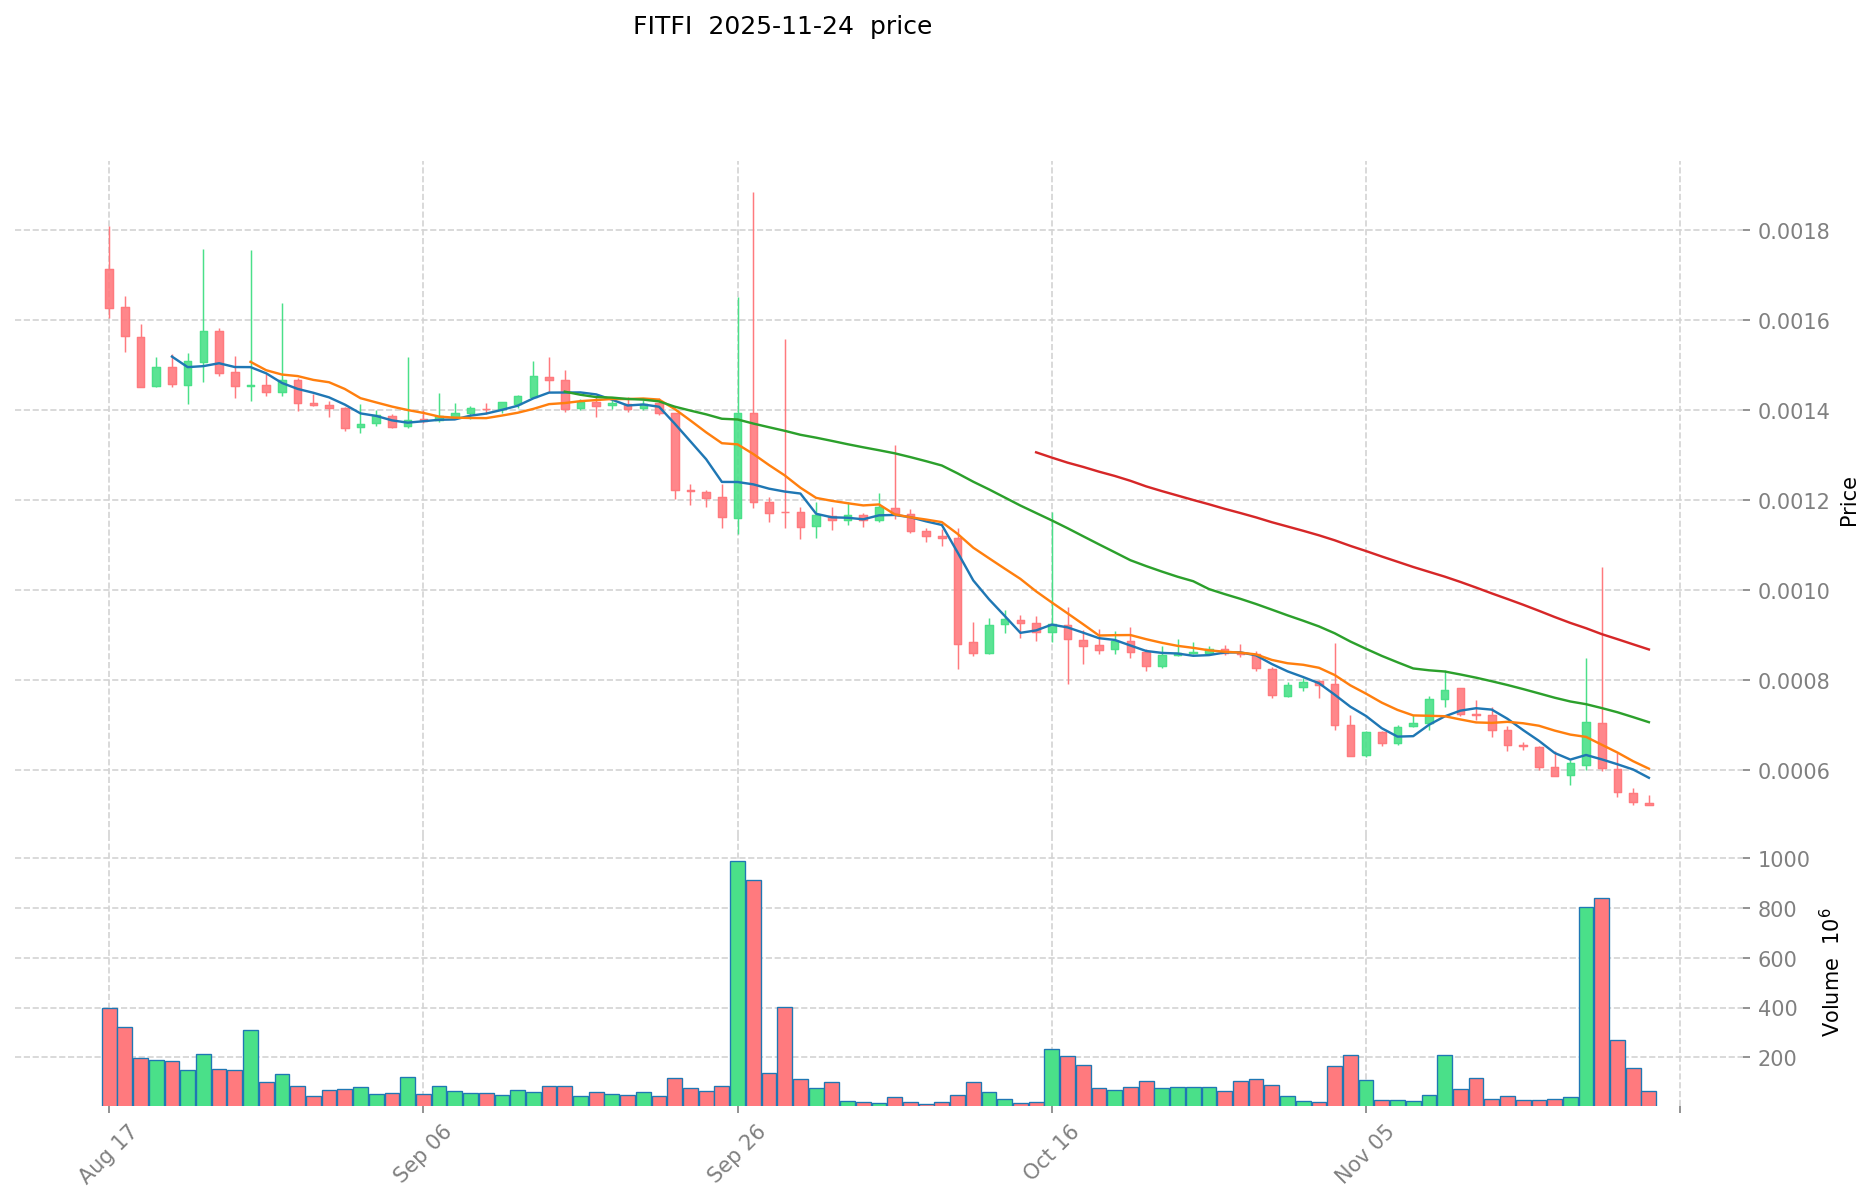
- 2022: FITFI reached its all-time high of $0.731881 on May 5, 2022, shortly after its launch.
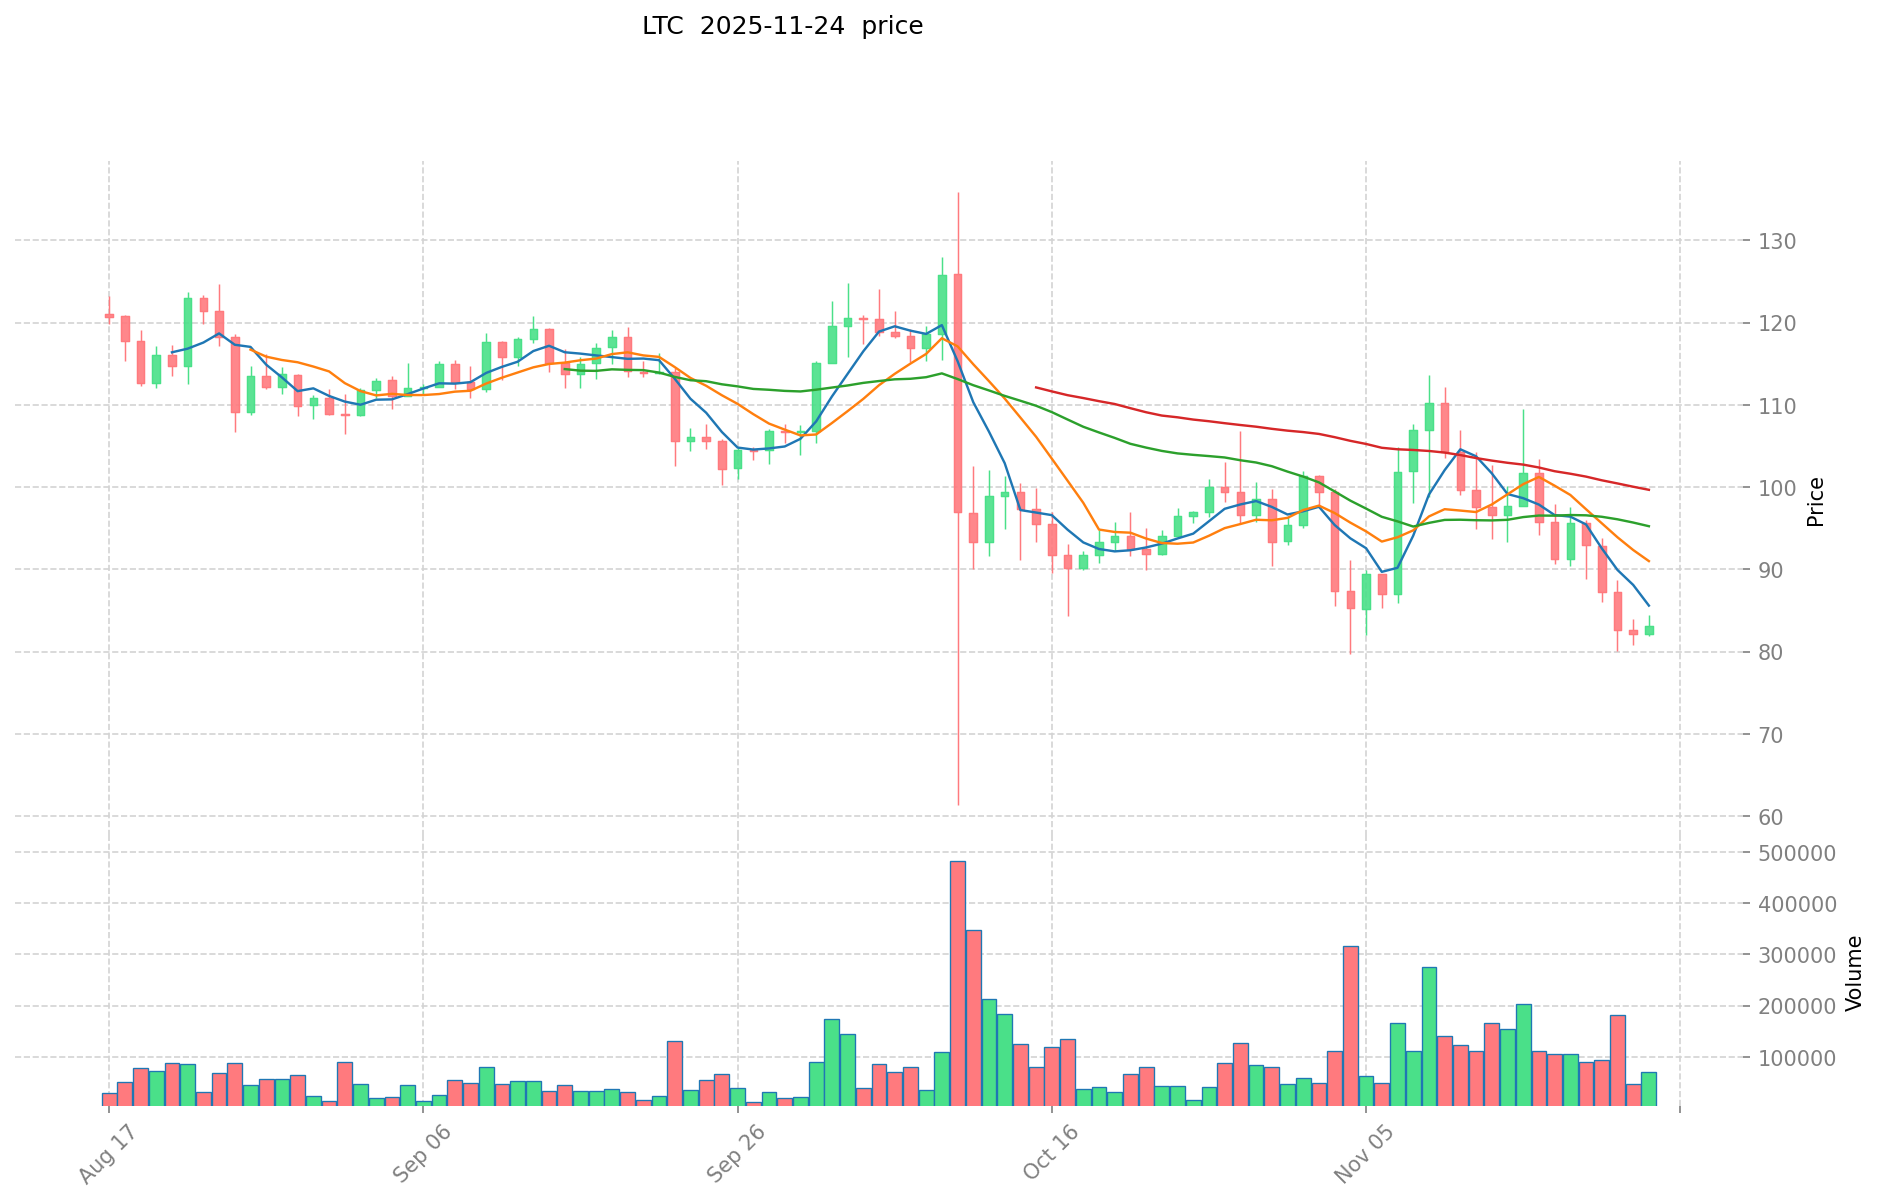
- 2021: LTC hit its all-time high of $410.26 on May 10, 2021, during the broader crypto market bull run.
- Comparative analysis: Since their respective peaks, FITFI has experienced a significant decline to its current price of $0.0005267, while LTC has also decreased but maintained a higher price level at $84.19.
Current Market Situation (2025-11-24)
- FITFI current price: $0.0005267
- LTC current price: $84.19
- 24-hour trading volume: FITFI $24,507.43 vs LTC $3,842,107.57
- Market Sentiment Index (Fear & Greed Index): 19 (Extreme Fear)
Click to view real-time prices:
- Check FITFI current price Market Price
- Check LTC current price Market Price
II. Core Factors Affecting Investment Value of FITFI vs LTC
Supply Mechanisms Comparison (Tokenomics)
- FITFI: Fixed total supply of 10 billion tokens with token burn mechanisms
- LTC: Fixed maximum supply of 84 million coins with halving mechanism every 4 years
- 📌 Historical Pattern: LTC's halving events have historically preceded price rallies, while FITFI's token burn may create deflationary pressure over time.
Institutional Adoption and Market Applications
- Institutional Holdings: LTC has significantly more institutional adoption, being listed on major exchanges and held in Grayscale's LTC Trust
- Enterprise Adoption: LTC is more widely used in payments and cross-border settlements, while FITFI remains primarily focused on the move-to-earn gaming ecosystem
- National Policies: LTC enjoys broader regulatory acceptance across multiple jurisdictions as one of the oldest cryptocurrencies
Technical Development and Ecosystem Building
- FITFI Technical Upgrades: Focusing on Step App development, NFT marketplace integration, and gamification features
- LTC Technical Development: MWEB (Mimblewimble Extension Block) implementation for improved privacy and scalability
- Ecosystem Comparison: LTC has a more established payment ecosystem and merchant adoption, while FITFI is building within the GameFi and move-to-earn niche
Macroeconomic Factors and Market Cycles
- Performance During Inflation: LTC has a longer track record as a potential inflation hedge due to its fixed supply and established market position
- Macroeconomic Monetary Policy: Interest rate changes appear to affect both assets similarly, with crypto markets generally reacting negatively to rate hikes
- Geopolitical Factors: LTC may benefit more from cross-border transaction demand due to its wider acceptance and established network
III. 2025-2030 Price Prediction: FITFI vs LTC
Short-term Prediction (2025)
- FITFI: Conservative $0.00035768 - $0.000526 | Optimistic $0.000526 - $0.00074166
- LTC: Conservative $76.1397 - $83.67 | Optimistic $83.67 - $118.8114
Mid-term Prediction (2027)
- FITFI may enter a growth phase, with estimated price range of $0.000396397282 - $0.001017170384
- LTC may enter a steady growth phase, with estimated price range of $69.527050725 - $127.639212525
- Key drivers: Institutional capital inflow, ETF, ecosystem development
Long-term Prediction (2030)
- FITFI: Base scenario $0.001175682177877 - $0.00143433225701 | Optimistic scenario $0.00143433225701
- LTC: Base scenario $106.717464490329 - $169.3928007783 | Optimistic scenario $176.168512809432
Disclaimer: This analysis is based on historical data and market projections. Cryptocurrency markets are highly volatile and unpredictable. This information should not be considered as financial advice. Always conduct your own research before making investment decisions.
FITFI:
| 年份 | 预测最高价 | 预测平均价格 | 预测最低价 | 涨跌幅 |
|---|---|---|---|---|
| 2025 | 0.00074166 | 0.000526 | 0.00035768 | 0 |
| 2026 | 0.0008620088 | 0.00063383 | 0.0005831236 | 20 |
| 2027 | 0.001017170384 | 0.0007479194 | 0.000396397282 | 42 |
| 2028 | 0.00131499188908 | 0.000882544892 | 0.00059130507764 | 67 |
| 2029 | 0.001252595965215 | 0.00109876839054 | 0.000648273350418 | 108 |
| 2030 | 0.00143433225701 | 0.001175682177877 | 0.000964059385859 | 123 |
LTC:
| 年份 | 预测最高价 | 预测平均价格 | 预测最低价 | 涨跌幅 |
|---|---|---|---|---|
| 2025 | 118.8114 | 83.67 | 76.1397 | 0 |
| 2026 | 106.302735 | 101.2407 | 54.669978 | 20 |
| 2027 | 127.639212525 | 103.7717175 | 69.527050725 | 23 |
| 2028 | 166.615869618 | 115.7054650125 | 91.407317359875 | 37 |
| 2029 | 197.62493424135 | 141.16066731525 | 73.40354700393 | 67 |
| 2030 | 176.168512809432 | 169.3928007783 | 106.717464490329 | 101 |
IV. Investment Strategy Comparison: FITFI vs LTC
Long-term vs Short-term Investment Strategy
- FITFI: Suitable for investors focused on GameFi and move-to-earn potential
- LTC: Suitable for investors seeking stability and inflationary hedge properties
Risk Management and Asset Allocation
- Conservative investors: FITFI: 10% vs LTC: 90%
- Aggressive investors: FITFI: 30% vs LTC: 70%
- Hedging tools: Stablecoin allocation, options, cross-currency portfolio
V. Potential Risk Comparison
Market Risk
- FITFI: Higher volatility, less liquidity, and potential for rapid price swings
- LTC: Subject to broader crypto market trends, but with more established market presence
Technical Risk
- FITFI: Scalability, network stability, and ecosystem development challenges
- LTC: Mining centralization, potential security vulnerabilities
Regulatory Risk
- Global regulatory policies may impact both, with LTC potentially facing less scrutiny due to its longer history and wider adoption
VI. Conclusion: Which Is the Better Buy?
📌 Investment Value Summary:
- FITFI advantages: Growth potential in GameFi sector, deflationary tokenomics
- LTC advantages: Established history, wider adoption, potential as digital silver
✅ Investment Advice:
- New investors: Consider LTC for its established market position and lower volatility
- Experienced investors: Balanced portfolio with both, leaning towards LTC for stability
- Institutional investors: Focus on LTC due to regulatory clarity and market liquidity
⚠️ Risk Warning: The cryptocurrency market is highly volatile. This article does not constitute investment advice. None
VII. FAQ
Q1: What are the main differences between FITFI and LTC? A: FITFI focuses on fitness finance and move-to-earn products, while LTC is a more established cryptocurrency often referred to as "digital silver". LTC has a longer history, wider adoption, and larger market cap, whereas FITFI is newer with potential for growth in the GameFi sector.
Q2: Which coin has performed better historically? A: LTC has a longer track record and reached its all-time high of $410.26 in May 2021. FITFI, being newer, reached its all-time high of $0.731881 in May 2022. However, both have experienced significant declines since their peaks, with LTC maintaining a higher price level.
Q3: How do the supply mechanisms of FITFI and LTC compare? A: FITFI has a fixed total supply of 10 billion tokens with token burn mechanisms. LTC has a fixed maximum supply of 84 million coins with a halving mechanism every 4 years. LTC's halving events have historically preceded price rallies.
Q4: Which coin has more institutional adoption? A: LTC has significantly more institutional adoption, being listed on major exchanges and held in Grayscale's LTC Trust. It's also more widely used in payments and cross-border settlements, while FITFI remains primarily focused on its move-to-earn gaming ecosystem.
Q5: What are the price predictions for FITFI and LTC by 2030? A: For FITFI, the base scenario predicts a range of $0.001175682177877 - $0.00143433225701. For LTC, the base scenario predicts a range of $106.717464490329 - $169.3928007783. However, these are projections and actual prices may vary significantly.
Q6: How should investors allocate their portfolio between FITFI and LTC? A: Conservative investors might consider allocating 10% to FITFI and 90% to LTC, while more aggressive investors might allocate 30% to FITFI and 70% to LTC. The exact allocation should depend on individual risk tolerance and investment goals.
Q7: What are the main risks associated with investing in FITFI and LTC? A: FITFI faces higher volatility, less liquidity, and potential rapid price swings. It also has technical risks related to scalability and ecosystem development. LTC, while more stable, is subject to broader crypto market trends and potential mining centralization risks. Both face regulatory risks, though LTC may face less scrutiny due to its longer history.
Share
Content
Introduction: FITFI vs LTC Investment Comparison
I. Price History Comparison and Current Market Situation
II. Core Factors Affecting Investment Value of FITFI vs LTC
III. 2025-2030 Price Prediction: FITFI vs LTC
IV. Investment Strategy Comparison: FITFI vs LTC
V. Potential Risk Comparison
VI. Conclusion: Which Is the Better Buy?
VII. FAQ

