DIAM vs TRX: Comparing Two Popular Cryptocurrency Tokens for Long-Term Investment
Introduction: DIAM vs TRX Investment Comparison
In the cryptocurrency market, the comparison between DIAM and TRX has been a topic that investors cannot ignore. The two not only differ significantly in market cap ranking, application scenarios, and price performance but also represent different positions in the crypto asset landscape.
Diamante (DIAM): Since its launch, it has gained market recognition for its aim to democratize the digital economy through a secure, scalable, and inclusive blockchain ecosystem.
TRON (TRX): Introduced in 2017, it has been hailed as a platform for building a decentralized internet and has become one of the largest public blockchains by market capitalization and trading volume globally.
This article will provide a comprehensive analysis of the investment value comparison between DIAM and TRX, focusing on historical price trends, supply mechanisms, institutional adoption, technological ecosystems, and future predictions, attempting to answer the question investors are most concerned about:
"Which is the better buy right now?"
I. Price History Comparison and Current Market Status
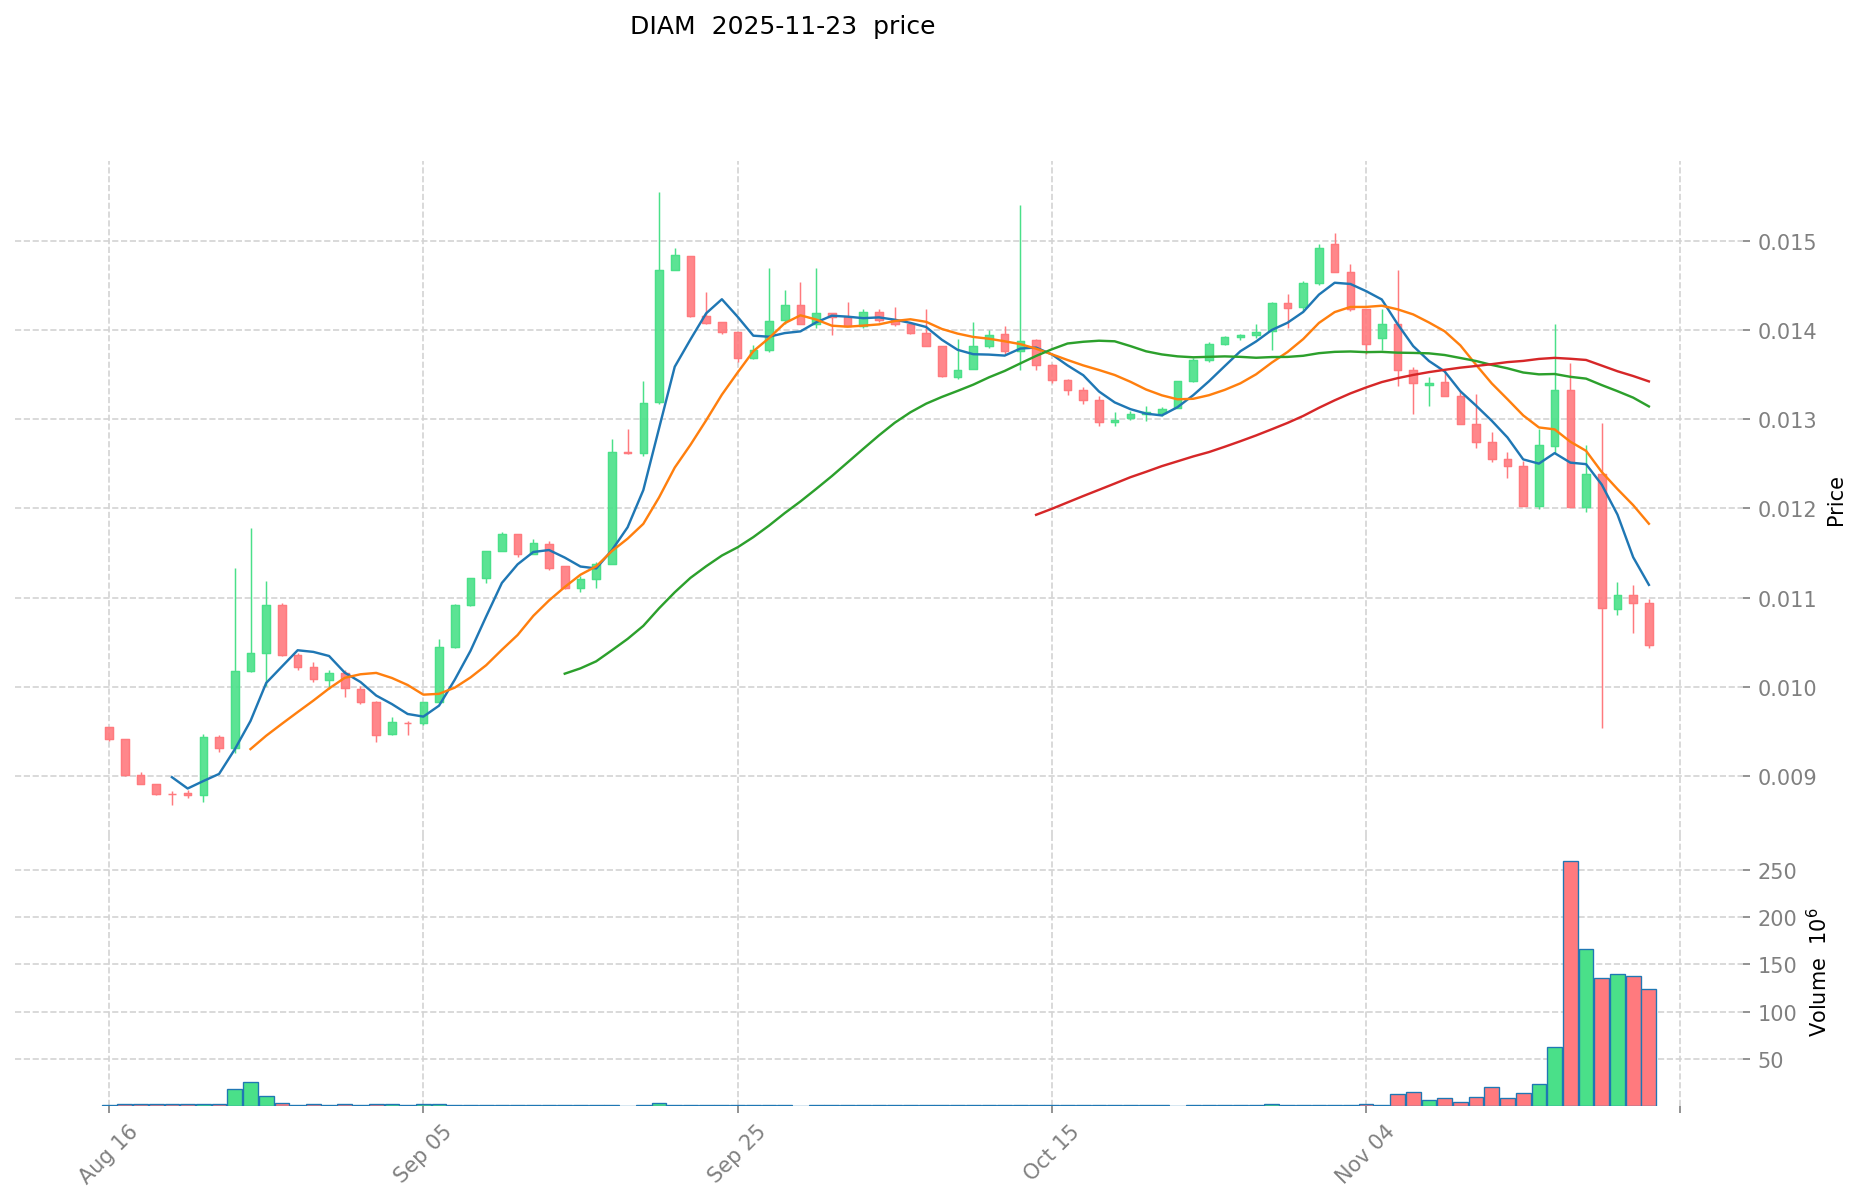
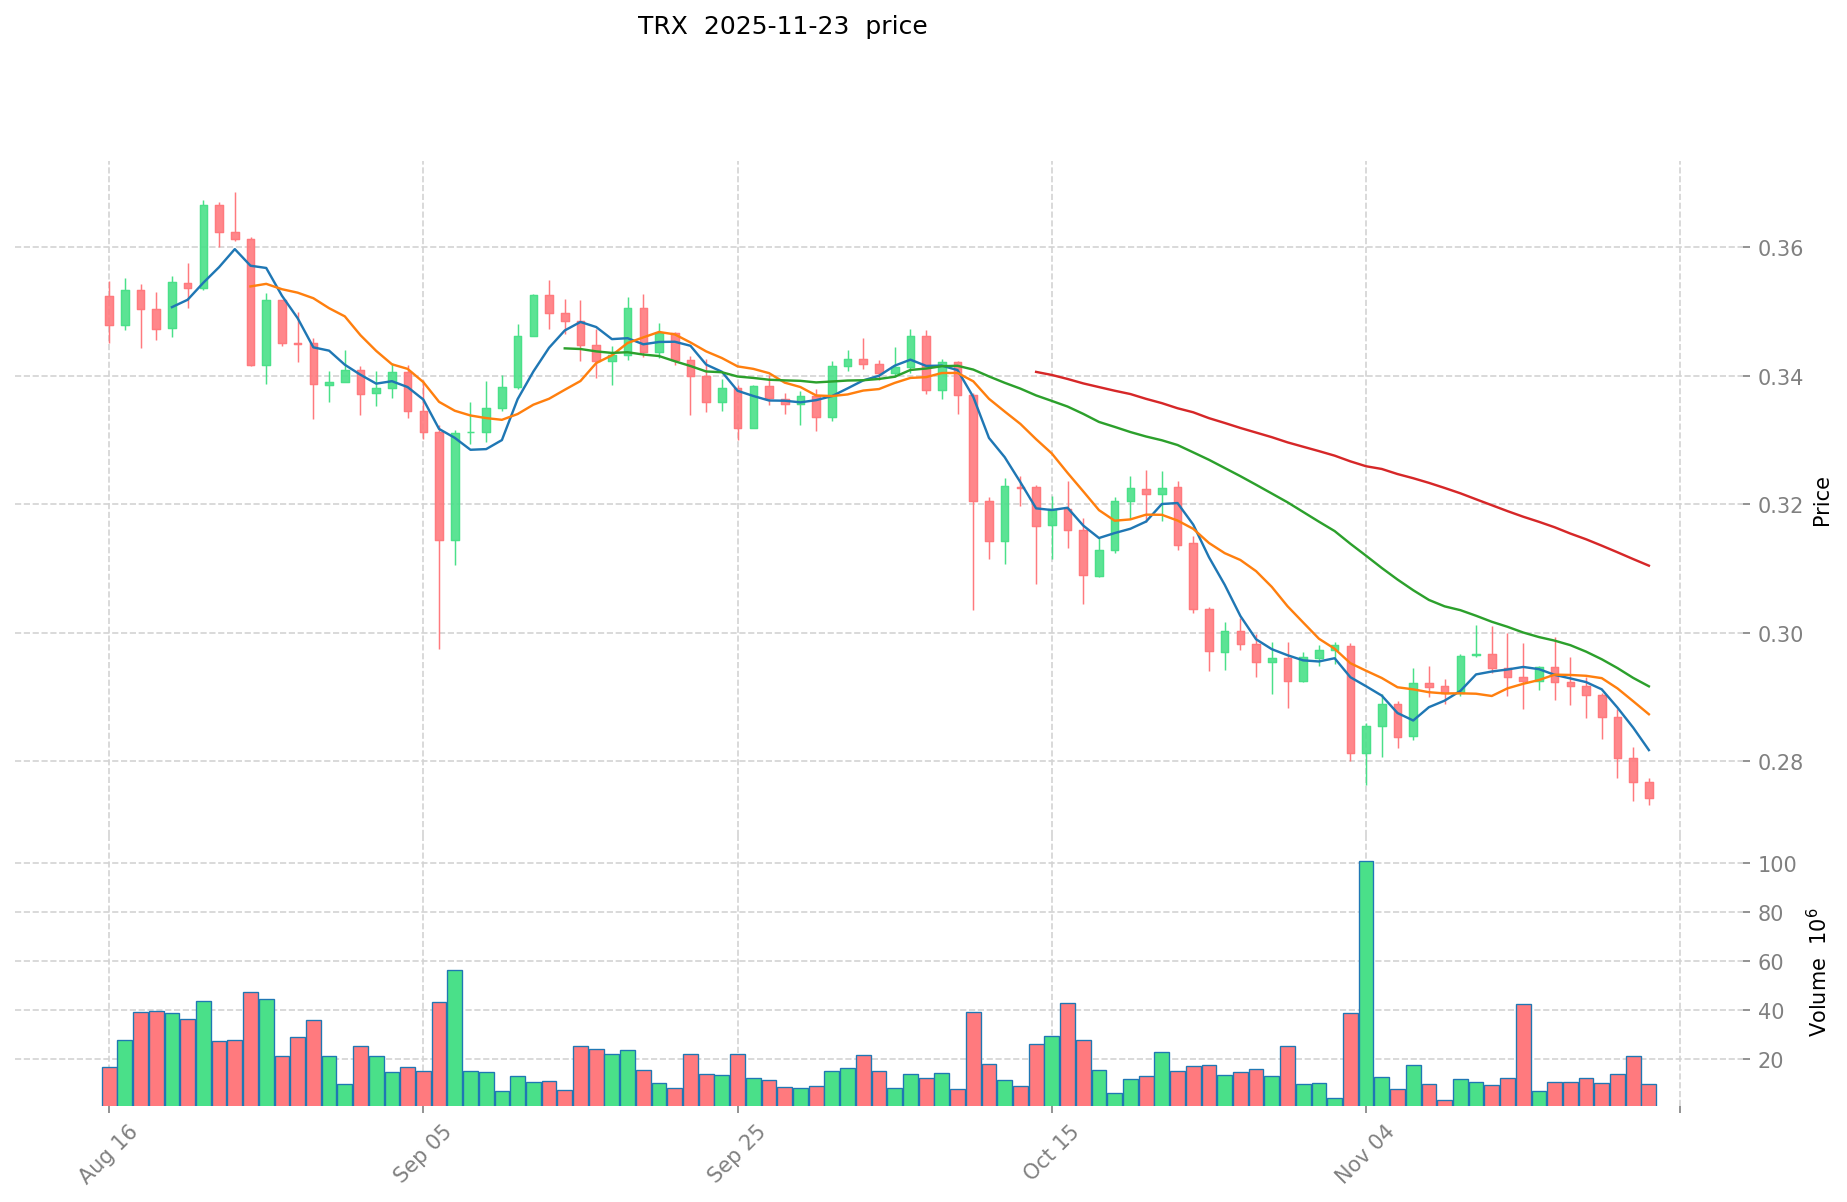
DIAM (Coin A) and TRX (Coin B) Historical Price Trends
- 2025: DIAM reached its all-time high of $0.05 on February 12, 2025, but subsequently experienced a significant decline.
- 2024: TRX achieved its all-time high of $0.431288 on December 4, 2024, demonstrating strong performance.
- Comparative analysis: In the recent market cycle, DIAM dropped from its high of $0.05 to a low of $0.00673, while TRX has shown more resilience, maintaining a higher price level.
Current Market Situation (2025-11-23)
- DIAM current price: $0.010487
- TRX current price: $0.2744
- 24-hour trading volume: DIAM $1,354,046.95 vs TRX $2,773,373.04
- Market Sentiment Index (Fear & Greed Index): 13 (Extreme Fear)
Click to view real-time prices:
- Check DIAM current price Market Price
- Check TRX current price Market Price
II. Core Factors Affecting DIAM vs TRX Investment Value
Supply Mechanism Comparison (Tokenomics)
- DIAM: Fixed maximum supply of 10 billion tokens, with 59.14% of tokens already in circulation. Features a deflationary model through token burning mechanisms.
- TRX: Total supply of approximately 88.9 billion tokens with 89.84% in circulation. Uses an inflationary model with rewards for network participation.
- 📌 Historical Pattern: Deflationary models like DIAM's tend to create upward price pressure over time, while TRX's inflationary approach prioritizes network participation and governance.
Institutional Adoption and Market Applications
- Institutional Holdings: TRX has broader institutional recognition due to its longer market presence since 2017, while DIAM as a newer asset is still building institutional relationships.
- Enterprise Adoption: TRX has established more extensive enterprise applications within its TRON ecosystem, particularly in entertainment and content industries. DIAM focuses on cross-border payment solutions and financial applications.
- National Policies: Both face varying regulatory scrutiny across jurisdictions, with TRX experiencing more regulatory challenges in certain markets due to its higher profile.
Technical Development and Ecosystem Building
- DIAM Technical Upgrades: Implementing advanced security features and cross-chain interoperability to enhance its utility in decentralized finance.
- TRX Technical Development: Continuous development of the TRON network with focus on scaling solutions and DApp infrastructure, having processed over 5.6 billion transactions.
- Ecosystem Comparison: TRX offers a more mature ecosystem with extensive DApp support, particularly in gaming and entertainment. DIAM is developing partnerships for DeFi applications and payment solutions but at an earlier stage of ecosystem development.
Macroeconomic Factors and Market Cycles
- Inflation Environment Performance: DIAM's deflationary model potentially offers better inflation resistance, while TRX's utility focus may provide different value propositions during inflationary periods.
- Macroeconomic Monetary Policy: Both assets demonstrate sensitivity to broader crypto market trends influenced by interest rates and dollar strength.
- Geopolitical Factors: TRX has broader global distribution and adoption, particularly in Asian markets, while DIAM is working to establish cross-border transaction utility.
III. 2025-2030 Price Prediction: DIAM vs TRX
Short-term Prediction (2025)
- DIAM: Conservative $0.0094365 - $0.010485 | Optimistic $0.010485 - $0.0127917
- TRX: Conservative $0.15372 - $0.2745 | Optimistic $0.2745 - $0.31842
Mid-term Prediction (2027)
- DIAM may enter a growth phase, with prices expected in the range of $0.01034882082 - $0.0191165717925
- TRX may enter a steady growth phase, with prices expected in the range of $0.194403645 - $0.430237575
- Key drivers: Institutional capital inflow, ETF, ecosystem development
Long-term Prediction (2030)
- DIAM: Base scenario $0.021282015835657 - $0.027453800427998 | Optimistic scenario $0.027453800427998+
- TRX: Base scenario $0.45295411896 - $0.4710722837184 | Optimistic scenario $0.4710722837184+
Disclaimer: This analysis is based on historical data and market projections. Cryptocurrency markets are highly volatile and unpredictable. This information should not be considered as financial advice. Always conduct your own research before making investment decisions.
DIAM:
| 年份 | 预测最高价 | 预测平均价格 | 预测最低价 | 涨跌幅 |
|---|---|---|---|---|
| 2025 | 0.0127917 | 0.010485 | 0.0094365 | 0 |
| 2026 | 0.0171083745 | 0.01163835 | 0.006284709 | 10 |
| 2027 | 0.0191165717925 | 0.01437336225 | 0.01034882082 | 37 |
| 2028 | 0.020428859765925 | 0.01674496702125 | 0.0107167788936 | 59 |
| 2029 | 0.023977118277727 | 0.018586913393587 | 0.01170975543796 | 77 |
| 2030 | 0.027453800427998 | 0.021282015835657 | 0.011279468392898 | 102 |
TRX:
| 年份 | 预测最高价 | 预测平均价格 | 预测最低价 | 涨跌幅 |
|---|---|---|---|---|
| 2025 | 0.31842 | 0.2745 | 0.15372 | 0 |
| 2026 | 0.340929 | 0.29646 | 0.2104866 | 8 |
| 2027 | 0.430237575 | 0.3186945 | 0.194403645 | 16 |
| 2028 | 0.4643378865 | 0.3744660375 | 0.2246796225 | 36 |
| 2029 | 0.48650627592 | 0.419401962 | 0.21389500062 | 52 |
| 2030 | 0.4710722837184 | 0.45295411896 | 0.317067883272 | 65 |
IV. Investment Strategy Comparison: DIAM vs TRX
Long-term vs Short-term Investment Strategies
- DIAM: Suitable for investors focused on cross-border payment solutions and DeFi potential
- TRX: Suitable for investors seeking established ecosystem and entertainment industry applications
Risk Management and Asset Allocation
- Conservative investors: DIAM 30% vs TRX 70%
- Aggressive investors: DIAM 60% vs TRX 40%
- Hedging tools: Stablecoin allocation, options, cross-currency portfolio
V. Potential Risk Comparison
Market Risk
- DIAM: Higher volatility due to lower market cap and trading volume
- TRX: Susceptible to broader crypto market trends and sentiment shifts
Technical Risk
- DIAM: Scalability, network stability
- TRX: Hash power concentration, security vulnerabilities
Regulatory Risk
- Global regulatory policies have different impacts on both assets, with TRX potentially facing more scrutiny due to its larger market presence
VI. Conclusion: Which Is the Better Buy?
📌 Investment Value Summary:
- DIAM advantages: Deflationary model, focus on cross-border payments and DeFi applications
- TRX advantages: Established ecosystem, high transaction volume, strong presence in entertainment industry
✅ Investment Advice:
- New investors: Consider a balanced approach with a slight bias towards TRX due to its established market position
- Experienced investors: Explore DIAM for potential growth while maintaining TRX exposure
- Institutional investors: Evaluate DIAM for long-term potential, while leveraging TRX's established ecosystem for immediate applications
⚠️ Risk Warning: The cryptocurrency market is highly volatile, and this article does not constitute investment advice. None
VII. FAQ
Q1: What are the main differences between DIAM and TRX in terms of supply mechanisms? A: DIAM has a fixed maximum supply of 10 billion tokens with a deflationary model through token burning, while TRX has a total supply of approximately 88.9 billion tokens with an inflationary model that rewards network participation.
Q2: Which cryptocurrency has shown better price performance in recent market cycles? A: TRX has shown more resilience in recent market cycles, maintaining a higher price level compared to DIAM, which experienced a significant decline from its all-time high.
Q3: How do DIAM and TRX compare in terms of institutional adoption? A: TRX has broader institutional recognition due to its longer market presence since 2017, while DIAM, being a newer asset, is still building institutional relationships.
Q4: What are the key focus areas for DIAM and TRX in terms of applications? A: DIAM focuses on cross-border payment solutions and financial applications, while TRX has established extensive enterprise applications within its ecosystem, particularly in entertainment and content industries.
Q5: How do the long-term price predictions for DIAM and TRX compare? A: By 2030, DIAM's base scenario predicts a range of $0.021282015835657 - $0.027453800427998, while TRX's base scenario predicts a range of $0.45295411896 - $0.4710722837184.
Q6: What are the main risk factors to consider when investing in DIAM and TRX? A: For DIAM, key risks include higher volatility due to lower market cap and trading volume, as well as potential scalability issues. For TRX, risks include susceptibility to broader crypto market trends and potential regulatory scrutiny due to its larger market presence.
Q7: How should investors approach asset allocation between DIAM and TRX? A: Conservative investors might consider allocating 30% to DIAM and 70% to TRX, while aggressive investors could opt for 60% DIAM and 40% TRX. This should be adjusted based on individual risk tolerance and investment goals.
Share
Content
Introduction: DIAM vs TRX Investment Comparison
I. Price History Comparison and Current Market Status
II. Core Factors Affecting DIAM vs TRX Investment Value
III. 2025-2030 Price Prediction: DIAM vs TRX
IV. Investment Strategy Comparison: DIAM vs TRX
V. Potential Risk Comparison
VI. Conclusion: Which Is the Better Buy?
VII. FAQ

