DELABS vs ATOM: The Battle of Innovative AI Platforms Reshaping the Future of Technology
Introduction: DELABS vs ATOM Investment Comparison
In the cryptocurrency market, the comparison between DELABS and ATOM has always been an unavoidable topic for investors. The two not only show significant differences in market cap ranking, application scenarios, and price performance, but also represent different positioning in crypto assets.
DELABS (DELABS): Since its launch, it has gained market recognition for its position as the world's most scalable Web3 gaming platform.
ATOM (ATOM): Since 2019, it has been hailed as the "Internet of Blockchains," and is one of the cryptocurrencies with significant global trading volume and market capitalization.
This article will provide a comprehensive analysis of the investment value comparison between DELABS and ATOM, focusing on historical price trends, supply mechanisms, institutional adoption, technological ecosystems, and future predictions, attempting to answer the question most concerned by investors:
"Which is the better buy right now?"
I. Price History Comparison and Current Market Status
DELABS (Coin A) and ATOM (Coin B) Historical Price Trends
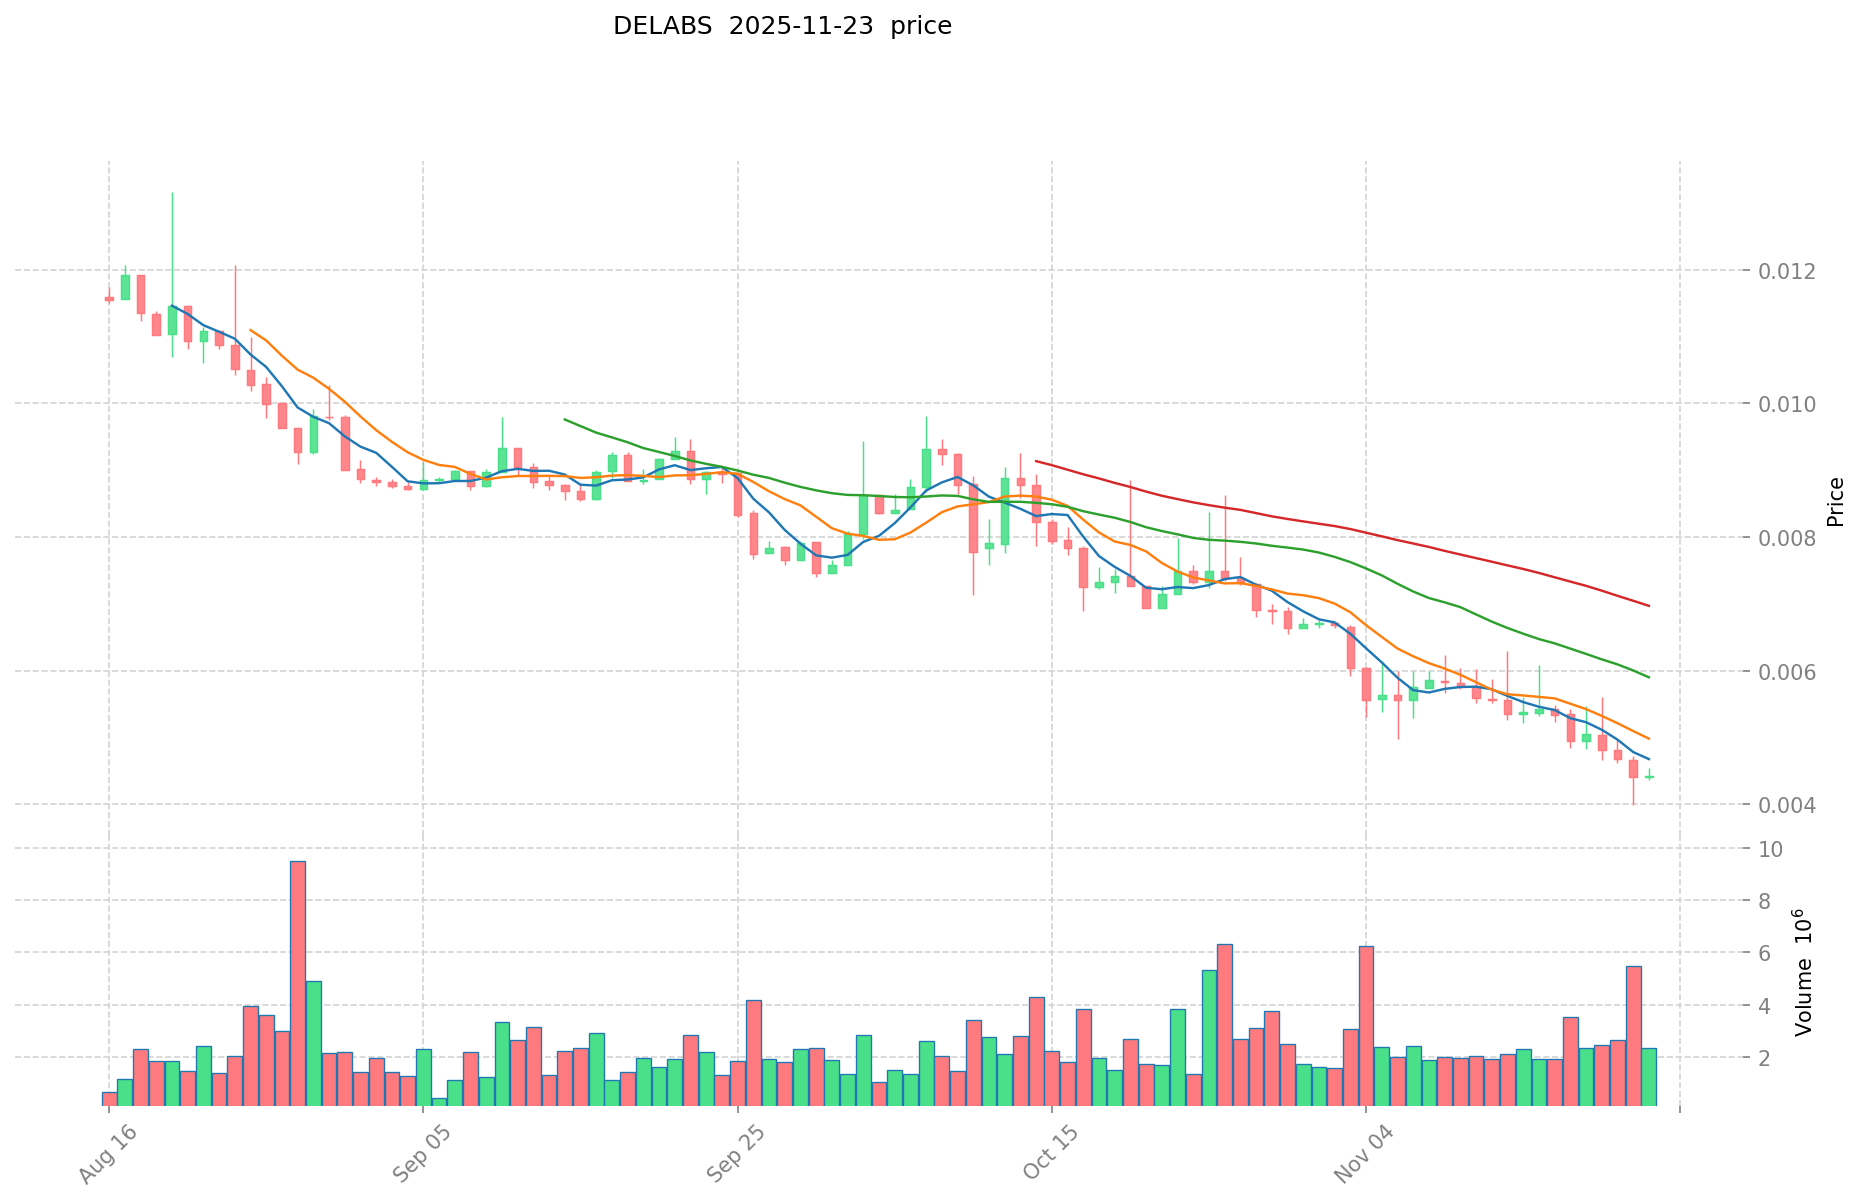
- 2025: DELABS reached its all-time high of $1.00005 on August 6, 2025, but has since experienced a significant decline.
- 2022: ATOM hit its all-time high of $44.45 on January 17, 2022, showing strong performance during the bull market.
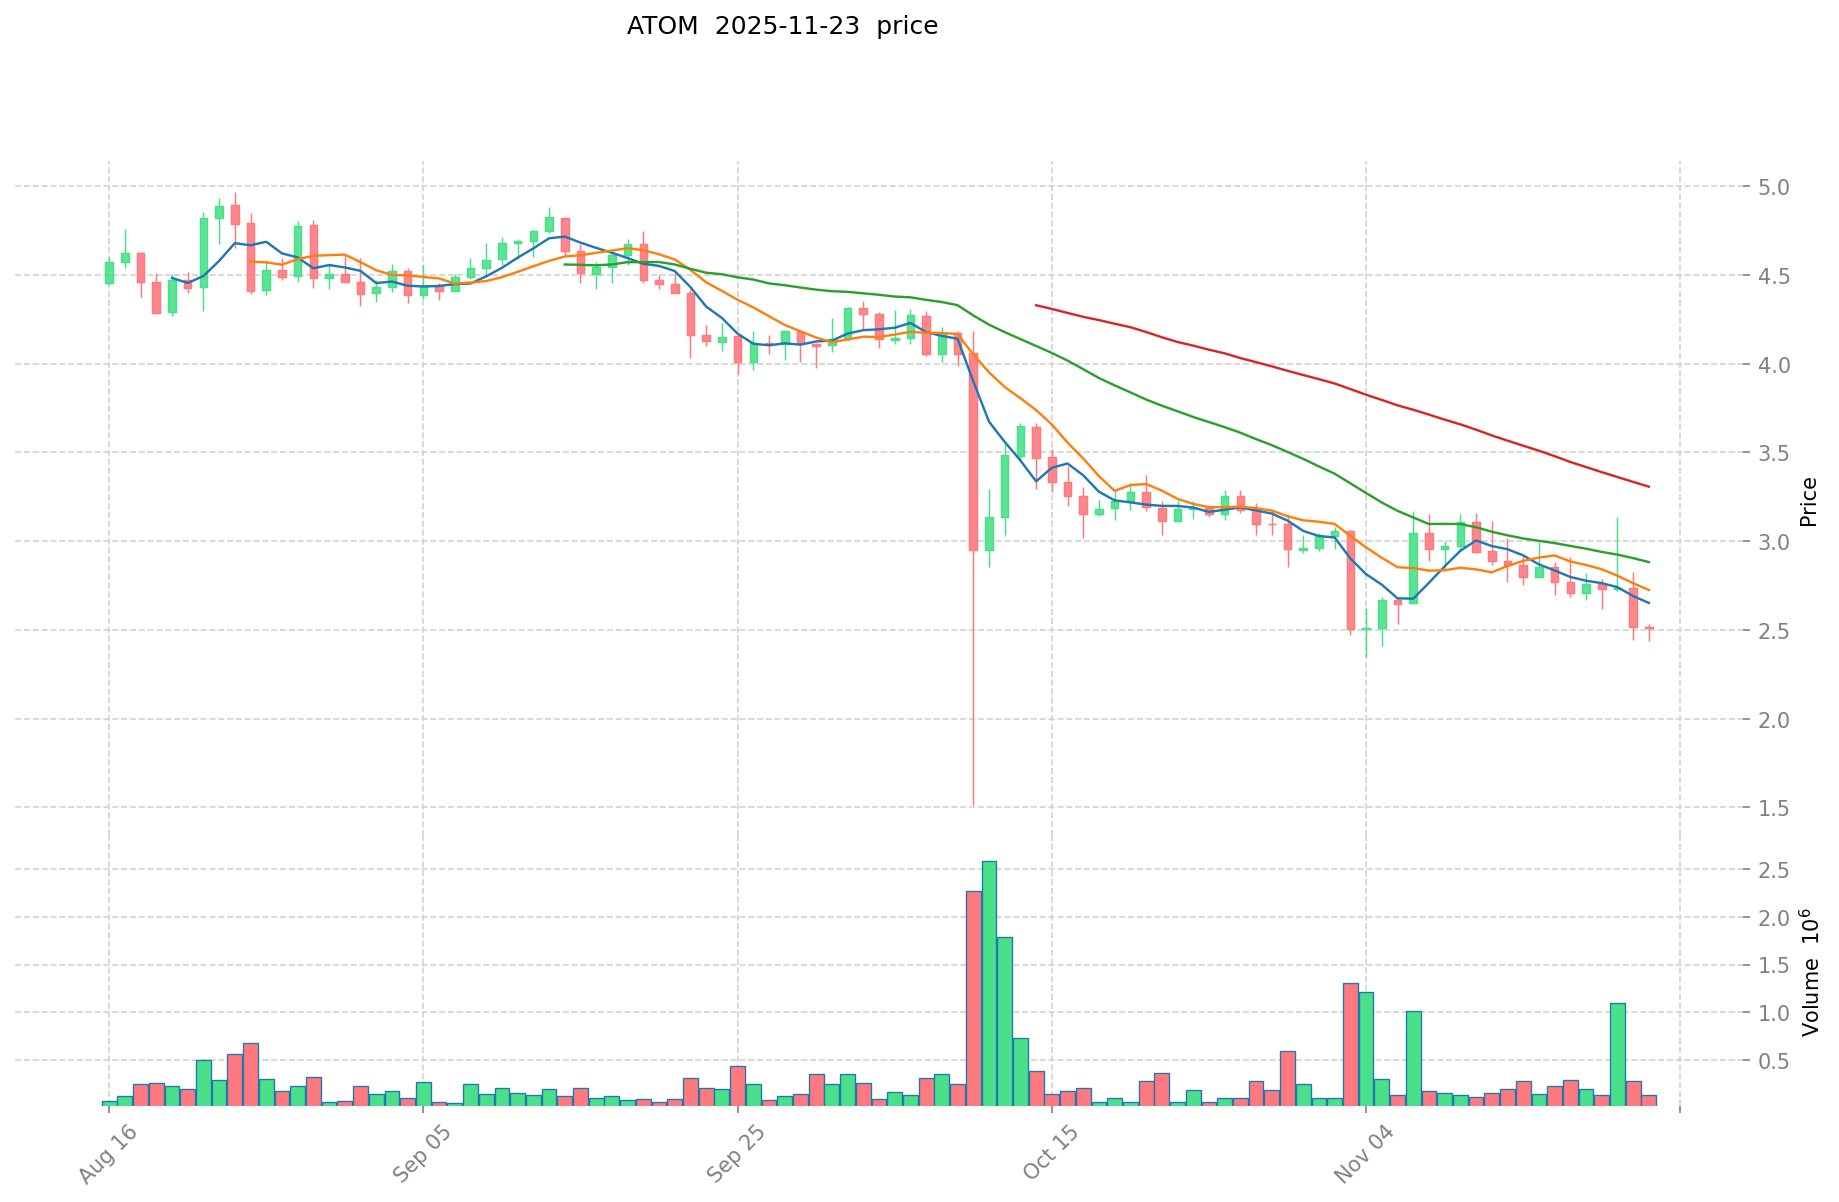
- Comparative analysis: In the current market cycle, DELABS has dropped from its all-time high of $1.00005 to a current price of $0.004501, while ATOM has fallen from its peak of $44.45 to $2.542.
Current Market Situation (2025-11-23)
- DELABS current price: $0.004501
- ATOM current price: $2.542
- 24-hour trading volume: DELABS $11,149.67 vs ATOM $181,664.49
- Market Sentiment Index (Fear & Greed Index): 13 (Extreme Fear)
Click to view real-time prices:
- View DELABS current price Market Price
- View ATOM current price Market Price
II. Key Factors Affecting Investment Value of DELABS vs ATOM
Supply Mechanisms Comparison (Tokenomics)
- DELABS: Initial supply of 10,000,000 DELABS tokens, with no public sale or pre-mine. 2.5% of tokens allocated to advisors.
- ATOM: Inflationary model with no maximum supply. Annual inflation ranges between 7% to 20%, targeting approximately 10% annually.
- 📌 Historical Pattern: Fixed supply models like DELABS tend to create scarcity value, while ATOM's inflation-based model focuses on incentivizing network participation through staking rewards.
Institutional Adoption and Market Applications
- Institutional Holdings: Limited information available on institutional holdings for both tokens at present.
- Enterprise Adoption: ATOM has broader enterprise adoption through the Cosmos ecosystem, powering interoperable blockchain networks across multiple industries. DELABS adoption appears more focused on AI and analytics tools.
- Regulatory Attitudes: Both tokens operate in evolving regulatory environments; specific country-by-country policies not detailed in available information.
Technical Development and Ecosystem Building
- DELABS Technical Development: Focus on AI-powered tools for crypto analytics and trading, with a recent shift toward providing security infrastructure for the crypto market.
- ATOM Technical Development: Continuous development of the Cosmos Hub as a cross-chain infrastructure with IBC (Inter-Blockchain Communication) protocol enabling interoperability across independent blockchains.
- Ecosystem Comparison: ATOM has a more established ecosystem with numerous sovereign blockchains built using Cosmos SDK, supporting DeFi protocols, NFT platforms, and payment systems. DELABS appears to be focused on analytics tools and security infrastructure rather than a broad DeFi ecosystem.
Macroeconomic Factors and Market Cycles
- Inflation Performance: Insufficient historical data available for comprehensive analysis of inflation-resistant properties of either token.
- Macroeconomic Monetary Policy: Both tokens, like most cryptocurrencies, are likely affected by broader market sentiment around Federal Reserve decisions and dollar strength.
- Geopolitical Factors: ATOM's cross-chain infrastructure potentially offers advantages for cross-border transactions, though specific data on usage patterns is not available in the reference materials.
III. 2025-2030 Price Prediction: DELABS vs ATOM
Short-term Prediction (2025)
- DELABS: Conservative $0.00297066 - $0.004501 | Optimistic $0.004501 - $0.00612136
- ATOM: Conservative $2.20893 - $2.539 | Optimistic $2.539 - $2.81829
Mid-term Prediction (2027)
- DELABS may enter a growth phase, with prices estimated between $0.004308429216 and $0.007677841808
- ATOM may enter a steady growth phase, with prices estimated between $2.21939131475 and $3.13146993725
- Key drivers: Institutional capital inflow, ETF, ecosystem development
Long-term Prediction (2030)
- DELABS: Base scenario $0.008502571132965 - $0.011818573874821 | Optimistic scenario $0.011818573874821+
- ATOM: Base scenario $3.928461719097431 - $5.578415641118352 | Optimistic scenario $5.578415641118352+
Disclaimer: The above predictions are based on historical data and market analysis. Cryptocurrency markets are highly volatile and subject to change. This information should not be considered as financial advice. Always conduct your own research before making investment decisions.
DELABS:
| 年份 | 预测最高价 | 预测平均价格 | 预测最低价 | 涨跌幅 |
|---|---|---|---|---|
| 2025 | 0.00612136 | 0.004501 | 0.00297066 | 0 |
| 2026 | 0.0057360744 | 0.00531118 | 0.0030273726 | 18 |
| 2027 | 0.007677841808 | 0.0055236272 | 0.004308429216 | 22 |
| 2028 | 0.00825091813 | 0.006600734504 | 0.00369641132224 | 46 |
| 2029 | 0.00957931594893 | 0.007425826317 | 0.00393568794801 | 64 |
| 2030 | 0.011818573874821 | 0.008502571132965 | 0.005951799793075 | 88 |
ATOM:
| 年份 | 预测最高价 | 预测平均价格 | 预测最低价 | 涨跌幅 |
|---|---|---|---|---|
| 2025 | 2.81829 | 2.539 | 2.20893 | 0 |
| 2026 | 3.40187915 | 2.678645 | 1.41968185 | 5 |
| 2027 | 3.13146993725 | 3.040262075 | 2.21939131475 | 19 |
| 2028 | 3.30187662655375 | 3.085866006125 | 1.69722630336875 | 21 |
| 2029 | 4.663052121855487 | 3.193871316339375 | 1.628874371333081 | 25 |
| 2030 | 5.578415641118352 | 3.928461719097431 | 3.614184781569636 | 54 |
IV. Investment Strategy Comparison: DELABS vs ATOM
Long-term vs Short-term Investment Strategies
- DELABS: Suitable for investors focused on AI-powered analytics and security infrastructure in the crypto market
- ATOM: Suitable for investors interested in cross-chain infrastructure and broader ecosystem development
Risk Management and Asset Allocation
- Conservative investors: DELABS: 20% vs ATOM: 80%
- Aggressive investors: DELABS: 40% vs ATOM: 60%
- Hedging tools: Stablecoin allocation, options, cross-currency portfolios
V. Potential Risk Comparison
Market Risks
- DELABS: High volatility due to lower market cap and trading volume
- ATOM: Susceptible to broader crypto market trends and sentiment
Technical Risks
- DELABS: Scalability, network stability
- ATOM: Validator concentration, potential security vulnerabilities in IBC protocol
Regulatory Risks
- Global regulatory policies may impact both tokens differently, with ATOM potentially facing more scrutiny due to its cross-chain nature
VI. Conclusion: Which Is the Better Buy?
📌 Investment Value Summary:
- DELABS advantages: Focused niche in AI-powered crypto analytics and security infrastructure
- ATOM advantages: Established ecosystem, interoperability solutions, and broader adoption
✅ Investment Advice:
- Novice investors: Consider a higher allocation to ATOM due to its more established ecosystem and market presence
- Experienced investors: Balanced approach with both tokens, leveraging DELABS for potential high growth and ATOM for ecosystem exposure
- Institutional investors: Focus on ATOM for its cross-chain infrastructure potential, with a smaller allocation to DELABS for diversification
⚠️ Risk Warning: Cryptocurrency markets are highly volatile. This article does not constitute investment advice. None
VII. FAQ
Q1: What are the main differences between DELABS and ATOM? A: DELABS focuses on AI-powered crypto analytics and security infrastructure, while ATOM is known for its cross-chain interoperability and broader ecosystem development. DELABS has a fixed supply, whereas ATOM has an inflationary model.
Q2: Which token has shown better price performance historically? A: ATOM has shown stronger historical price performance, reaching an all-time high of $44.45 in January 2022. DELABS reached its all-time high of $1.00005 in August 2025 but has since experienced a significant decline.
Q3: How do the supply mechanisms of DELABS and ATOM differ? A: DELABS has a fixed initial supply of 10,000,000 tokens with no public sale or pre-mine. ATOM has an inflationary model with no maximum supply, with annual inflation ranging between 7% to 20%.
Q4: Which token has better institutional adoption? A: Based on available information, ATOM appears to have broader enterprise adoption through the Cosmos ecosystem, powering interoperable blockchain networks across multiple industries. Information on institutional holdings for both tokens is limited.
Q5: What are the long-term price predictions for DELABS and ATOM by 2030? A: For DELABS, the base scenario predicts a range of $0.008502571132965 - $0.011818573874821, with an optimistic scenario above $0.011818573874821. For ATOM, the base scenario predicts a range of $3.928461719097431 - $5.578415641118352, with an optimistic scenario above $5.578415641118352.
Q6: How should investors allocate their portfolio between DELABS and ATOM? A: Conservative investors might consider allocating 20% to DELABS and 80% to ATOM, while aggressive investors might opt for 40% DELABS and 60% ATOM. However, individual allocation should be based on personal risk tolerance and investment goals.
Q7: What are the main risks associated with investing in DELABS and ATOM? A: DELABS faces higher volatility due to lower market cap and trading volume, as well as potential scalability and network stability issues. ATOM is susceptible to broader crypto market trends and potential security vulnerabilities in its IBC protocol. Both tokens face regulatory risks, with ATOM potentially facing more scrutiny due to its cross-chain nature.
Share
Content
Introduction: DELABS vs ATOM Investment Comparison
I. Price History Comparison and Current Market Status
II. Key Factors Affecting Investment Value of DELABS vs ATOM
III. 2025-2030 Price Prediction: DELABS vs ATOM
IV. Investment Strategy Comparison: DELABS vs ATOM
V. Potential Risk Comparison
VI. Conclusion: Which Is the Better Buy?
VII. FAQ

