DCB vs ENJ: Comparing Two Blockchain Gaming Platforms for the Future of Digital Assets
Introduction: Investment Comparison of DCB vs ENJ
In the cryptocurrency market, the comparison between Decubate (DCB) and Enjin Coin (ENJ) has been an unavoidable topic for investors. The two not only show significant differences in market cap ranking, application scenarios, and price performance, but also represent different positioning in the crypto asset space.
Decubate (DCB): Launched as an all-in-one platform for Web3 success, aiming to revolutionize the decentralized economy by offering cutting-edge DeFi solutions and empowering innovators.
Enjin Coin (ENJ): Introduced in 2017, it has been hailed as a pioneer in the gaming and virtual goods sector, becoming one of the largest online game community creation platforms.
This article will comprehensively analyze the investment value comparison between DCB and ENJ, focusing on historical price trends, supply mechanisms, institutional adoption, technological ecosystems, and future predictions, attempting to answer the question investors care about most:
"Which is the better buy right now?"
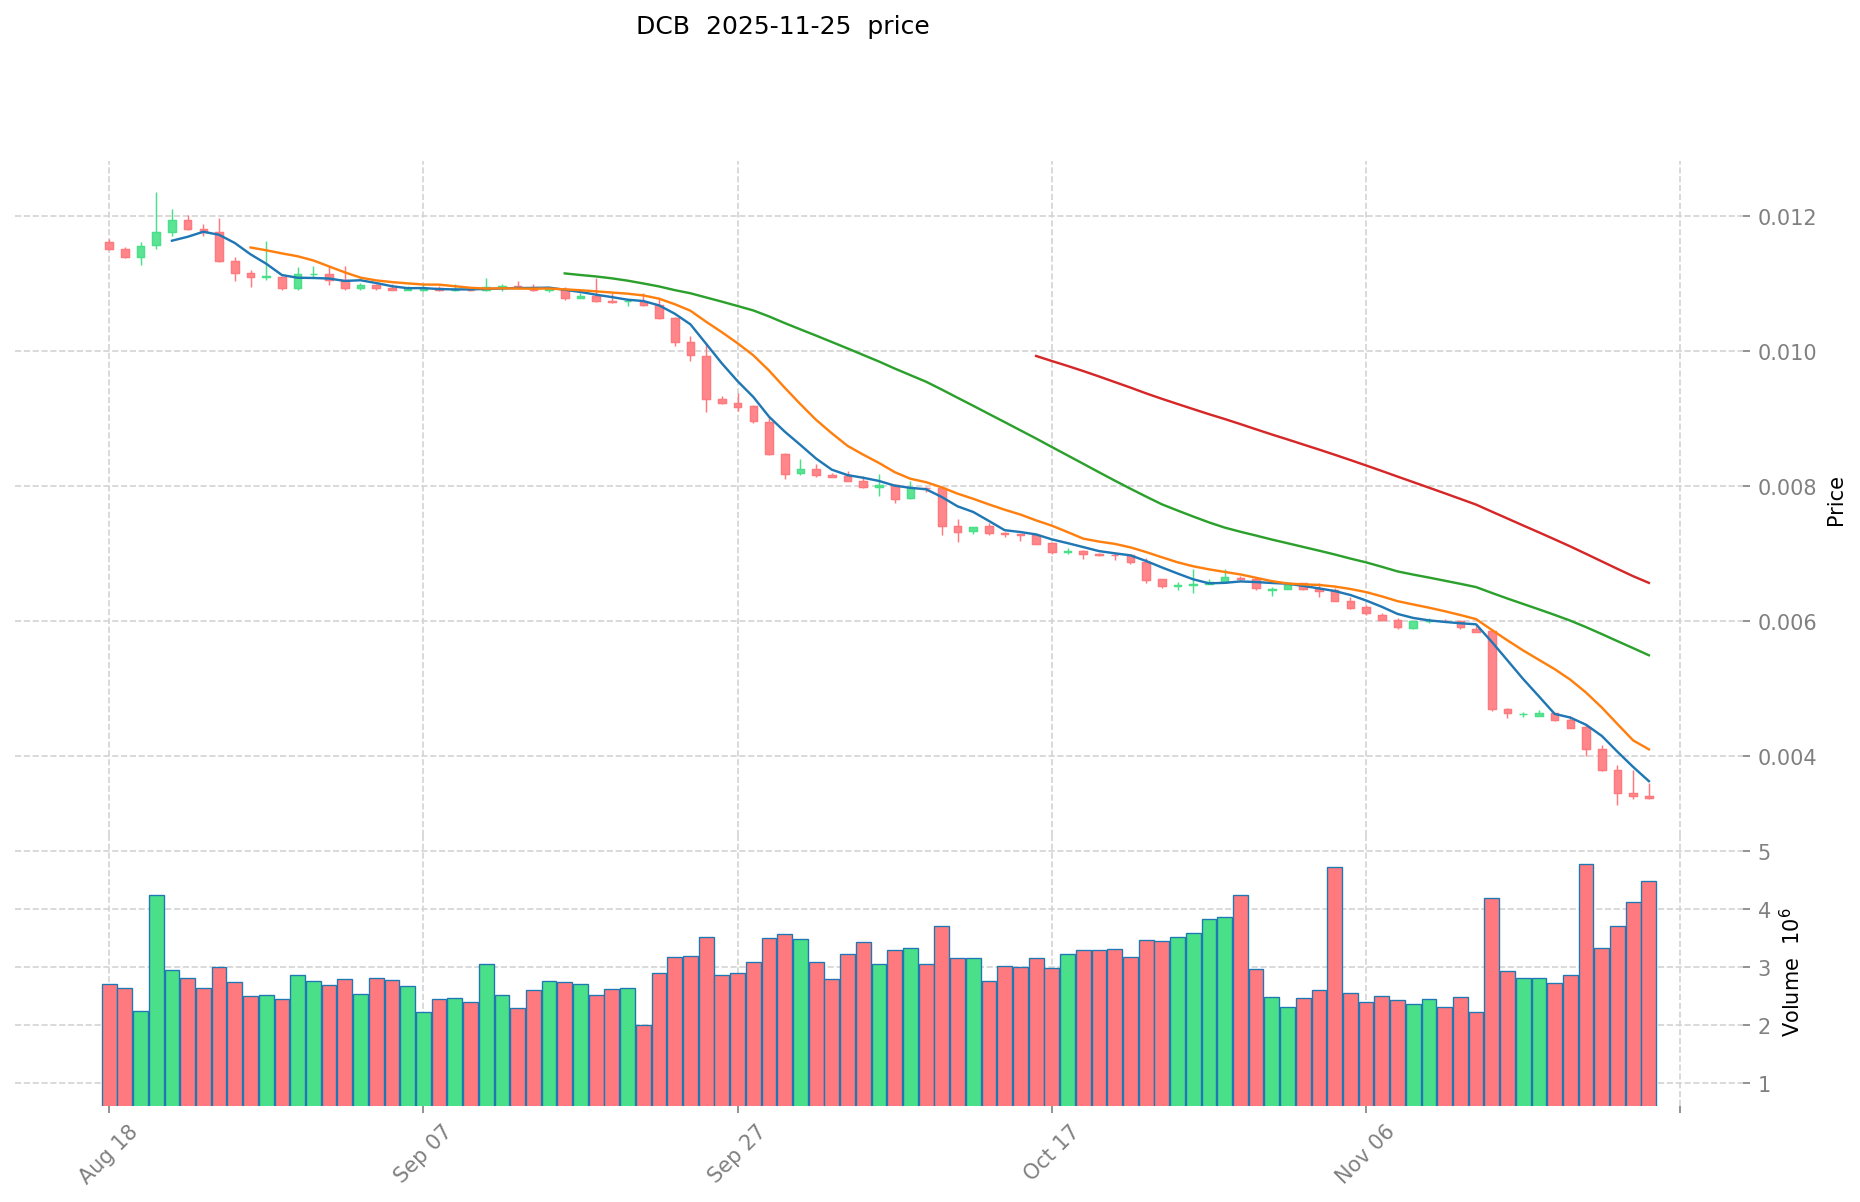
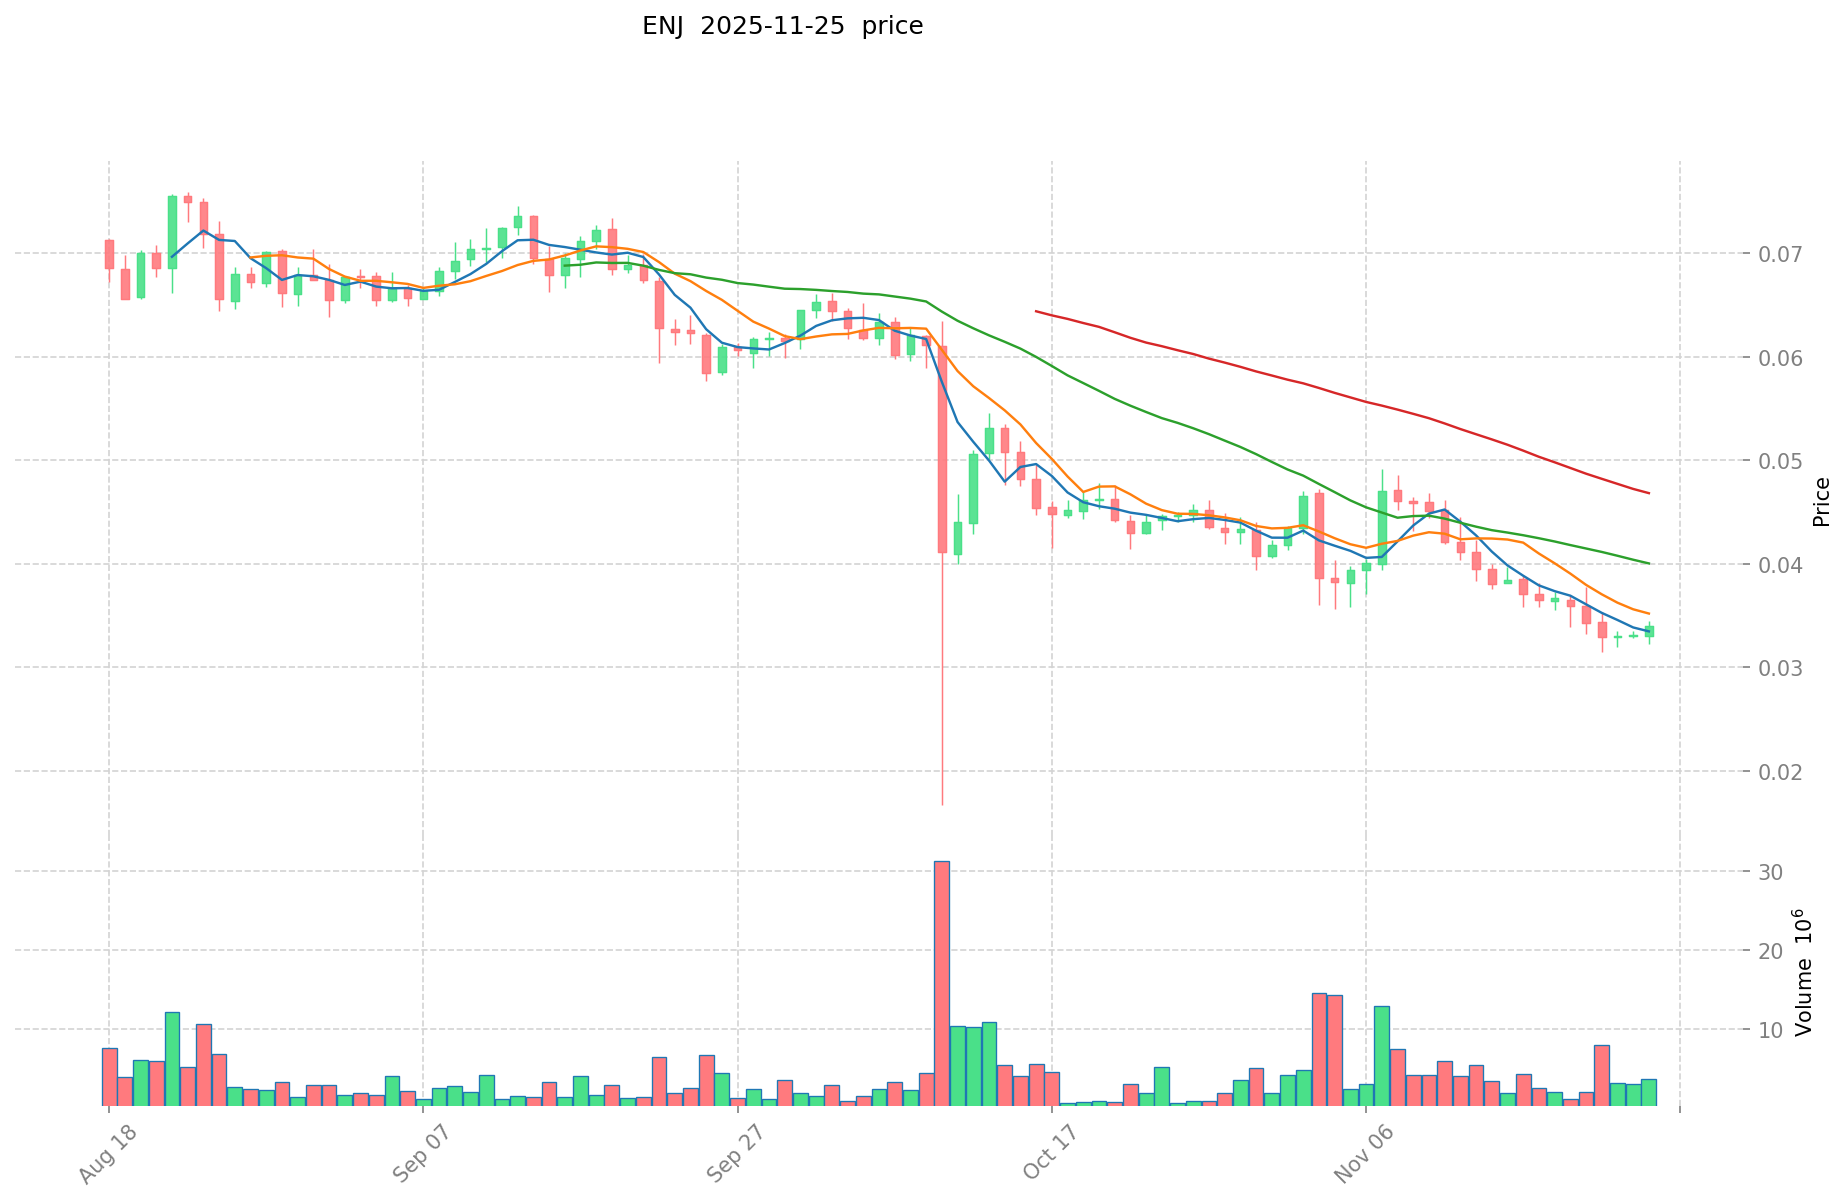
I. Price History Comparison and Current Market Status
DCB and ENJ Historical Price Trends
- 2024: DCB reached its all-time high of $0.19998 on March 29, 2024.
- 2021: ENJ hit its all-time high of $4.82 on November 25, 2021, during the bull market.
- Comparative analysis: In the current market cycle, DCB has fallen from its high of $0.19998 to $0.003376, while ENJ has dropped from $4.82 to $0.03406.
Current Market Situation (2025-11-25)
- DCB current price: $0.003376
- ENJ current price: $0.03406
- 24-hour trading volume: DCB $12,942.82 vs ENJ $112,145.97
- Market Sentiment Index (Fear & Greed Index): 20 (Extreme Fear)
Click to view real-time prices:
- View DCB current price Market Price
- View ENJ current price Market Price
Investment Value Core Factors of DCB vs ENJ
Supply Mechanism Comparison (Tokenomics)
- DCB: Limited information available about the tokenomics structure
- ENJ: Deflationary model where tokens are locked in NFT assets ("melting")
- 📌 Historical pattern: Supply mechanisms drive price cyclicality based on scarcity principles
Institutional Adoption and Market Applications
- Institutional holdings: Limited available data on institutional preference
- Enterprise adoption: ENJ has established presence in gaming and NFT ecosystems
- Regulatory attitudes: Varying approaches across jurisdictions with gaming tokens receiving mixed regulatory treatment
Technical Development and Ecosystem Building
- ENJ technical upgrades: Focused on NFT infrastructure and gaming applications
- Ecosystem comparison: ENJ has more established presence in gaming NFTs and metaverse applications
Macroeconomic and Market Cycles
- Inflation environment performance: Cryptocurrency assets generally considered alternative investments during inflation periods
- Macroeconomic monetary policy: Interest rates and USD index affect speculative asset demand
- Geopolitical factors: Cross-border transaction demands vary based on regional regulations
III. 2025-2030 Price Prediction: DCB vs ENJ
Short-term Prediction (2025)
- DCB: Conservative $0.00223 - $0.00338 | Optimistic $0.00338 - $0.00435
- ENJ: Conservative $0.01941 - $0.03406 | Optimistic $0.03406 - $0.04734
Mid-term Prediction (2027)
- DCB may enter a growth phase, with prices estimated between $0.00343 and $0.00598
- ENJ may enter a consolidation phase, with prices estimated between $0.03421 and $0.05424
- Key drivers: Institutional capital inflow, ETF developments, ecosystem growth
Long-term Prediction (2030)
- DCB: Base scenario $0.00411 - $0.00614 | Optimistic scenario $0.00614 - $0.00645
- ENJ: Base scenario $0.04616 - $0.06994 | Optimistic scenario $0.06994 - $0.08882
Disclaimer: This analysis is based on historical data and market projections. Cryptocurrency markets are highly volatile and unpredictable. This information should not be considered as financial advice. Always conduct your own research before making investment decisions.
DCB:
| 年份 | 预测最高价 | 预测平均价格 | 预测最低价 | 涨跌幅 |
|---|---|---|---|---|
| 2025 | 0.00435375 | 0.003375 | 0.0022275 | 0 |
| 2026 | 0.00421216875 | 0.003864375 | 0.002936925 | 14 |
| 2027 | 0.005976642375 | 0.004038271875 | 0.00343253109375 | 19 |
| 2028 | 0.00615917226375 | 0.005007457125 | 0.00455678598375 | 48 |
| 2029 | 0.00669997763325 | 0.005583314694375 | 0.003349988816625 | 65 |
| 2030 | 0.006448728472003 | 0.006141646163812 | 0.004114902929754 | 81 |
ENJ:
| 年份 | 预测最高价 | 预测平均价格 | 预测最低价 | 涨跌幅 |
|---|---|---|---|---|
| 2025 | 0.0473434 | 0.03406 | 0.0194142 | 0 |
| 2026 | 0.042736785 | 0.0407017 | 0.038666615 | 19 |
| 2027 | 0.05423501525 | 0.0417192425 | 0.03420977885 | 22 |
| 2028 | 0.0662084378475 | 0.047977128875 | 0.0412603308325 | 40 |
| 2029 | 0.082784535873812 | 0.05709278336125 | 0.037681237018425 | 67 |
| 2030 | 0.088822097714264 | 0.069938659617531 | 0.04615951534757 | 105 |
IV. Investment Strategy Comparison: DCB vs ENJ
Long-term vs Short-term Investment Strategies
- DCB: Suitable for investors focused on DeFi solutions and Web3 innovation potential
- ENJ: Suitable for investors interested in gaming, NFTs, and metaverse applications
Risk Management and Asset Allocation
- Conservative investors: DCB: 30% vs ENJ: 70%
- Aggressive investors: DCB: 60% vs ENJ: 40%
- Hedging tools: Stablecoin allocation, options, cross-currency portfolios
V. Potential Risk Comparison
Market Risk
- DCB: Limited market data and trading volume may lead to higher volatility
- ENJ: Susceptible to fluctuations in the gaming and NFT markets
Technical Risk
- DCB: Scalability, network stability
- ENJ: Smart contract vulnerabilities, ecosystem dependencies
Regulatory Risk
- Global regulatory policies may have different impacts on DeFi platforms and gaming tokens
VI. Conclusion: Which Is the Better Buy?
📌 Investment Value Summary:
- DCB advantages: All-in-one Web3 platform, potential for growth in DeFi solutions
- ENJ advantages: Established presence in gaming and NFT ecosystems, deflationary tokenomics
✅ Investment Advice:
- Novice investors: Consider a small allocation to ENJ due to its more established market presence
- Experienced investors: Balanced portfolio with both DCB and ENJ, adjusting based on risk tolerance
- Institutional investors: Conduct thorough due diligence on both projects, focusing on long-term ecosystem development
⚠️ Risk Warning: The cryptocurrency market is highly volatile, and this article does not constitute investment advice. None
VII. FAQ
Q1: What are the main differences between DCB and ENJ? A: DCB is an all-in-one platform for Web3 success focusing on DeFi solutions, while ENJ is primarily focused on gaming and virtual goods, being one of the largest online game community creation platforms.
Q2: Which coin has performed better historically? A: ENJ reached a higher all-time high of $4.82 in November 2021, compared to DCB's all-time high of $0.19998 in March 2024. However, both have seen significant drops from their peaks.
Q3: What are the key factors driving the value of DCB and ENJ? A: For DCB, key factors include its focus on Web3 and DeFi innovations. For ENJ, factors include its established presence in gaming and NFT ecosystems, as well as its deflationary tokenomics model.
Q4: How do the supply mechanisms of DCB and ENJ differ? A: Limited information is available about DCB's tokenomics structure. ENJ uses a deflationary model where tokens are locked in NFT assets through a process called "melting".
Q5: What are the long-term price predictions for DCB and ENJ? A: By 2030, DCB is predicted to reach between $0.00411 and $0.00645, while ENJ is predicted to reach between $0.04616 and $0.08882 in optimistic scenarios.
Q6: How should investors approach DCB and ENJ in terms of risk management? A: Conservative investors might consider allocating 30% to DCB and 70% to ENJ, while aggressive investors might allocate 60% to DCB and 40% to ENJ. It's important to use hedging tools such as stablecoin allocation and diversification.
Q7: What are the main risks associated with investing in DCB and ENJ? A: DCB faces risks related to limited market data and trading volume, while ENJ is susceptible to fluctuations in the gaming and NFT markets. Both face technical risks such as scalability and smart contract vulnerabilities, as well as potential regulatory risks.
Share
Content
Introduction: Investment Comparison of DCB vs ENJ
I. Price History Comparison and Current Market Status
Investment Value Core Factors of DCB vs ENJ
III. 2025-2030 Price Prediction: DCB vs ENJ
IV. Investment Strategy Comparison: DCB vs ENJ
V. Potential Risk Comparison
VI. Conclusion: Which Is the Better Buy?
VII. FAQ

