Complete Guide to Technical Analysis Candlestick Patterns for Trading

2025-12-29 11:33:08
Crypto Trading
Crypto Tutorial
K-line
Spot Trading
Article Rating : 3.5
half-star
163 ratings
Master Japanese candlesticks for cryptocurrency trading with this comprehensive guide. Discover how candlesticks work, learn to interpret bullish and bearish patterns, and explore proven strategies designed for both beginners and intermediate traders on Gate.
Complete Guide to Technical Analysis Candlestick Patterns for Trading

What Is a Candlestick?

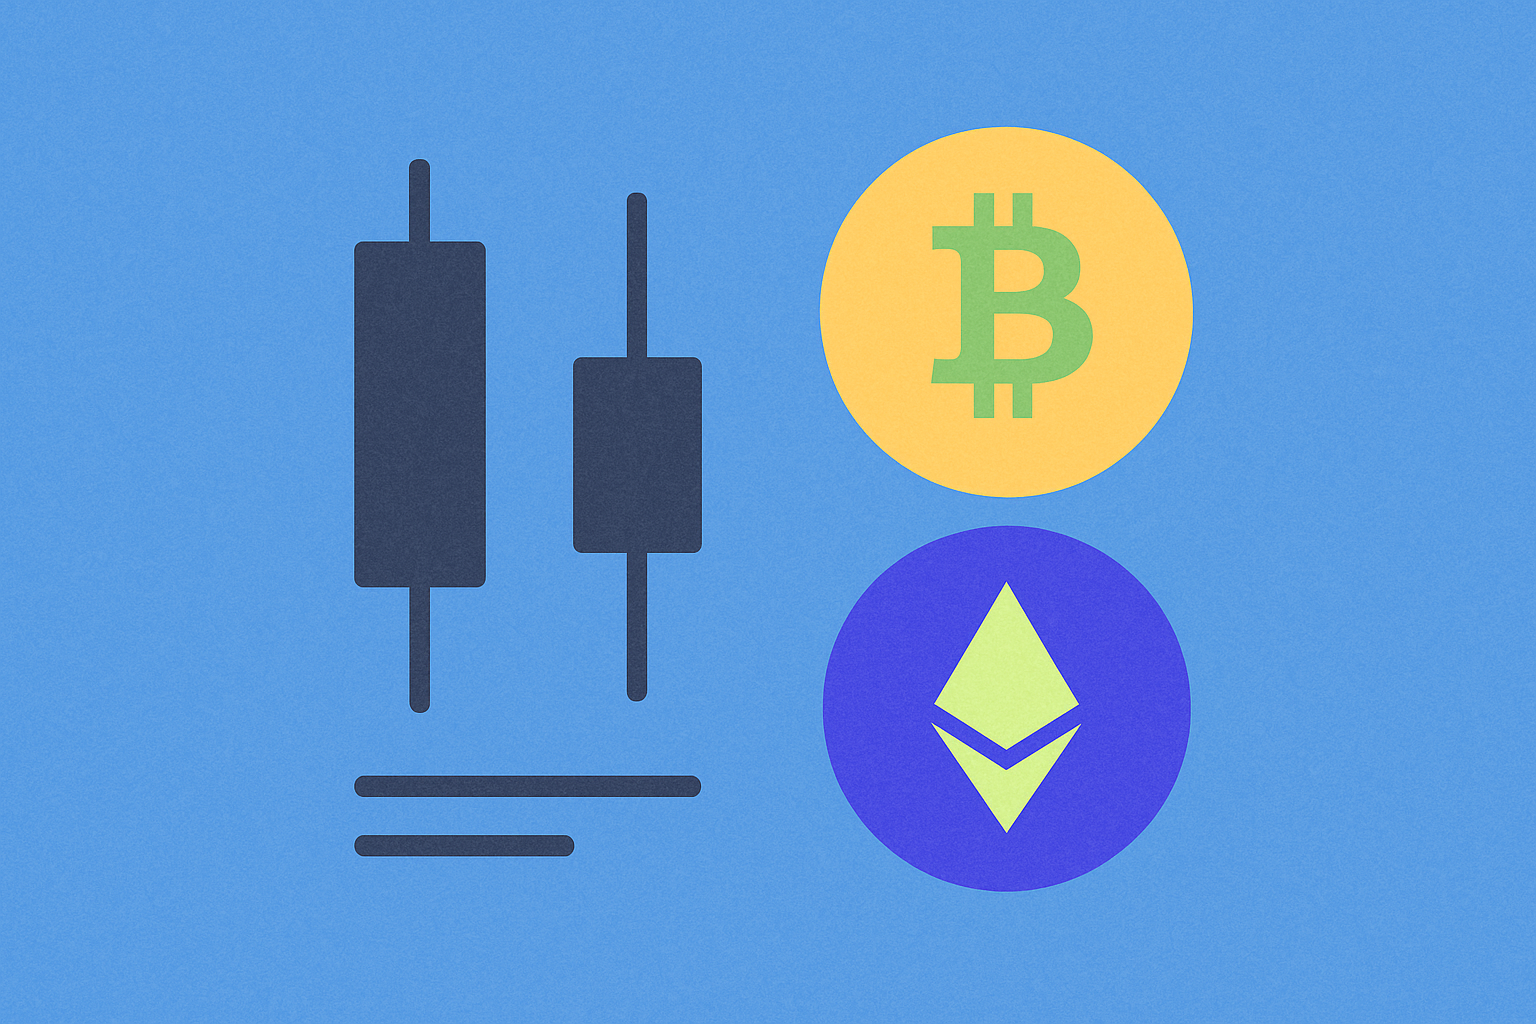
A candlestick visually represents the price movement of a digital asset—such as Bitcoin or Ethereum—over a specified time interval (e.g., one minute, one hour, one day). This chart type, referred to as a candlestick graph or candlestick chart, ranks among the most widely used tools for analyzing price action on cryptocurrency trading platforms.

Each candlestick contains several key components:

  • Body: Indicates the range between the opening price and closing price for the selected period.

    • If the closing price exceeds the opening price, the candlestick is typically green (or white)—a bullish candlestick signaling upward price movement.
    • If the closing price falls below the opening price, the candlestick appears red (or black)—a bearish candlestick signaling a price decline.
  • Wicks (Shadows): Thin lines extending above and below the body, representing the highest and lowest prices reached during the interval.

Candlesticks in Technical Analysis

Candlesticks play a vital role in cryptocurrency technical analysis and offer traders several benefits:

  • Price Movement Analysis: Candlesticks enable traders to quickly assess how an asset’s price has shifted and to identify trends—bullish, bearish, or sideways. Their clear format makes it easier to spot critical market patterns.

  • Forecasting Market Moves: By analyzing specific candlestick patterns (like the hammer, engulfing, or doji), traders attempt to anticipate market direction. These formations often indicate reversals or continuations of current trends.

  • Informed Decision-Making: Candlestick charts deliver valuable insights into market volatility and the relative strength of buyers versus sellers, helping traders determine optimal entry and exit points.

  • Versatility and Accessibility: Both beginners and seasoned professionals use candlesticks. Their intuitive design and ability to display multiple data points concisely make them indispensable for technical analysis.

Example

Consider viewing a one-hour Bitcoin chart on a cryptocurrency platform. A candlestick may display:

  • Opening price: the initial value for the period
  • Closing price: the ending value for the period
  • High: the highest price reached
  • Low: the lowest price reached

This candlestick’s body shows the range between opening and closing prices, while the upper and lower wicks mark intraperiod fluctuations. This visualization reveals not only price direction but also volatility and buy/sell pressure throughout the interval.

Conclusion

Candlesticks are the foundation of technical analysis on cryptocurrency exchanges. They give traders clear, visual insights into market behavior for informed decision-making. Whether you're a newcomer learning the basics of technical analysis or a seasoned professional refining strategies, mastering candlestick chart interpretation is critical to success in crypto trading.

FAQ

What Is a Candlestick in Technical Analysis?

A candlestick graphically depicts an asset's price over a specific timeframe. It displays the opening, closing, high, and low prices, forming a visual structure with a body and wicks to indicate market direction and volatility.

What Is Candlestick Analysis and What Is It Used For?

Candlestick analysis studies candlestick charts to identify price patterns and market trends. Traders use it to pinpoint entry and exit opportunities by examining opening, closing, high, and low prices for each interval.

What Are Japanese Candlesticks in Technical Analysis?

Japanese candlesticks graphically represent an asset’s opening, closing, high, and low prices for a chosen period. Each candlestick has a body (showing the price range) and wicks (marking the extremes). These are essential tools for analyzing market trends and patterns in cryptocurrencies.

How Can I Interpret Trading Candlesticks?

Candlesticks display opening, closing, high, and low prices for each interval. The body shows the difference between opening and closing; upper and lower wicks mark extremes. Green candlesticks represent upward moves, red indicate declines. Analyze patterns to spot trends and identify entry or exit points.

What Are the Main Components of a Japanese Candlestick?

A Japanese candlestick consists of four elements: opening price, closing price, high, and low. The body displays the difference between opening and closing, while the wicks indicate the extreme prices during the period.

What Is the Difference Between Bullish and Bearish Candlesticks?

Bullish candlesticks (green) close above their opening price, signifying buying momentum. Bearish candlesticks (red) close below the opening, indicating selling pressure. Both reflect market dynamics for the period in question.

Which Candlestick Patterns Are Most Important for Predicting Price Movements?

Key patterns include the hammer, bullish engulfing, three white soldiers, and head-and-shoulders. These reflect shifts in price momentum and buy/sell pressure, enabling more precise predictions of reversals and trend continuations.

How Do Candlesticks Relate to Other Technical Indicators?

Candlesticks complement other indicators, such as moving averages, RSI, and MACD, to confirm buy/sell signals. Volume data within candlesticks validates trend strength. Together, these tools provide a robust analysis of price movement.

* The information is not intended to be and does not constitute financial advice or any other recommendation of any sort offered or endorsed by Gate.
Related Articles
What is M Pattern in Trading

What is M Pattern in Trading

This article offers a comprehensive guide to mastering the M Pattern, a key bearish reversal signal in cryptocurrency trading. It focuses on recognizing key components of the M Pattern, including the peaks, troughs, neckline, and volume dynamics, ensuring traders enhance their market strategies. Readers will learn proven strategies for trading the M Pattern, differentiating authentic signals from false ones, and improving risk management and potential profits. Tailored for crypto traders, this piece provides essential insights to navigate volatile markets with advanced technical analysis using Gate's tools.
2025-08-29 05:20:33
How to Use MACD, RSI, and KDJ Indicators for Crypto Trading?

How to Use MACD, RSI, and KDJ Indicators for Crypto Trading?

This article delves into the effective use of MACD, RSI, and KDJ indicators for crypto trading, offering insights into market trends and potential reversals. It evaluates these indicators, comparing their key signals and best use cases for optimizing trading strategies. The text explores how moving average crossovers signal trend shifts, emphasizing the significance of combining indicators for stronger confirmations and minimizing false signals. Additionally, volume and price divergence analysis are highlighted to enhance trend prediction accuracy. Aimed at traders seeking improved technical analysis methods, this comprehensive guide is structured to increase profitability and strategic trading efficiency.
2025-10-25 10:21:15
What is a red hammer Candlestick and how to use it

What is a red hammer Candlestick and how to use it

Understanding how the red hammer Candlestick pattern serves as a powerful bullish reversal signal is crucial for cryptocurrency traders operating in volatile markets. This article helps identify genuine red hammer patterns, emphasizing their formation after downtrends and at key support levels, and validating them with higher trading volume. Learn strategic trading implementation, utilizing technical indicators and risk management to enhance profitability. Gate's advanced tools assist in pattern recognition and real-time alerts. Optimize your trading approach through red hammer analysis to enhance your cryptocurrency investment strategy.
2025-11-03 03:11:16
Decoding the KDJ Indicator: A Comprehensive Guide

Decoding the KDJ Indicator: A Comprehensive Guide

"Decoding the KDJ Indicator" is a comprehensive guide for traders and analysts, focusing on the KDJ as a short-term analysis tool in financial markets. It explains the indicator's components: K-line, D-line, and J-line, and their roles in identifying overbought and oversold conditions. The article highlights key usage rules and signals like Golden and Death Crosses, and divergence detection. It also discusses the practical application of KDJ in day trading and crypto markets, guiding readers on decision-making with it and addressing FAQs for deeper understanding. Suitable for traders seeking clearer insights into price movements and market sentiment.
2025-11-26 09:10:48
How to Use the MACD Indicator for Crypto Trading Success

How to Use the MACD Indicator for Crypto Trading Success

The article delves into using the MACD indicator for successful crypto trading by breaking down its components: DIF, DEA, and histogram. It explains how these elements work together to identify market momentum and potential trading opportunities. Key insights include recognizing "golden cross" buy signals, leveraging MACD for analyzing market trends, and generating trading signals for optimal entry and exit points. The content is tailored for traders seeking actionable insights to enhance their trading strategies. This comprehensive guide emphasizes clear, structured analysis to facilitate informed trading decisions.
2025-12-02 09:23:50
Understanding Bullish Candlestick Patterns for Effective Trading Strategies

Understanding Bullish Candlestick Patterns for Effective Trading Strategies

Understand bullish candlestick patterns and enhance trading strategies by decoding market trends. This article covers what candlestick patterns are, focusing on bullish, bearish, and continuation patterns to identify market sentiment. Readers will learn how to read and apply these patterns, benefiting both novice and experienced traders. Structured logically, each section builds understanding, culminating in a comprehensive view to inform trading decisions effectively. Keywords like candlestick patterns, bullish trends, and market sentiment are optimized for quick readability and scanning.
2025-10-29 08:17:49
Recommended for You
How does Aster's 2 million Twitter followers and 50+ DApps drive community engagement and ecosystem growth in 2026?

How does Aster's 2 million Twitter followers and 50+ DApps drive community engagement and ecosystem growth in 2026?

# Article Overview Aster demonstrates explosive ecosystem growth through its 2 million Twitter followers, 50+ integrated DApps, and 524,000 active users on Gate. This comprehensive guide explores how strategic community engagement, $10 million reward pools, and sophisticated incentive mechanisms drive sustained participation and platform expansion. Learn how Aster's social media dominance translates into tangible market advantages, user adoption, and ecosystem sustainability. Perfect for traders, developers, and token holders seeking to understand Aster's three-engine growth model and maximize opportunities within this thriving DeFi infrastructure. Discover the mechanisms fueling community loyalty and long-term value creation on Gate's ecosystem.
2026-01-04 11:22:35
What is Canton (CC) Token? A Complete Fundamental Analysis Guide for Crypto Investors

What is Canton (CC) Token? A Complete Fundamental Analysis Guide for Crypto Investors

# Introduction: What is Canton (CC) Token? A Complete Fundamental Analysis Guide for Crypto Investors This comprehensive guide examines Canton (CC) Token, an institutional-grade enterprise blockchain designed for real-time settlement and multi-asset synchronization. The article addresses critical investor needs by analyzing Canton's decentralized architecture, technical innovations, and enterprise use cases across financial services and supply chain management. Readers will discover how Canton's network-of-networks model enables privacy-preserving transactions while maintaining regulatory compliance—distinguishing it from competing blockchain solutions. The guide evaluates the project's strong leadership team, ambitious 2025-2026 roadmap milestones, and tokenomics structure with $12 million market cap potential. Whether trading on Gate or assessing long-term fundamentals, this analysis provides institutional investors and crypto enthusiasts with essential data for evaluating Canton's investment viability and
2026-01-04 11:19:24
How do exchange inflows and outflows affect Bitcoin Cash (BCH) holdings and market volatility?

How do exchange inflows and outflows affect Bitcoin Cash (BCH) holdings and market volatility?

# Introduction This comprehensive guide examines how exchange inflows and outflows directly impact Bitcoin Cash (BCH) holdings and market volatility across Gate and other trading platforms. The article reveals that BCH's 55.4 billion daily trading volume establishes liquidity infrastructure enabling efficient price discovery, while whale concentration—with top 1,500 addresses controlling 45% of supply—amplifies volatility through coordinated movements. Institutional capital strengthens market stability through staking services offering up to 9% yields and regulatory clarity frameworks, fundamentally reshaping exchange flow patterns toward long-term holding orientations. BCH's dual-role strategy balancing payment function with investment appeal, underpinned by its 10.67 billion market cap and 36.96% annual appreciation, demonstrates resilience amid market pressures. Ideal for traders, institutional investors, and BCH holders seeking to monitor exchange fund flows via Gate, Glassnode, and CryptoQuant for predi
2026-01-04 11:16:55
How does TAO compare to other AI-powered crypto coins in market cap and performance?

How does TAO compare to other AI-powered crypto coins in market cap and performance?

# Article Introduction **TAO (Bittensor) vs. AI Crypto Competitors: Market Cap, Performance & Growth Analysis** This comprehensive guide examines TAO's competitive positioning within the AI cryptocurrency ecosystem, analyzing its $2.7 billion market cap ranking against major competitors like NEAR Protocol and Internet Computer. Readers will discover TAO's performance metrics, including its 8.86% 24-hour gains and superior ROI resilience compared to Ethereum (-25%) and Solana (-19.1%) during H1 2025. The article explores TAO's differentiation through its innovative proof-of-intelligence model, decentralized AI infrastructure, and specialized subnets that democratize machine learning development. Ideal for investors, blockchain developers, and AI enthusiasts evaluating decentralized AI platforms, this analysis provides actionable insights on market share evolution, volatility comparisons, and liquidity data from Gate trading platforms. Whether assessing institutional adoption trends or understanding TAO's uni
2026-01-04 11:13:45
Sàn DEX là gì?

Sàn DEX là gì?

# Giới Thiệu Về Sàn Giao Dịch Phi Tập Trung (DEX) Bài viết này cung cấp hướng dẫn toàn diện về sàn DEX - nền tảng giao dịch tiền điện tử phi tập trung, giúp nhà đầu tư nắm quyền kiểm soát tài sản hoàn toàn. Nội dung giải quyết các câu hỏi cơ bản về cách DEX hoạt động thông qua công nghệ blockchain và hợp đồng thông minh (AMM). Bài viết phân tích chi tiết ưu điểm DEX như an toàn cao, minh bạch và không cần KYC, đồng thời cảnh báo những rủi ro như giao diện phức tạp và mất mát vô thường. Thông qua so sánh DEX với sàn CEX tập trung, bạn sẽ hiểu rõ lựa chọn phù hợp. Phần FAQ giải đáp các thắc mắc thực tế cho người dùng mới bắt đầu tìm hiểu về giao dịch phi tập trung trên Gate và các nền tảng DEX hàng đầu.
2026-01-04 11:11:54
Main Differences Between TradFi and DeFi: A Complete Guide in 2026

Main Differences Between TradFi and DeFi: A Complete Guide in 2026

# Article Overview: Main Differences Between TradFi and DeFi: A Complete Guide in 2026 This comprehensive guide dissects the architectural, economic, and operational distinctions between Traditional Finance (TradFi) and Decentralized Finance (DeFi), revealing why both systems coexist in today's financial ecosystem. The article addresses critical questions for investors, underbanked populations, and yield-seeking traders navigating the transition between centralized banking and blockchain-based protocols. From architectural fundamentals—centralization versus decentralization—through cost revolution, accessibility barriers, transparency mechanisms, and practical implementation strategies, this guide establishes DeFi advantages in efficiency and accessibility while acknowledging TradFi's regulatory protections. Ideal for beginners exploring DeFi fundamentals and experienced investors optimizing portfolio allocation, this resource clarifies TradFi versus DeFi differences through real-world examples, fee comparis
2026-01-04 11:11:50